9430 Peony St · Bayonet Point, FL
Flood risk 1/10 · Minimal
- FEMA flood zone
- X (unshaded)
- Chance of flooding over 30 yrs
- 0.0%
- Est. flood insurance / yr
- $507 – $1,088
Fire risk 4/10 · Minor
- Est. fire insurance / yr
- $947 – $1,759
Heat risk 10/10 · Severe
- Hot days now (above 108°F)
- 7 days/yr
- Hot days in 30 yrs
- 25 days/yr
Wind risk 10/10 · Severe
- Chance of severe wind over 30 yrs
- 99.0%
Air-quality risk 2/10 · Minimal
- Unhealthy air days now
- 1 days/yr
- Unhealthy air days in 30 yrs
- 3 days/yr
Risk factors via First Street. Map © Google.
Why this score? — see what drove the B- grade
The composite is a weighted blend of 9 inputs, each scored 0–100. Each bar is that input's sub-score; the figure is the points it added to the 100-point composite (weight × sub-score).
- Cash flow +30.0/30.0
- 1% rule +10.0/10.0
- DSCR +10.0/10.0
- ARV discount +7.5/15.0
- Schools +4.3/10.0
- Livability +3.5/5.0
- Condition / age +2.5/5.0
- Rent growth +2.0/5.0
- Appreciation +0.0/10.0
$60,000
🖨 Deal sheet (PDF) 📄 Offer letter ✓ Due diligence
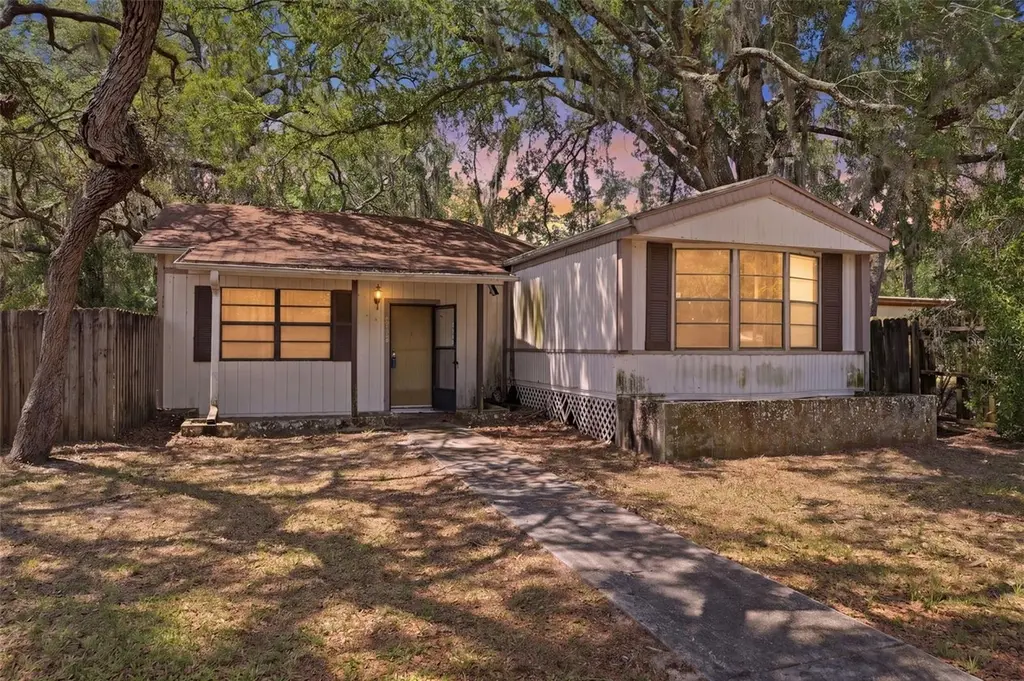
Listing remarks
Under contract-accepting backup offers. Great opportunity with endless potential! Located on a double lot in Griffin Park, this property is ideal for renovators or buyers looking for a fixer-upper project. Home is being sold AS IS and will require renovation. Zoned R1MH. According to county information, the property may allow for two dwellings if split back to the original plat (copy available through the Clerk of Court). Features include well and septic, plus a spacious 20’ x 23’ detached carport. Plenty of possibilities to renovate, rebuild, or maximize the lot’s potential.
Key facts
- Well and septic
- Zoned r1mh
- Detached carport
Tags
Property features AI
Finance
- Other: Property classified as residential (manufactured home); Zoning: R1MH
- Financial info: No lease restrictions
- HOA & community: No association fees; Pets allowed
Exterior
- Parking: Covered deeded parking; Driveway; 2-space carport
- Utilities: Well water; Septic tank; Private utilities
- Home design: Manufactured single-wide home; Fixer condition; One story; North-facing
- Construction: Metal frame with wood siding; Metal and shingle roof; Crawlspace foundation; Built in approximately (public records)
- Exterior features: Covered front and rear porches; Private mailbox; Rain gutters; Wood fencing; Oak trees on property; Paved road access; Oversized lot
Interior
- Kitchen: Range hood
- Bedrooms: 3 bedrooms
- Flooring: Vinyl flooring
- Bathrooms: 2 full bathrooms
- Heating & cooling: Central heating (electric); Central air conditioning
- Interior features: Built-in features; Ceiling fans; Split bedroom layout; Thermostat; Walk-in closets; Bonus room; Inside utility
- Laundry & utility: Inside laundry
Neighborhood map
What this means for you Summary
Snapshot
- This is a 3-bed/2.0-bath manufactured listed at $60k.
Deal economics
- At list price, monthly cash flow is $971 ($12k/yr) — positive.
- The deal already cash-flows at list — no discount required.
- Meets the 1% rule at list price ($2k rent vs $60k).
- Cap rate 25.7% vs local median 5.3% in Bayonet Point — top-decile yield for the area; either an underpriced asset or a hidden risk that comps aren't pricing in. Stress-test before assuming the spread holds.
Location & tenants
- Location reads 69/100 on livability (#485 in FL) — a middle-class / working-renter tenant base. Strengths: cost of living A+, housing A+, health & safety A+; Watch: crime D+, amenities D+, commute F.
- Pasco (suburban): math 50% / reading 52% proficiency, ranked #32 of 73 in FL (top 44%) — acceptable for families but not a draw, mixed tenant base, ~2y average lease.
- Zoned schools: Schrader Elementary School (math 38% / reading 35%, grade F, #1,656 of 2,144 statewide, top 78%, 601 students, 82% FRL); Bayonet Point Middle School (math 38% / reading 35%, grade F, #405 of 571 statewide, top 72%, 737 students, 84% FRL); Fivay High School (math 20% / reading 28%, grade F, #529 of 667 statewide, top 80%, 1,610 students, 78% FRL) — zoned schools average 82% FRL vs 48% district-wide (33 pts higher); higher-poverty schools than district average — tighter screening recommended.
- Zoned-school proficiency averages 32% at this address vs 51% district-wide (-19 pts) — the specific schools serving this property underperform the Pasco average; the district grade overstates school quality for this exact location.
- Market conditions: Rents soft (-1.9%/yr); 360 active listings in the ZIP; 8 comparable units currently listed for rent nearby; rentals at typical pace (median 26d on market — plan ~3-4 weeks tenant-placement turnaround); 6,765 units permitted in Pasco County in 2024 (1,250 in 5+ unit buildings).
Forward outlook
- Local home prices are declining (-3.0%/yr); year-one equity from $415 of loan paydown is wiped out by about $2k of value loss. Plan a longer hold.
- Pasco County population projected at +29% by 2050 — long-run rental-demand tailwind backs the buy-and-hold thesis.
- At projected returns (-3.0% appreciation + 0.0% rent growth), your $17k cash investment doubles in ~2 years — after that, you're playing with house money.
Negotiation context
- Only 1 days on market — expect competitive offers; lowballing is unlikely to land.
- 4 sale attempts since 21y ago with the ask held roughly flat each time — persistent listings suggest the price (not the market) is what's stuck; bring a comps-based counter.
- Current owner paid $48k; 25% above their basis — modest negotiation headroom, anchor on the comps not their cost.
Risks & watch-outs
- Climate carrying-cost: severe wind risk, 99% chance of damaging wind over 30y; extreme-heat days projected 7→25/yr by 2055 (HVAC capex compounding) — expect insurance premiums to compound above CPI over the hold.
Questions for the listing agent
- Is there a deadline driving the sale (1031 exchange, divorce, estate, relocation)? That informs how much negotiation room exists.
- Schools are F-rated, which usually means shorter tenancies and higher turnover. Who's the typical renter profile here, and what's been the actual vacancy rate?
- Crime grade is D in this area — have there been break-ins, vandalism, or insurance claims at this property in the last 3 years? What carrier currently insures it and at what premium?
- What's the average days-on-market for RENTAL listings here right now (not sales)? A rising rental-DOM trend means longer vacancies and softer asking-rent achievability than the comps imply.
- What's the recent tenant-quality profile in this submarket — average credit score on applications, eviction rate, late-payment / NSF rate, and stable-employment percentage? A property-management company in the area should have these aggregated.
- How much new for-sale + rental construction is in the pipeline within 1–3 miles? Heavy new supply typically softens prices + rents 12–24 months out; constrained supply supports both.
Investment metrics
- 1% rule
- 3.01% ✓
- Cap rate
- 25.71%
- Cash-on-cash
- 69.35%
- DSCR
- 4.09
- GRM
- 2.8
CMA / ARV
- ARV (on-the-fly)
- $158,522
- Comps found
- 8
Show comp detail 8 sales within ~0.75 mi
| Address | Dist | Beds/Ba | Sqft | Sold | Price | $/sf | Match |
|---|---|---|---|---|---|---|---|
| 9430 Peony St | 0.00mi | 3/2.0 | 938 (0%) | 0mo | $60,000 | $64 | 100 |
| 9211 Teak St | 0.26mi | 3/2.0 | 896 (-4%) | 7mo | $74,000 | $83 | 75 |
| 9132 Mango St | 0.32mi | 4/3.0 (+1) | 924 (-2%) | 12mo | $115,000 | $124 | 64 |
| 9026 Bourbon St | 0.47mi | 2/2.0 (-1) | 864 (-8%) | 1mo | $160,000 | $185 | 60 |
| 9602 Andy Dr | 0.47mi | 2/1.0 (-1) | 984 (+5%) | 2mo | $103,000 | $105 | 59 |
| 9514 Chris St | 0.54mi | 2/2.0 (-1) | 896 (-4%) | 16mo | $200,000 | $223 | 49 |
| 11304 Altoona Ave | 0.54mi | 2/2.0 (-1) | 840 (-10%) | 9mo | $175,000 | $208 | 45 |
| 11321 Altoona Ave | 0.54mi | 2/2.0 (-1) | 1,056 (+13%) | 17mo | $178,000 | $169 | 35 |
Match score weights: distance 35% · size 25% · config 20% · recency 20%. Top-matched comps best support the ARV.
Projected returns pro-forma
-3.0% appreciation · 0.0% rent growth · sell at horizon
- IRR
- 65.3%
- Equity multiple
- 3.79×
- Total profit
- $46,874
- Equity at exit
- $8,946
- IRR
- 68.7%
- Equity multiple
- 6.96×
- Total profit
- $100,203
- Equity at exit
- $5,188
Cash invested: $16,800 (down + closing). Projections, not guarantees.
Landlord ↔ Tenant lean methodology
- Overall (STATE)
- 87 Strongly Landlord-Friendly
- State Florida
- 87 Strongly Landlord-Friendly · R+3
- County
- — inherits STATE
- City
- — inherits STATE
ZIP-level market 34654
- Home prices YoY
- -12.7%
- Rents YoY
- -1.9%
- Active inventory
- 360
- Price-to-rent
- 2.8×
Monthly cashflow live
- Estimated rent
- $1,806 high interval (Pro) →
- Mortgage (P&I)
- −$315
- Tax from tax record
- −$116 /mo · $1,393/yr
- Insurance
- −$25
- HOA
- −$0
- Vacancy / Maint / Mgmt
- −$379
- Net cashflow
- $971
Break-even live
Sensitivity live
| Price | -10% $1,005 | -5% $988 | +0% $971 | +5% $954 | +10% $937 |
|---|---|---|---|---|---|
| Rent | -10% $828 | -5% $900 | +0% $971 | +5% $1,042 | +10% $1,114 |
| Rate | -1.0pp $1,001 | -0.5pp $986 | base $971 | +0.5pp $955 | +1.0pp $940 |
UW: 25.0% down · 7.5% · 30yr · 1.5% tax · 5.0% vac · 8.0% maint · 8.0% mgmt
Financing live
Cash to close
- Down payment
- $15,000
- Closing costs
- $1,800
- Reserves months
- —
- Total cash needed
- —
Loan-product check · same deal, 3 products live
Conventional
25% down · 7.5% · 30yr
- Down + closing
- —
- Monthly P&I
- —
- Monthly cashflow
- —
- DSCR
- —
- Eligible?
- —
Personal DTI + credit; lowest rate.
DSCR
20% down · 8.5% · 30yr
- Down + closing
- —
- Monthly P&I
- —
- Monthly cashflow
- —
- DSCR
- —
- Eligible?
- —
No personal income docs; deal must DSCR.
Hard money
10% down · 12.0% · 12mo
- Down + closing
- —
- Monthly P&I
- —
- Monthly cashflow
- —
- DSCR
- —
- Eligible?
- —
Short-term bridge; refi at stabilization.
Rent comps 8 comps
| Address | Beds | Baths | Sqft | Rent | $/sqft | DOM | Units | Dist |
|---|---|---|---|---|---|---|---|---|
| 9440 Bourbon St Unit 9 New Port Richey, FL | 2.0 | 1.0 | 700 | $1,275 | $1.82 | 26d | 1 | 0.25mi |
| 12221 Holbrook Dr Bayonet Point, FL | 1.0–2.0 | 1.0–2.0 | 761 | $1,685 | $2.21 | 0d | 55 | 0.72mi |
| 11635 Salmon Dr Port Richey, FL | 2.0 | 1.5 | 816 | $1,500 | $1.84 | 26d | 1 | 0.88mi |
| 12909 Litewood Dr Hudson, FL | 3.0 | 2.0 | 1000 | $1,645 | $1.65 | 26d | 1 | 1.23mi |
| 12909 Litewood Dr Hudson, FL | 3.0 | 2.0 | 984 | $1,645 | $1.67 | 19d | 1 | 1.23mi |
| 12200 Hudson Ridge Dr Port Richey, FL | 2.0–3.0 | 2.0 | 1107 | $1,704 | $1.54 | 4d | 10 | 1.29mi |
| 8304 Mill Creek Ln Hudson, FL | 2.0 | 2.0 | 1000 | $1,650 | $1.65 | 26d | 1 | 1.32mi |
| 8161 Braddock Cir #1 Port Richey, FL | 2.0 | 2.0 | 1000 | $1,595 | $1.59 | 19d | 1 | 1.33mi |
Listing history 9 events
-
2026-05-21status Pending
-
2026-05-20$60,000 Active
-
2007-07-01$95,900
-
2005-10-25$119,900
-
2005-05-12soldstatus $48,000
-
2005-04-29soldstatus $48,000
-
2005-03-01$52,000
-
2002-05-14soldstatus $42,000
-
1995-05-25soldstatus $37,000
ⓘ Source: listings_history table (triggers on properties + properties_extension) + one-shot
backfill from property_details.listing_events for pre-trigger history.
Tax reassessment forecast FL · Resets to sale price
- Current annual tax
- $1,393 · $116/mo
- Projected year-2 tax
- $1,393 · $116/mo
- Expected delta
- $0/yr ($0/mo · 0.0%)
ⓘ Screening estimate from a state-policy table — verify with the county assessor before closing.
Climate risk First Street
- Flood 1/10 Low FEMA zone X (unshaded) · 0% chance over 30 yrs
- Wildfire 4/10 Moderate
- Heat 10/10 Extreme 7 d/yr ≥108°F today · 25 d/yr by 30 yrs out
- Wind 10/10 Extreme 99% chance of damaging wind over 30 yrs
- Air quality 2/10 Low 1 unhealthy d/yr today · 3 by 30 yrs out
Nearby sold comps map
Loading sold comps map…
Walkable amenities ~0.75 mi
Loading nearby amenities…
Taxation est. · year 1
- Rental income
- $21,671
- − Mortgage interest
- −$3,361
- − Property taxes
- −$1,393
- − Insurance
- −$300
- − Repairs & maintenance
- −$1,734
- − Management
- −$1,734
- − Depreciation
- −$1,745
- Taxable income
- $11,404
- Est. tax owed @ 24.0%
- −$2,737
- After-tax cash flow
- $8,914/yr
For passive investors: Depreciation is non-cash, so a rental often shows a tax loss while cash-flowing — sheltering income. Rental losses are passive: they offset passive income freely, and up to $25,000/yr can offset ordinary (W-2) income if you actively participate and your MAGI is under $100k (phasing out to $0 by $150k); unused losses carry forward. On sale, claimed depreciation is recaptured at up to 25%, and gains may owe capital-gains tax (a 1031 exchange can defer both). Figures are a year-1 estimate at your 24.0% rate — not tax advice; consult a CPA.
Schools (NCES district)
- District
- Pasco
- NCES district ID
- 1201530
- Math proficiency
- 50% ▼ -10.00%
- Reading proficiency
- 52% ▼ -5.00%
- Median HH income
- $45,039
- Composite
- 43.14/100
- National rank
- #3074
- State rank
- #32 of 73 in FL
Livability — Bayonet Point
- Score
- 69/100
- State rank
- #485
- US rank
- #8934
Category grades
Schools grade is shown separately in the Schools card above.
Census & demographics
- County
- Pasco County · 524,098 people
- Metro
- Tampa-St. Petersburg-Clearwater, FL
- Population (ZIP)
- 24,355
- Household income
- $73,947
- Rent vs Own
- Severe rent burden
- 179.0
Population outlook (Pasco County) Hauer SSP2
- Today (2025)
- 570,045 people
- By 2030
- 605,844 · +6.3%
- By 2040
- 674,806 · +18.4%
- By 2050
- 736,022 · +29.1%
- By 2075
- 862,900 · +51.4%
- By 2100
- 906,364 · +59.0%
Race, ethnicity, and origin ACS 2023
- Neighborhood character
- Predominantly White (81%)
- Race & ethnicity
- White 81% Hispanic / Latino 10% Two or more races 7% Black 3% Asian 2%
- Hispanic origin (detail)
- Puerto Rican 6%
- Common ancestry
- Romanian 4% Slovak 2% Italian 2%
- Foreign-born
- 7% · Canada, China, Jamaica
- Languages at home
- 88% English-only · Spanish 5% Russian/Polish/Slavic 2% Other Indo-European 1%
Political lean MEDSL · Pasco
- 2024 margin
- Strong R (+25.2) · D 36.9% · R 62.1% · Other 1.0%
- 2008→2024 swing
- -21.6pp toward R · 2008: -3.6pp · 2024: -25.2pp
- All cycles
- 2024: R+25.2 2020: R+20.1 2016: R+21.6 2012: R+6.7 2008: R+3.6
Not yet ingested
- Civics
- —
Market trends
- HPI YoY
- ▼ -42.63%
- Current HPI
- 294.4358
- Rent YoY
- ▼ -1.85%
- Metro
- Tampa-St. Petersburg-Clearwater, FL
- State GDP YoY
- ▲ 3.28%
- F500 in state
- 36
Industry mix (Fortune 500 HQ in FL)
| Industry | F500 HQs | Revenue |
|---|---|---|
| Industrial Technology | 2 | $29B |
|
||
| Insurance | 2 | $17B |
|
||
| Retail | 1 | $60B |
|
||
| Technology Distribution | 1 | $58B |
|
||
| Homebuilding | 1 | $35B |
|
||
| Technology Manufacturing | 1 | $35B |
|
||
Price history
+62.2% since first listed9 events — show timeline
- 2026-05-21 Pending — Stellar MLS as Distributed by MLS Grid
- 2026-05-20 Listed $60,000 Stellar MLS as Distributed by MLS Grid
- 2007-07-01 Listed $95,900 Stellar MLS as Distributed by MLS Grid
- 2005-10-25 Listed $119,900 Stellar MLS as Distributed by MLS Grid
- 2005-05-12 Sold (Public Records) $48,000 Public Records
- 2005-04-29 Sold (MLS) $48,000 Stellar MLS as Distributed by MLS Grid
- 2005-03-01 Listed $52,000 Stellar MLS as Distributed by MLS Grid
- 2002-05-14 Sold (Public Records) $42,000 Public Records
- 1995-05-25 Sold (Public Records) $37,000 Public Records
Property tax history
+5.1%/yrLatest (2025): $1,393 · +9.3% YoY. Source: county tax records.
Cash-flow waterfall
monthlySold comps — $/sqft
last 12 mo · ≤1 miLoading sold comps…