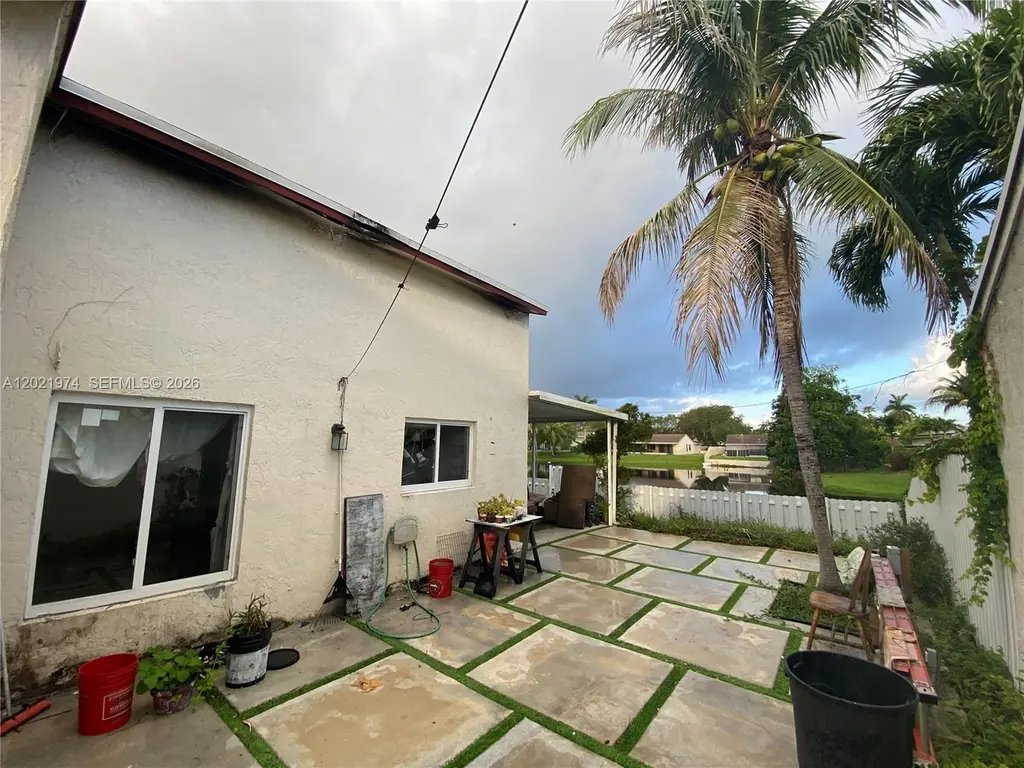
901 Cumberland Ter · Davie, FL
Flood risk 1/10 · Minimal
- FEMA flood zone
- X (shaded)
- Chance of flooding over 30 yrs
- 0.0%
- Est. flood insurance / yr
- $507 – $1,088
Fire risk 1/10 · Minimal
- Est. fire insurance / yr
- $947 – $1,759
Heat risk 10/10 · Severe
- Hot days now (above 106°F)
- 7 days/yr
- Hot days in 30 yrs
- 28 days/yr
Wind risk 10/10 · Severe
- Chance of severe wind over 30 yrs
- 99.0%
Air-quality risk 3/10 · Minor
- Unhealthy air days now
- 2 days/yr
- Unhealthy air days in 30 yrs
- 3 days/yr
Risk factors via First Street. Map © Google.
Why this score? — see what drove the C+ grade
The composite is a weighted blend of 9 inputs, each scored 0–100. Each bar is that input's sub-score; the figure is the points it added to the 100-point composite (weight × sub-score).
- Cash flow +20.7/30.0
- ARV discount +15.0/15.0
- DSCR +6.6/10.0
- 1% rule +5.5/10.0
- Schools +4.1/10.0
- Livability +4.1/5.0
- Condition / age +2.5/5.0
- Rent growth +2.3/5.0
- Appreciation +0.0/10.0
$299,000
🖨 Deal sheet 📄 Offer letter ✓ Due diligence
Listing remarks
Property is being sold As-Is, property had major fire damage, second floor is gone. Bring in all your investors great opportunity to make this home great again!
Key facts
- 3,217 sq ft lot
- Garage
- Built 1987
Property features AI
Finance
- Financial info: Pets allowed with possible restrictions
Exterior
- Parking: Attached or detached garage with 1 covered space; Driveway
- Utilities: Public water; Public sewer; Cable available
- Home design: Two-story home; Faces northwest; Resale property
- Construction: Block construction
- Exterior features: Lakefront property; Frontage on a city street; Frontage length approximately 12 feet; Lot is less than a quarter acre
Interior
- Bathrooms: Three full bathrooms; One half bathroom
- Heating & cooling: Central heating; Central air conditioning
- Interior features: First-floor entry; Family room; Other interior features
Neighborhood map
What this means for you Summary
Snapshot
- This is a 3-bed/3.0-bath single-family listed at $299k.
Deal economics
- At list price, monthly cash flow is $407 ($5k/yr) — positive.
- The deal already cash-flows at list — no discount required.
- Meets the 1% rule at list price ($3k rent vs $299k).
- Recommended offer: $295k (1.5% below list) — sets the bar for market timing.
- Cap rate 7.9% vs local median 3.4% in Davie — top-decile yield for the area; either an underpriced asset or a hidden risk that comps aren't pricing in. Stress-test before assuming the spread holds.
Location & tenants
- Location reads 82/100 on livability (#68 in FL, #1,159 nationally) — a professional / high-income tenant draw. Strengths: schools A+, crime A+, housing A+; Watch: cost of living D, amenities D-.
- Broward (suburban): math 42% / reading 53% proficiency, ranked #46 of 73 in FL (top 63%) — families likely to look elsewhere, expect single-tenant / working-renter base with shorter leases.
- Market conditions: Rents soft (-0.9%/yr); 176 active listings in the ZIP; 40 comparable units currently listed for rent nearby; rentals at typical pace (median 19d on market — plan ~3-4 weeks tenant-placement turnaround); solid renter incomes; 2,111 units permitted in Broward County in 2024 (1,265 in 5+ unit buildings).
- This rent runs 37% of the median local income ($101k/yr) — at the standard rent-burdened threshold; future hikes will face affordability resistance.
Forward outlook
- Local home prices are declining (-3.0%/yr); year-one equity from $2k of loan paydown is wiped out by about $9k of value loss. Plan a longer hold.
- Broward County population projected at +34% by 2050 — long-run rental-demand tailwind backs the buy-and-hold thesis.
Negotiation context
- It's been on market 15 days — a 2% lower offer ($295k) is reasonable based on typical stale-listing flexibility.
- 5 sale attempts since 5y ago; this cycle's ask has dropped $101k (25%) from the opening price — seller is motivated, your offer sets the floor, not the list.
Risks & watch-outs
- Climate carrying-cost: severe wind risk, 99% chance of damaging wind over 30y; extreme-heat days projected 7→28/yr by 2055 (HVAC capex compounding) — expect insurance premiums to compound above CPI over the hold.
Questions for the listing agent
- Is there a deadline driving the sale (1031 exchange, divorce, estate, relocation)? That informs how much negotiation room exists.
- Schools are A-rated — typically a magnet for longer-tenancy family renters. What's the average tenant stay here, and is there a school-zone premium baked into asking?
- What's the average days-on-market for RENTAL listings here right now (not sales)? A rising rental-DOM trend means longer vacancies and softer asking-rent achievability than the comps imply.
- What's the recent tenant-quality profile in this submarket — average credit score on applications, eviction rate, late-payment / NSF rate, and stable-employment percentage? A property-management company in the area should have these aggregated.
- How much new for-sale + rental construction is in the pipeline within 1–3 miles? Heavy new supply typically softens prices + rents 12–24 months out; constrained supply supports both.
Investment metrics
- 1% rule
- 1.05% ✓
- Cap rate
- 7.92%
- Cash-on-cash
- 5.83%
- DSCR
- 1.26
- GRM
- 8.0
CMA / ARV
- ARV (on-the-fly)
- $563,640
- Comps found
- 5
Show comp detail 5 sales within ~0.75 mi
| Address | Dist | Beds/Ba | Sqft | Sold | Price | $/sf | Match |
|---|---|---|---|---|---|---|---|
| 13431 SW 9th Pl | 0.21mi | 3/2.0 | 1,224 (-4%) | 2mo | $551,000 | $450 | 77 |
| 1001 SW 133rd Ter | 0.30mi | 3/2.0 | 1,154 (-10%) | 3mo | $465,000 | $403 | 63 |
| 13570 SW 10th Pl | 0.19mi | 3/2.0 | 1,407 (+10%) | 12mo | $640,000 | $455 | 61 |
| 14100 Langley Pl | 0.57mi | 3/2.5 | 1,217 (-5%) | 11mo | $535,000 | $440 | 54 |
| 13991 Dominion Pl | 0.31mi | 3/2.0 | 1,413 (+10%) | 17mo | $585,000 | $414 | 50 |
Match score weights: distance 35% · size 25% · config 20% · recency 20%. Top-matched comps best support the ARV.
Projected returns pro-forma
-3.0% appreciation · 0.0% rent growth · sell at horizon
- IRR
- -10.7%
- Equity multiple
- 0.62×
- Total profit
- $-31,679
- Equity at exit
- $44,582
- IRR
- -6.3%
- Equity multiple
- 0.65×
- Total profit
- $-29,499
- Equity at exit
- $25,852
Cash invested: $83,720 (down + closing). Projections, not guarantees.
Landlord ↔ Tenant lean methodology
- Overall (STATE)
- 87 Strongly Landlord-Friendly
- State Florida
- 87 Strongly Landlord-Friendly · R+3
- County
- — inherits STATE
- City
- — inherits STATE
ZIP-level market 33325
- Rents YoY
- -0.9%
- Active inventory
- 176
- Price-to-rent
- 8.0×
Monthly cashflow live
- Estimated rent
- $3,130 high interval (Pro) →
- Mortgage (P&I)
- −$1,568
- Tax est. 1.5%
- −$374 /mo · $4,485/yr
- Insurance
- −$125
- HOA
- −$0
- Vacancy / Maint / Mgmt
- −$657
- Net cashflow
- $407
Break-even live
Sensitivity live
| Price | -10% $613 | -5% $510 | +0% $407 | +5% $303 | +10% $200 |
|---|---|---|---|---|---|
| Rent | -10% $159 | -5% $283 | +0% $407 | +5% $530 | +10% $654 |
| Rate | -1.0pp $557 | -0.5pp $483 | base $407 | +0.5pp $329 | +1.0pp $250 |
UW: 25.0% down · 7.5% · 30yr · 1.5% tax · 5.0% vac · 8.0% maint · 8.0% mgmt
Financing live
Cash to close
- Down payment
- $74,750
- Closing costs
- $8,970
- Reserves months
- —
- Total cash needed
- —
Loan-product check · same deal, 3 products live
Conventional
25% down · 7.5% · 30yr
- Down + closing
- —
- Monthly P&I
- —
- Monthly cashflow
- —
- DSCR
- —
- Eligible?
- —
Personal DTI + credit; lowest rate.
DSCR
20% down · 8.5% · 30yr
- Down + closing
- —
- Monthly P&I
- —
- Monthly cashflow
- —
- DSCR
- —
- Eligible?
- —
No personal income docs; deal must DSCR.
Hard money
10% down · 12.0% · 12mo
- Down + closing
- —
- Monthly P&I
- —
- Monthly cashflow
- —
- DSCR
- —
- Eligible?
- —
Short-term bridge; refi at stabilization.
Rent comps 40 comps
| Address | Beds | Baths | Sqft | Rent | $/sqft | DOM | Units | Dist |
|---|---|---|---|---|---|---|---|---|
| 651 Shiloh Ter Unit 651 Davie, FL | 3.0 | 2.0 | 1249 | $4,700 | $3.76 | 24d | 1 | 0.24mi |
| 13761 Newport Mnr Davie, FL | 3.0 | 2.0 | 1249 | $3,500 | $2.80 | 24d | 1 | 0.30mi |
| 14025 Langley Pl Davie, FL | 3.0 | 2.0 | 1360 | $3,250 | $2.39 | 13d | 1 | 0.54mi |
| 14025 Langley Pl Davie, FL | 3.0 | 2.0 | 1360 | $3,250 | $2.39 | 14d | 1 | 0.54mi |
| 118 Riverwalk Cir Sunrise, FL | 3.0 | 2.5 | 1447 | $3,100 | $2.14 | 24d | 1 | 0.82mi |
| 1631 SW 129th Way Davie, FL | 3.0 | 2.0 | 1189 | $3,700 | $3.11 | 5d | 1 | 0.90mi |
| 200 Commodore Dr Plantation, FL | 3.0 | 2.0 | 1124 | $2,913 | $2.59 | 20d | 1 | 0.93mi |
| 200 Commodore Dr Plantation, FL | 3.0 | 2.0 | 1124 | $3,014 | $2.68 | 24d | 1 | 0.93mi |
| 200 Commodore Dr Plantation, FL | 2.0 | 2.0 | 1078 | $2,743 | $2.54 | 22d | 1 | 0.93mi |
| 13500 NW 3rd St Plantation, FL | 1.0–3.0 | 1.0–2.5 | 1099 | $3,725 | $3.39 | 3d | 21 | 0.93mi |
| 705 SW 148th Ave #213 Davie, FL | 3.0 | 3.0 | 1409 | $2,300 | $1.63 | 17d | 1 | 0.99mi |
| 701 SW 148th Ave Davie, FL | 3.0 | 3.0 | 1285 | $2,500 | $1.95 | 24d | 1 | 0.99mi |
| 141 SW 127th Ter Unit 141 Plantation, FL | 3.0 | 2.5 | 1720 | $3,600 | $2.09 | 24d | 1 | 0.99mi |
| 721 SW 148th Ave Davie, FL | 2.0 | 2.0–3.0 | 1138 | $2,700 | $2.37 | 24d | 2 | 1.01mi |
| 781 SW 148th Ave Davie, FL | 3.0 | 3.0 | 1285 | $2,675 | $2.08 | 24d | 2 | 1.01mi |
| 781 SW 148th Ave Davie, FL | 1.0–3.0 | 1.0–3.0 | 1176 | $2,750 | $2.34 | 15d | 3 | 1.01mi |
| 735 SW 148th Ave Davie, FL | 3.0 | 3.0 | 1285 | $2,575 | $2.00 | 24d | 2 | 1.01mi |
| 785 SW 148th Ave #1406 Davie, FL | 3.0 | 3.0 | 1285 | $2,550 | $1.98 | 24d | 1 | 1.01mi |
| 741 SW 148th Ave Davie, FL | 2.0 | 2.0 | 1064 | $2,348 | $2.21 | 5d | 2 | 1.02mi |
| 741 SW 148th Ave Davie, FL | 2.0 | 2.0 | 1064 | $2,348 | $2.21 | 11d | 2 | 1.02mi |
| 741 SW 148th Ave #705 Davie, FL | 2.0 | 2.0 | 1064 | $2,395 | $2.25 | 5d | 1 | 1.02mi |
| 761 SW 148th Ave #915 Davie, FL | 2.0 | 2.0 | 1034 | $2,380 | $2.30 | 18d | 1 | 1.02mi |
| 761 SW 148th Ave #915 Davie, FL | 2.0 | 2.0 | 1034 | $2,490 | $2.41 | 19d | 1 | 1.02mi |
| 711 SW 148th Ave Davie, FL | 3.0 | 3.0 | 1347 | $2,720 | $2.02 | 8d | 2 | 1.03mi |
| 711 SW 148th Ave Davie, FL | 3.0 | 3.0 | 1347 | $2,750 | $2.04 | 14d | 3 | 1.03mi |
| 14721 Vista Verdi Rd Davie, FL | 3.0 | 2.0 | 1565 | $4,000 | $2.56 | 5d | 1 | 1.04mi |
| 715 SW 148th Ave #611 Davie, FL | 2.0 | 1.0 | 1068 | $2,250 | $2.11 | 13d | 1 | 1.04mi |
| 715 SW 148th Ave #611 Davie, FL | 2.0 | 1.0 | 1068 | $2,250 | $2.11 | 8d | 1 | 1.04mi |
| 400 Commodore Dr #308 Plantation, FL | 2.0 | 2.5 | 1296 | $2,400 | $1.85 | 5d | 1 | 1.04mi |
| 771 SW 148th Ave #1305 Davie, FL | 2.0 | 1.0 | 1068 | $2,250 | $2.11 | 2d | 1 | 1.04mi |
| 745 SW 148th Ave #815 Davie, FL | 2.0 | 2.0 | 1034 | $2,425 | $2.35 | 24d | 1 | 1.06mi |
| 751 SW 148th Ave Davie, FL | 2.0–3.0 | 2.0–3.0 | 1123 | $2,775 | $2.47 | 24d | 3 | 1.08mi |
| 430 Commodore Dr #210 Plantation, FL | 2.0 | 2.0 | 1130 | $2,100 | $1.86 | 24d | 1 | 1.10mi |
| 430 Commodore Dr Unit 430 Plantation, FL | 2.0 | 2.5 | 1296 | $2,400 | $1.85 | 5d | 1 | 1.10mi |
| 821 E Village Cir #821 Davie, FL | 3.0 | 2.5 | 1835 | $3,750 | $2.04 | 21d | 1 | 1.17mi |
| 821 E Village Cir #821 Davie, FL | 3.0 | 2.5 | 1835 | $3,650 | $1.99 | 4d | 1 | 1.17mi |
| 617 NW 132nd Ter Unit 617 Plantation, FL | 3.0 | 2.5 | 1577 | $2,750 | $1.74 | 24d | 1 | 1.29mi |
| 12447 Emerald Creek Mnr Davie, FL | 3.0 | 2.5 | 1872 | $3,100 | $1.66 | 24d | 1 | 1.34mi |
| 1329 SW 151st Way Sunrise, FL | 3.0 | 2.0 | 1800 | $3,900 | $2.17 | 8d | 1 | 1.37mi |
| 12471 NW 3rd St Unit D1 Plantation, FL | 3.0 | 2.0 | 1681 | $3,500 | $2.08 | 24d | 1 | 1.39mi |
Listing history 15 events
-
2026-06-04status $299,000 Pending 15 DOM
-
2026-06-03days on market $299,000 Active 15 DOM
-
2026-06-02days on market $299,000 Active 14 DOM
-
2026-06-01days on market $299,000 Active 13 DOM
-
2026-05-31days on market $299,000 Active 12 DOM
-
2026-05-21price $299,000
-
2026-05-08$400,000 Active
-
2021-08-30historical
-
2021-08-30status Active
-
2021-06-30status Active
-
2021-04-30status Active
-
2021-02-24price $392,000
-
2021-02-16price $395,000
-
2021-01-28$400,000 Active
-
2018-12-28soldstatus $315,000
ⓘ Source: listings_history table (triggers on properties + properties_extension) + one-shot
backfill from property_details.listing_events for pre-trigger history.
Climate risk First Street
- Flood 1/10 Low FEMA zone X (shaded) · 0% chance over 30 yrs
- Wildfire 1/10 Low
- Heat 10/10 Extreme 7 d/yr ≥106°F today · 28 d/yr by 30 yrs out
- Wind 10/10 Extreme 99% chance of damaging wind over 30 yrs
- Air quality 3/10 Moderate 2 unhealthy d/yr today · 3 by 30 yrs out
Nearby sold comps map
Loading sold comps map…
Walkable amenities ~0.75 mi
Loading nearby amenities…
Taxation est. · year 1
- Rental income
- $37,564
- − Mortgage interest
- −$16,749
- − Property taxes
- −$4,485
- − Insurance
- −$1,495
- − Repairs & maintenance
- −$3,005
- − Management
- −$3,005
- − Depreciation
- −$8,698
- Taxable income
- $127
- Est. tax owed @ 24.0%
- −$30
- After-tax cash flow
- $4,849/yr
For passive investors: Depreciation is non-cash, so a rental often shows a tax loss while cash-flowing — sheltering income. Rental losses are passive: they offset passive income freely, and up to $25,000/yr can offset ordinary (W-2) income if you actively participate and your MAGI is under $100k (phasing out to $0 by $150k); unused losses carry forward. On sale, claimed depreciation is recaptured at up to 25%, and gains may owe capital-gains tax (a 1031 exchange can defer both). Figures are a year-1 estimate at your 24.0% rate — not tax advice; consult a CPA.
Schools (NCES district)
- District
- Broward
- NCES district ID
- 1200180
- Math proficiency
- 42% ▼ -18.00%
- Reading proficiency
- 53% ▼ -5.00%
- Median HH income
- $52,139
- Composite
- 40.88/100
- National rank
- #3621
- State rank
- #46 of 73 in FL
Livability — Davie
- Score
- 82/100
- State rank
- #68
- US rank
- #1159
Category grades
Schools grade is shown separately in the Schools card above.
Census & demographics
- Census place
- Davie, FL
- County
- Broward County · 1,963,430 people
- City population
- 92,317
- Metro
- Miami-Fort Lauderdale-Pompano Beach, FL
- Population (ZIP)
- 32,399
- Household income
- $100,553
- Rent vs Own
- Severe rent burden
- 924.0
Population outlook (Broward County) Hauer SSP2
- Today (2025)
- 2,207,033 people
- By 2030
- 2,360,704 · +7.0%
- By 2040
- 2,661,208 · +20.6%
- By 2050
- 2,946,698 · +33.5%
- By 2075
- 3,602,273 · +63.2%
- By 2100
- 3,970,984 · +79.9%
Race, ethnicity, and origin ACS 2023
- Neighborhood character
- Diverse neighborhood (Simpson 0.62)
- Race & ethnicity
- Hispanic / Latino 51% White 33% Two or more races 31% Black 6% Asian 3%
- Hispanic origin (detail)
- Mexican 3% Puerto Rican 8% Cuban 9% Dominican 1% Salvadoran 1%
- Common ancestry
- Italian 3% Romanian 1% Scotch-Irish 1%
- Foreign-born
- 35% · Canada, Jamaica, Dominican Republic
- Languages at home
- 49% English-only · Spanish 46% Other Indo-European 2% French/Haitian/Cajun 2%
Political lean MEDSL · Broward
- 2024 margin
- D (+17.0) · D 58.0% · R 41.0%
- 2008→2024 swing
- -17.8pp toward R · 2008: 34.7pp · 2024: 17.0pp
- All cycles
- 2024: D+17.0 2020: D+29.8 2016: D+35.0 2012: D+34.9 2008: D+34.7
Not yet ingested
- Civics
- —
Market trends
- HPI YoY
- ▼ -437.64%
- Current HPI
- 385.1467
- Rent YoY
- ▼ -0.88%
- Metro
- Miami-Fort Lauderdale-Pompano Beach, FL
- State GDP YoY
- ▲ 3.28%
- F500 in state
- 36
Industry mix (Fortune 500 HQ in FL)
| Industry | F500 HQs | Revenue |
|---|---|---|
| Industrial Technology | 2 | $29B |
|
||
| Insurance | 2 | $17B |
|
||
| Retail | 1 | $60B |
|
||
| Technology Distribution | 1 | $58B |
|
||
| Homebuilding | 1 | $35B |
|
||
| Technology Manufacturing | 1 | $35B |
|
||
Price history
-5.1% since first listed10 events — show timeline
- 2026-05-21 Price Changed $299,000 MARMLS
- 2026-05-08 Listed $400,000 MARMLS
- 2021-08-30 Listing Removed — MARMLS
- 2021-08-30 Relisted — MARMLS
- 2021-06-30 Relisted — MARMLS
- 2021-04-30 Relisted — MARMLS
- 2021-02-24 Price Changed $392,000 MARMLS
- 2021-02-16 Price Changed $395,000 MARMLS
- 2021-01-28 Listed $400,000 MARMLS
- 2018-12-28 Sold (Public Records) $315,000 Public Records
Property tax history
+15.2%/yrLatest (2025): $20,363 · +57.5% YoY. Source: county tax records.
Cash-flow waterfall
monthlySold comps — $/sqft
last 12 mo · ≤1 miLoading sold comps…