2831 Belmont Dr · Ocean Springs, MS
Flood risk 9/10 · Severe
- FEMA flood zone
- AE
- Chance of flooding over 30 yrs
- 0.99%
- Est. flood insurance / yr
- $1,737 – $8,500
Fire risk 3/10 · Minor
- Est. fire insurance / yr
- $1,241 – $2,305
Heat risk 10/10 · Severe
- Hot days now (above 107°F)
- 7 days/yr
- Hot days in 30 yrs
- 22 days/yr
Wind risk 9/10 · Severe
- Chance of severe wind over 30 yrs
- 99.0%
Air-quality risk 2/10 · Minimal
- Unhealthy air days now
- 1 days/yr
- Unhealthy air days in 30 yrs
- 2 days/yr
Risk factors via First Street. Map © Google.
Why this score? — see what drove the C- grade
The composite is a weighted blend of 9 inputs, each scored 0–100. Each bar is that input's sub-score; the figure is the points it added to the 100-point composite (weight × sub-score).
- Cash flow +21.6/30.0
- DSCR +6.9/10.0
- ARV discount +6.2/15.0
- Schools +5.3/10.0
- 1% rule +4.7/10.0
- Livability +4.3/5.0
- Rent growth +2.8/5.0
- Condition / age +2.5/5.0
- Appreciation +0.0/10.0
$199,500
🖨 Deal sheet 📄 Offer letter ✓ Due diligence
Listing remarks MLS
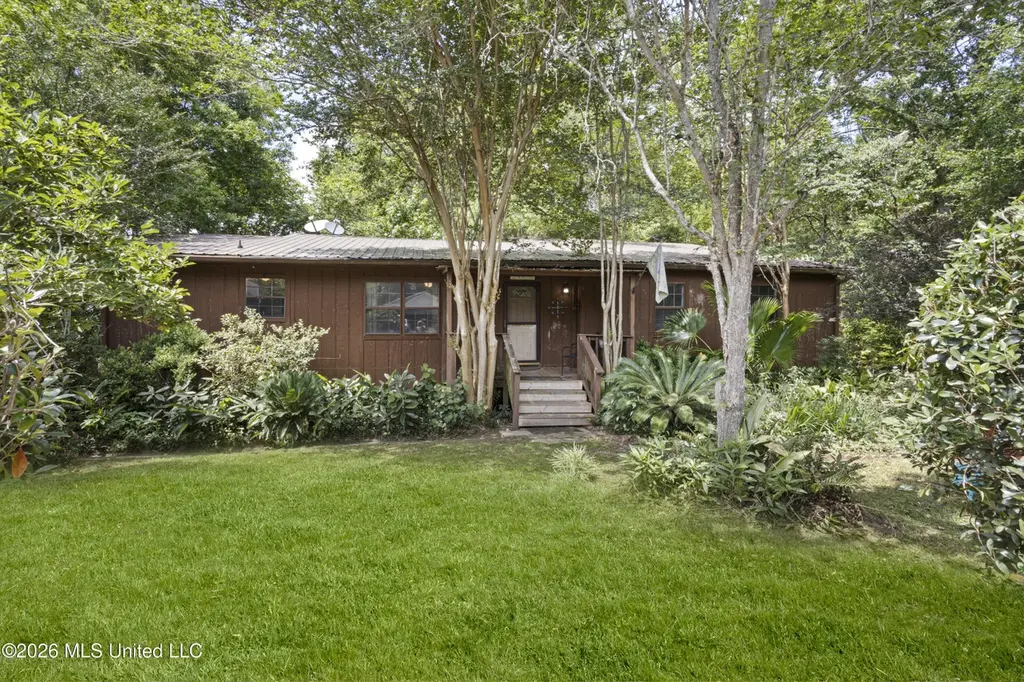
Nature at your grasp! Enjoy your morning coffee listening to the birds cirp from one of 2 outside decks/porches, or stay inside and observe nature from your sunporch. This unique one-or-a-kind home is located on a quiet cul-de-sac near Pecan Park Elementary School. Open contemporary floorplan, rustic interior, must see to appreciate.
Key facts
- Wood flooring
- Brick fireplace
- Lush landscaping
Tags
Property features AI
Finance
- HOA & community: Biking trails; Hiking/walking trails; Park
Exterior
- Parking: Carport (2 spaces); Driveway; Concrete parking surfaces; Total 2 parking spaces
- Utilities: Public water; Public sewer; Electricity connected; Water connected; Sewer connected
- Home design: Single-family house; One story; Fixer condition; Wood siding; Pillar/post/pier foundation; Metal roof
- Construction: Wood siding construction
- Exterior features: Private yard; Porch; Shed(s); Chain link and wood fencing; Landscaped lot with many trees; Sloped lot; Located on a cul-de-sac
Interior
- Kitchen: Dishwasher; Electric range; Free-standing electric oven; Ice maker; Refrigerator; Stainless steel appliances; Water heater
- Flooring: Vinyl flooring; Wood flooring
- Bathrooms: 1 full bathroom
- Heating & cooling: Central electric heating; Central air; Ceiling fans
- Interior features: Ceiling fans; High ceilings; Decorative fireplace in the living room
- Laundry & utility: Laundry room with electric dryer hookup
Neighborhood map
What this means for you Summary
Snapshot
- This is a 3-bed/2.0-bath single-family listed at $200k.
Deal economics
- At list price, monthly cash flow is $-123 ($-1k/yr) — negative.
- To cash-flow at today's rent, offer at most $178k (10.9% below list).
- To meet the 1% rule (rent ≥ 1% of price), the offer needs to be $193k (3.2% below list).
- Recommended offer: $178k (10.9% below list) — sets the bar for cash-flow.
- Cap rate 8.1% vs local median 4.2% in Ocean Springs — top-decile yield for the area; either an underpriced asset or a hidden risk that comps aren't pricing in. Stress-test before assuming the spread holds.
Location & tenants
- Location reads 86/100 on livability (#2 in MS, #420 nationally) — a professional / high-income tenant draw. Strengths: crime A+, amenities A+, cost of living A+; Watch: commute F.
- Ocean Springs School District (suburban): math 64% / reading 59% proficiency, ranked #1 of 130 in MS (top 1%) — acceptable for families but not a draw, mixed tenant base, ~2y average lease.
- Zoned schools: Pecan Park Elementary School (math 62% / reading 57%, grade B-, #27 of 375 statewide, top 8%, 530 students, 99% FRL); Ocean Springs Middle School (math 66% / reading 61%, grade B+, #3 of 179 statewide, top 2%, 967 students, 100% FRL); Ocean Springs High School (math 77% / reading 64%, grade B+, #1 of 197 statewide, top 0%, 1,899 students, 100% FRL) — zoned schools average 100% FRL vs 33% district-wide (67 pts higher); higher-poverty schools than district average — tighter screening recommended.
- Market conditions: Rents rising (+1.3%/yr); 714 active listings in the ZIP; 14 comparable units currently listed for rent nearby; rentals lingering (median 44d on market — plan ~5-8 weeks vacancy on turnover, expect pricing pressure); 50% of comp listings sitting > 30 days — soft ceiling on asking rent; solid renter incomes; 516 units permitted in Jackson County in 2024 (6 in 5+ unit buildings).
Forward outlook
- Local home prices are declining (-3.0%/yr); year-one equity from $1k of loan paydown is wiped out by about $6k of value loss. Plan a longer hold.
Negotiation context
- It's been on market 29 days — a 2% lower offer ($197k) is reasonable based on typical stale-listing flexibility.
- 2 sale attempts since 6y ago with the ask held roughly flat each time — persistent listings suggest the price (not the market) is what's stuck; bring a comps-based counter.
Risks & watch-outs
- Watch-outs: flood insurance adds $427/mo.
- Climate carrying-cost: in FEMA flood zone AE (mandatory federal flood insurance); severe wind risk, 99% chance of damaging wind over 30y; extreme-heat days projected 7→22/yr by 2055 (HVAC capex compounding) — expect insurance premiums to compound above CPI over the hold.
Questions for the listing agent
- What do current leases actually rent for vs. the listed asking? Can we see a recent rent roll and the last 12 months of T-12 income?
- What's the actual annual flood-insurance premium (NFIP or private), and is the property in a SFHA with mandatory coverage?
- Is there a deadline driving the sale (1031 exchange, divorce, estate, relocation)? That informs how much negotiation room exists.
- Schools are B-rated — typically a magnet for longer-tenancy family renters. What's the average tenant stay here, and is there a school-zone premium baked into asking?
- What's the average days-on-market for RENTAL listings here right now (not sales)? A rising rental-DOM trend means longer vacancies and softer asking-rent achievability than the comps imply.
- What's the recent tenant-quality profile in this submarket — average credit score on applications, eviction rate, late-payment / NSF rate, and stable-employment percentage? A property-management company in the area should have these aggregated.
- How much new for-sale + rental construction is in the pipeline within 1–3 miles? Heavy new supply typically softens prices + rents 12–24 months out; constrained supply supports both.
Investment metrics
- 1% rule
- 0.97% ✗
- Cap rate
- 8.12%
- Cash-on-cash
- 6.52%
- DSCR
- 1.29
- GRM
- 8.6
CMA / ARV
- ARV (on-the-fly)
- $193,710
- Comps found
- 11
Show comp detail 11 sales within ~0.75 mi
| Address | Dist | Beds/Ba | Sqft | Sold | Price | $/sf | Match |
|---|---|---|---|---|---|---|---|
| 109 Leigh Cir | 0.06mi | 3/2.0 | 1,220 (+4%) | 22mo | $159,900 | $131 | 73 |
| 118 Barbara Cir | 0.24mi | 3/2.0 | 1,308 (+11%) | 2mo | $215,000 | $164 | 68 |
| 309 Jamaica Dr | 0.16mi | 3/2.0 | 1,330 (+13%) | 10mo | $249,999 | $188 | 62 |
| 121 Beverly Dr | 0.44mi | 3/1.5 | 1,064 (-9%) | 7mo | $175,500 | $165 | 56 |
| 232 Woodland Cir | 0.73mi | 3/1.5 | 1,120 (-5%) | 0mo | $170,000 | $152 | 56 |
| 2507 Ridgewood Rd | 0.55mi | 3/1.5 | 1,304 (+11%) | 6mo | $249,900 | $192 | 49 |
| 2501 Havard Rd | 0.69mi | 3/1.0 | 1,211 (+3%) | 14mo | $189,000 | $156 | 47 |
| 201 Hunter Dr | 0.40mi | 3/2.0 | 1,000 (-15%) | 14mo | $189,000 | $189 | 45 |
| 112 Myrtle Rd | 0.61mi | 3/2.0 | 1,040 (-11%) | 10mo | $189,000 | $182 | 44 |
| 210 Linda Dr | 0.73mi | 3/1.0 | 1,270 (+8%) | 18mo | $259,200 | $204 | 34 |
| 221 Woodland Cir | 0.68mi | 4/1.0 (+1) | 1,300 (+11%) | 19mo | $205,000 | $158 | 25 |
Match score weights: distance 35% · size 25% · config 20% · recency 20%. Top-matched comps best support the ARV.
Projected returns pro-forma
-3.0% appreciation · 1.31% rent growth · sell at horizon
- IRR
- -22.9%
- Equity multiple
- 0.23×
- Total profit
- $-43,196
- Equity at exit
- $29,746
- IRR
- -23.3%
- Equity multiple
- -0.07×
- Total profit
- $-59,717
- Equity at exit
- $17,249
Cash invested: $55,860 (down + closing). Projections, not guarantees.
Landlord ↔ Tenant lean methodology
- Overall (STATE)
- 90 Strongly Landlord-Friendly
- State Mississippi
- 90 Strongly Landlord-Friendly · R+11
- County
- — inherits STATE
- City
- — inherits STATE
ZIP-level market 39564
- Home prices YoY
- -26.8%
- Rents YoY
- 1.3%
- Active inventory
- 714
- Price-to-rent
- 8.6×
Monthly cashflow live
- Estimated rent
- $1,930 high interval (Pro) →
- Mortgage (P&I)
- −$1,046
- Tax from tax record
- −$92 /mo · $1,106/yr
- Insurance
- −$83
- Flood insurance flood zone
- −$427 /mo · $5,118/yr
- HOA
- −$0
- Vacancy / Maint / Mgmt
- −$405
- Net cashflow
- $-123
Break-even live
UW: 25.0% down · 7.5% · 30yr · 1.5% tax · 5.0% vac · 8.0% maint · 8.0% mgmt
Financing live
Cash to close
- Down payment
- $49,875
- Closing costs
- $5,985
- Reserves months
- —
- Total cash needed
- —
Loan-product check · same deal, 3 products live
Conventional
25% down · 7.5% · 30yr
- Down + closing
- —
- Monthly P&I
- —
- Monthly cashflow
- —
- DSCR
- —
- Eligible?
- —
Personal DTI + credit; lowest rate.
DSCR
20% down · 8.5% · 30yr
- Down + closing
- —
- Monthly P&I
- —
- Monthly cashflow
- —
- DSCR
- —
- Eligible?
- —
No personal income docs; deal must DSCR.
Hard money
10% down · 12.0% · 12mo
- Down + closing
- —
- Monthly P&I
- —
- Monthly cashflow
- —
- DSCR
- —
- Eligible?
- —
Short-term bridge; refi at stabilization.
Rent comps 14 comps
| Address | Beds | Baths | Sqft | Rent | $/sqft | DOM | Units | Dist |
|---|---|---|---|---|---|---|---|---|
| 237 Saratoga Dr Ocean Springs, MS | 3.0 | 2.0 | 1295 | $2,150 | $1.66 | 13d | 1 | 0.20mi |
| 230 Saratoga Dr Ocean Springs, MS | 3.0 | 2.0 | 1450 | $1,800 | $1.24 | 43d | 1 | 0.24mi |
| 230 Saratoga Dr Ocean Springs, MS | 3.0 | 2.0 | 1380 | $1,850 | $1.34 | 13d | 1 | 0.24mi |
| 422 Whispering Pine Dr Ocean Springs, MS | 3.0 | 2.0 | 1075 | $1,795 | $1.67 | 13d | 1 | 0.32mi |
| 246 Woodland Cir Ocean Springs, MS | 3.0 | 1.0 | 984 | $1,475 | $1.50 | 43d | 1 | 0.81mi |
| 212 Maple Dr Ocean Springs, MS | 3.0 | 1.5 | 1092 | $1,475 | $1.35 | 13d | 1 | 0.83mi |
| 600 Bechtel Blvd Ocean Springs, MS | 2.0 | 2.0 | 944 | $1,500 | $1.59 | 13d | 1 | 1.03mi |
| 107 Elliott Pl Ocean Springs, MS | 3.0 | 1.0 | 1148 | $1,695 | $1.48 | 21d | 1 | 1.03mi |
| 2 Fleetwood Pl Ocean Springs, MS | 2.0 | 1.0 | 912 | $2,000 | $2.19 | 43d | 1 | 1.09mi |
| 2501 Bienville Blvd Ocean Springs, MS | 2.0 | 2.0 | 1156 | $2,000 | $1.73 | 43d | 1 | 1.11mi |
| 2501 Bienville Blvd Unit 432 Ocean Springs, MS | 2.0 | 2.0 | 1095 | $2,300 | $2.10 | 43d | 1 | 1.15mi |
| 111 Armand Oaks Ocean Springs, MS | 3.0 | 2.5 | 1500 | $1,800 | $1.20 | 43d | 1 | 1.18mi |
| 3500 Groveland Rd Ocean Springs, MS | 2.0–3.0 | 2.0 | 1173 | $1,750 | $1.49 | 13d | 1 | 1.24mi |
| 623 Camellia Pointe Blvd Ocean Springs, MS | 2.0 | 2.0 | 1333 | $2,200 | $1.65 | 43d | 1 | 1.36mi |
Listing history 19 events
-
2026-06-19status $199,500 Pending 29 DOM
-
2026-06-18days on market $199,500 Active 29 DOM
-
2026-06-17days on market $199,500 Active 28 DOM
-
2026-06-16days on market $199,500 Active 27 DOM
-
2026-06-15days on market $199,500 Active 26 DOM
-
2026-06-14days on market $199,500 Active 24 DOM
-
2026-06-13days on market $199,500 Active 23 DOM
-
2026-06-10days on market $199,500 Active 21 DOM
-
2026-06-09days on market $199,500 Active 20 DOM
-
2026-06-08days on market $199,500 Active 19 DOM
-
2026-06-07days on market $199,500 Active 18 DOM
-
2026-06-02days on market $199,500 Active 13 DOM
-
2026-06-01days on market $199,500 Active 12 DOM
-
2026-05-31days on market $199,500 Active 11 DOM
-
2026-05-30days on market $199,500 Active 10 DOM
-
2026-05-21$199,500 Active
-
2021-04-15soldstatus
-
2021-04-12soldstatus 335-char remark
Show marketing remark (335 chars)
Nature at your grasp! Enjoy your morning coffee listening to the birds cirp from one of 2 outside decks/porches, or stay inside and observe nature from your sunporch. This unique one-or-a-kind home is located on a quiet cul-de-sac near Pecan Park Elementary School. Open contemporary floorplan, rustic interior, must see to appreciate.
-
2020-11-18$143,777 335-char remark
Show marketing remark (335 chars)
Nature at your grasp! Enjoy your morning coffee listening to the birds cirp from one of 2 outside decks/porches, or stay inside and observe nature from your sunporch. This unique one-or-a-kind home is located on a quiet cul-de-sac near Pecan Park Elementary School. Open contemporary floorplan, rustic interior, must see to appreciate.
ⓘ Source: listings_history table (triggers on properties + properties_extension) + one-shot
backfill from property_details.listing_events for pre-trigger history.
Tax reassessment forecast MS · Resets to sale price
- Current annual tax
- $1,106 · $92/mo
- Projected year-2 tax
- $1,576 · $131/mo
- Expected delta
- +$470/yr (+$39/mo · 42.5%)
ⓘ Screening estimate from a state-policy table — verify with the county assessor before closing.
Climate risk First Street
- Flood 9/10 Extreme FEMA zone AE · 99% chance over 30 yrs
- Wildfire 3/10 Moderate
- Heat 10/10 Extreme 7 d/yr ≥107°F today · 22 d/yr by 30 yrs out
- Wind 9/10 Extreme 99% chance of damaging wind over 30 yrs
- Air quality 2/10 Low 1 unhealthy d/yr today · 2 by 30 yrs out
Nearby sold comps map
Loading sold comps map…
Walkable amenities ~0.75 mi
Loading nearby amenities…
Taxation est. · year 1
- Rental income
- $23,165
- − Mortgage interest
- −$11,175
- − Property taxes
- −$1,106
- − Insurance
- −$6,116
- − Repairs & maintenance
- −$1,853
- − Management
- −$1,853
- − Depreciation
- −$5,804
- Taxable loss
- −$4,742
- Est. tax savings @ 24.0%
- +$1,138
- After-tax cash flow
- $-338/yr
For passive investors: Depreciation is non-cash, so a rental often shows a tax loss while cash-flowing — sheltering income. Rental losses are passive: they offset passive income freely, and up to $25,000/yr can offset ordinary (W-2) income if you actively participate and your MAGI is under $100k (phasing out to $0 by $150k); unused losses carry forward. On sale, claimed depreciation is recaptured at up to 25%, and gains may owe capital-gains tax (a 1031 exchange can defer both). Figures are a year-1 estimate at your 24.0% rate — not tax advice; consult a CPA.
Schools (NCES district)
- District
- Ocean Springs School District
- NCES district ID
- 2803360
- Math proficiency
- 64% ▼ -3.00%
- Reading proficiency
- 59% ▲ 1.00%
- Median HH income
- $60,485
- Composite
- 53.35/100
- National rank
- #1477
- State rank
- #1 of 130 in MS
Livability — Ocean Springs
- Score
- 86/100
- State rank
- #2
- US rank
- #420
Category grades
Schools grade is shown separately in the Schools card above.
Census & demographics
- Census place
- Ocean Springs, MS
- County
- Jackson County · 82,196 people
- City population
- 43,240
- Metro
- Gulfport-Biloxi, MS
- Population (ZIP)
- 43,240
- Household income
- $78,596
- Rent vs Own
- Severe rent burden
- 734.0
Population outlook (Jackson County) Hauer SSP2
- Today (2025)
- 146,926 people
- By 2030
- 148,442 · +1.0%
- By 2040
- 149,631 · +1.8%
- By 2050
- 148,723 · +1.2%
- By 2075
- 147,845 · +0.6%
- By 2100
- 144,510 · -1.6%
Race, ethnicity, and origin ACS 2023
- Neighborhood character
- Predominantly White (74%)
- Race & ethnicity
- White 74% Black 10% Hispanic / Latino 8% Two or more races 7% Asian 4%
- Hispanic origin (detail)
- Mexican 3% Puerto Rican 2%
- Common ancestry
- Lithuanian 5% Slovak 4% Romanian 2%
- Foreign-born
- 5% · Canada, South Korea, Vietnam
- Languages at home
- 93% English-only · Spanish 3% Vietnamese 2% Tagalog/Filipino 1%
Political lean MEDSL · Jackson
- 2024 margin
- Solid R (+39.9) · D 29.5% · R 69.4% · Other 1.1%
- 2008→2024 swing
- -6.4pp toward R · 2008: -33.5pp · 2024: -39.9pp
- All cycles
- 2024: R+39.9 2020: R+34.6 2016: R+39.9 2012: R+36.1 2008: R+33.5
Not yet ingested
- Civics
- —
Market trends
- HPI YoY
- ▼ -74.77%
- Current HPI
- 204.2244
- Rent YoY
- ▲ 1.31%
- Metro
- Gulfport-Biloxi, MS
- State GDP YoY
- —
- F500 in state
- 0
Price history
+38.8% since first listed4 events — show timeline
- 2026-05-21 Listed $199,500 MLSU
- 2021-04-15 Sold (Public Records) — Public Records
- 2021-04-12 Sold (MLS) — MLSU
- 2020-11-18 Listed $143,777 MLSU
Property tax history
-7.4%/yrLatest (2025): $1,106 · +7.8% YoY. Source: county tax records.
Cash-flow waterfall
monthlySold comps — $/sqft
last 12 mo · ≤1 miLoading sold comps…