138 Hornet St · Elgin, TX
Flood risk No data
- FEMA flood zone
- —
- Chance of flooding over 30 yrs
- —
- Est. flood insurance / yr
- —
Fire risk No data
- Est. fire insurance / yr
- —
Heat risk No data
- Hot days now (above threshold)
- —
- Hot days in 30 yrs
- —
Wind risk No data
- Chance of severe wind over 30 yrs
- —
Air-quality risk No data
- Unhealthy air days now
- —
- Unhealthy air days in 30 yrs
- —
Risk factors via First Street. Map © Google.
Why this score? — see what drove the D- grade
The composite is a weighted blend of 9 inputs, each scored 0–100. Each bar is that input's sub-score; the figure is the points it added to the 100-point composite (weight × sub-score).
- Appreciation +10.0/10.0
- ARV discount +8.8/15.0
- Cash flow +6.3/30.0
- Livability +3.7/5.0
- Rent growth +3.3/5.0
- Condition / age +2.5/5.0
- Schools +2.0/10.0
- 1% rule +1.7/10.0
- DSCR +0.6/10.0
$311,450
🖨 Deal sheet (PDF) 📄 Offer letter ✓ Due diligence
Listing remarks
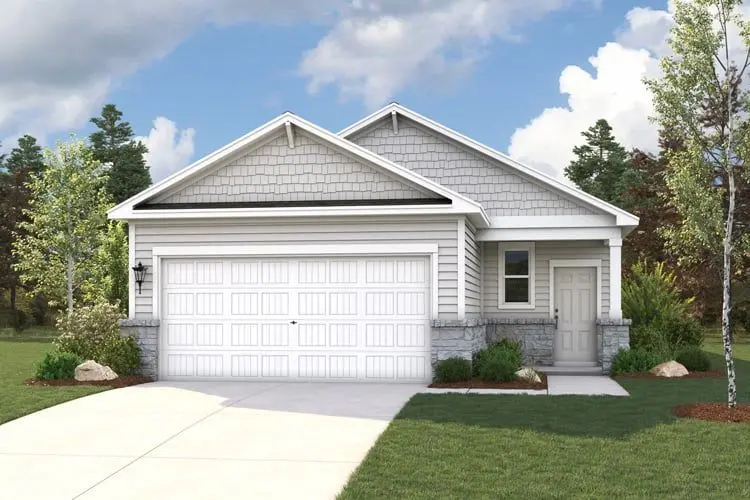
The one-story Laurel 2 plan was perfectly designed for modern living. A welcoming open layout lies at the heart of the home, showcasing a sunlit great room, a dining area, and a large kitchen with a wraparound counter, a center island, and a walk-in pantry. The inviting primary suite is adjacent, boasting a large walk-in closet and an attached bath. Two secondary bedrooms each offer their own walk-in closet. Options Include: Covered patio Stoop Fireplace in great room Tub with shower in lieu of walk-in shower at primary bath
Key facts
- One story
- Wraparound counter
- Open layout
Tags
Property features AI
Finance
- Other: Address: 138 Hornet St, Elgin TX 78621; Last updated Jun 13, 2026
- Financial info: List price $311,450
Exterior
- Parking: 2 covered garage spaces (2 total parking spaces)
- Home design: Single-family property (spec); Active listing
- Exterior features: Living area approximately 1,698
Interior
- Bedrooms: 3 bedrooms
- Bathrooms: 2 full bathrooms
- Interior features: Spec-built Laurel 2 plan
Neighborhood map
What this means for you Summary
Snapshot
- This is a 3-bed/2.0-bath single-family listed at $311k.
Deal economics
- At list price, monthly cash flow is $-551 ($-7k/yr) — negative.
- To cash-flow at today's rent, offer at most $232k (25.6% below list).
- To meet the 1% rule (rent ≥ 1% of price), the offer needs to be $209k (32.8% below list).
- Recommended offer: $209k (32.8% below list) — sets the bar for 1% rule.
Location & tenants
- Location reads 74/100 on livability (#167 in TX, #4,404 nationally) — a middle-class / working-renter tenant base. Strengths: cost of living A+, housing A+, health & safety A+; Watch: schools F, amenities F, commute F.
- Elgin ISD (rural): math 17% / reading 26% proficiency, ranked #741 of 826 in TX (top 90%) — low school quality limits family demand, transient renter base, plan for 1-2y turnover; 67% free/reduced lunch — lower-income household profile, screen leases tightly.
- Market conditions: Rents rising (+3.1%/yr); 813 active listings in the ZIP; 6 comparable units currently listed for rent nearby; rentals at typical pace (median 19d on market — plan ~3-4 weeks tenant-placement turnaround); solid renter incomes; 1,841 units permitted in Bastrop County in 2024 (150 in 5+ unit buildings).
Forward outlook
- In year one you build about $33k of equity ($2k loan paydown + $31k appreciation (10.0% local appreciation)).
- Bastrop County population projected at +37% by 2050 — long-run rental-demand tailwind backs the buy-and-hold thesis.
- By year 2, paydown + projected appreciation supports a ~$54k cash-out refi (75% LTV) — recoverable capital for the next deal without selling this one.
Negotiation context
- Only 6 days on market — expect competitive offers; lowballing is unlikely to land.
Questions for the listing agent
- What do current leases actually rent for vs. the listed asking? Can we see a recent rent roll and the last 12 months of T-12 income?
- What does the HOA fee cover, when was the last increase, and are there any pending special assessments or reserve-fund shortfalls?
- Is there a deadline driving the sale (1031 exchange, divorce, estate, relocation)? That informs how much negotiation room exists.
- Schools are F-rated, which usually means shorter tenancies and higher turnover. Who's the typical renter profile here, and what's been the actual vacancy rate?
- The area grade is low — what's the realistic commute time and amenity access for the typical tenant pool here? Any planned neighborhood developments (good or bad) we should know about?
- What's the average days-on-market for RENTAL listings here right now (not sales)? A rising rental-DOM trend means longer vacancies and softer asking-rent achievability than the comps imply.
- What's the recent tenant-quality profile in this submarket — average credit score on applications, eviction rate, late-payment / NSF rate, and stable-employment percentage? A property-management company in the area should have these aggregated.
- How much new for-sale + rental construction is in the pipeline within 1–3 miles? Heavy new supply typically softens prices + rents 12–24 months out; constrained supply supports both.
Investment metrics
- 1% rule
- 0.67% ✗
- Cap rate
- 4.17%
- Cash-on-cash
- -7.58%
- DSCR
- 0.66
- GRM
- 12.4
CMA / ARV
- ARV (on-the-fly)
- $320,922
- Comps found
- 12
Show comp detail 12 sales within ~0.75 mi
| Address | Dist | Beds/Ba | Sqft | Sold | Price | $/sf | Match |
|---|---|---|---|---|---|---|---|
| 437 Lucky Ave | 0.13mi | 4/3.0 (+1) | 1,648 (-3%) | 2mo | $300,490 | $182 | 79 |
| 140 Tolo Dr | 0.06mi | 3/2.0 | 1,487 (-12%) | 0mo | $253,990 | $171 | 76 |
| 150 Tolo Dr | 0.07mi | 3/2.0 | 1,487 (-12%) | 1mo | $284,990 | $192 | 75 |
| 153 Tolo Dr | 0.09mi | 3/2.0 | 1,482 (-13%) | 2mo | $299,990 | $202 | 73 |
| 445 Lucky Ave | 0.11mi | 3/2.0 | 1,487 (-12%) | 2mo | $276,990 | $186 | 73 |
| 435 Lucky Ave | 0.13mi | 4/2.0 (+1) | 1,522 (-10%) | 1mo | $299,490 | $197 | 71 |
| 200 Hidalgo Ln | 0.37mi | 4/2.0 (+1) | 1,818 (+7%) | 3mo | $321,770 | $177 | 64 |
| 305 Bendecido Loop | 0.50mi | 4/3.0 (+1) | 1,674 (-1%) | 3mo | $278,975 | $167 | 63 |
| 147 Two Bits Ln | 0.47mi | 4/2.5 (+1) | 1,785 (+5%) | 3mo | $299,840 | $168 | 60 |
| 159 Two Bits Ln | 0.44mi | 4/2.0 (+1) | 1,531 (-10%) | 2mo | $288,990 | $189 | 56 |
| 143 Two Bits Ln | 0.47mi | 4/2.0 (+1) | 1,531 (-10%) | 2mo | $289,990 | $189 | 55 |
| 123 Two Bits Ln | 0.50mi | 4/2.0 (+1) | 1,531 (-10%) | 1mo | $298,925 | $195 | 54 |
Match score weights: distance 35% · size 25% · config 20% · recency 20%. Top-matched comps best support the ARV.
Projected returns pro-forma
10.0% appreciation · 3.12% rent growth · sell at horizon
- IRR
- 19.0%
- Equity multiple
- 2.55×
- Total profit
- $134,867
- Equity at exit
- $280,579
- IRR
- 17.6%
- Equity multiple
- 5.88×
- Total profit
- $425,385
- Equity at exit
- $605,079
Cash invested: $87,206 (down + closing). Projections, not guarantees.
Landlord ↔ Tenant lean methodology
- Overall (STATE)
- 87 Strongly Landlord-Friendly
- State Texas
- 87 Strongly Landlord-Friendly · R+5
- County
- — inherits STATE
- City
- — inherits STATE
ZIP-level market 78621
- Home prices YoY
- 7.6%
- Rents YoY
- 3.1%
- Active inventory
- 813
- Price-to-rent
- 12.4×
Monthly cashflow live
- Estimated rent
- $2,093 high interval (Pro) →
- Mortgage (P&I)
- −$1,633
- Tax est. 1.5%
- −$389 /mo · $4,672/yr
- Insurance
- −$130
- HOA
- −$52
- Vacancy / Maint / Mgmt
- −$440
- Net cashflow
- $-551
Break-even live
Sensitivity live
| Price | -10% $-335 | -5% $-443 | +0% $-551 | +5% $-658 | +10% $-766 |
|---|---|---|---|---|---|
| Rent | -10% $-716 | -5% $-633 | +0% $-551 | +5% $-468 | +10% $-385 |
| Rate | -1.0pp $-394 | -0.5pp $-471 | base $-551 | +0.5pp $-631 | +1.0pp $-713 |
UW: 25.0% down · 7.5% · 30yr · 1.5% tax · 5.0% vac · 8.0% maint · 8.0% mgmt
Financing live
Cash to close
- Down payment
- $77,862
- Closing costs
- $9,344
- Reserves months
- —
- Total cash needed
- —
Loan-product check · same deal, 3 products live
Conventional
25% down · 7.5% · 30yr
- Down + closing
- —
- Monthly P&I
- —
- Monthly cashflow
- —
- DSCR
- —
- Eligible?
- —
Personal DTI + credit; lowest rate.
DSCR
20% down · 8.5% · 30yr
- Down + closing
- —
- Monthly P&I
- —
- Monthly cashflow
- —
- DSCR
- —
- Eligible?
- —
No personal income docs; deal must DSCR.
Hard money
10% down · 12.0% · 12mo
- Down + closing
- —
- Monthly P&I
- —
- Monthly cashflow
- —
- DSCR
- —
- Eligible?
- —
Short-term bridge; refi at stabilization.
Rent comps 6 comps
| Address | Beds | Baths | Sqft | Rent | $/sqft | DOM | Units | Dist |
|---|---|---|---|---|---|---|---|---|
| 108 Bendecido Loop Elgin, TX | 3.0 | 2.0 | 1300 | $1,950 | $1.50 | 19d | 1 | 0.29mi |
| 813 Central Ave Elgin, TX | 4.0 | 2.0 | 2025 | $2,300 | $1.14 | 5d | 1 | 0.51mi |
| 212 Lake Placid Run Elgin, TX | 3.0 | 2.5 | 1681 | $1,895 | $1.13 | 0d | 1 | 0.80mi |
| 120 Jim Dandy Dr Elgin, TX | 4.0 | 2.0 | 1650 | $1,923 | $1.17 | 5d | 1 | 0.80mi |
| 102 Schuylerville Dr Elgin, TX | 3.0 | 2.0 | 1479 | $1,800 | $1.22 | 45d | 1 | 0.92mi |
| 110 S Main St #104 Elgin, TX | 3.0 | 2.0 | 1061 | $1,700 | $1.60 | 45d | 1 | 1.04mi |
HOA detail
- Monthly dues
- $52 · $624/yr
Listing history 7 events
-
2026-06-21days on market $311,450 Active 6 DOM
-
2026-06-18days on market $311,450 Active 3 DOM
-
2026-06-17days on market $311,450 Active 2 DOM
-
2026-06-16days on market $311,450 Active 1 DOM
-
2026-06-15days on market $311,450 Active 2 DOM
-
2026-06-13remarks 530-char remark
-
2026-06-13$311,450 Active 1 DOM
ⓘ Source: listings_history table (triggers on properties + properties_extension) + one-shot
backfill from property_details.listing_events for pre-trigger history.
Nearby sold comps map
Loading sold comps map…
Walkable amenities ~0.75 mi
Loading nearby amenities…
Taxation est. · year 1
- Rental income
- $25,119
- − Mortgage interest
- −$17,446
- − Property taxes
- −$4,672
- − Insurance
- −$1,557
- − Repairs & maintenance
- −$2,010
- − Management
- −$2,010
- − HOA
- −$624
- − Depreciation
- −$9,060
- Taxable loss
- −$12,259
- Est. tax savings @ 24.0%
- +$2,942
- After-tax cash flow
- $-3,666/yr
For passive investors: Depreciation is non-cash, so a rental often shows a tax loss while cash-flowing — sheltering income. Rental losses are passive: they offset passive income freely, and up to $25,000/yr can offset ordinary (W-2) income if you actively participate and your MAGI is under $100k (phasing out to $0 by $150k); unused losses carry forward. On sale, claimed depreciation is recaptured at up to 25%, and gains may owe capital-gains tax (a 1031 exchange can defer both). Figures are a year-1 estimate at your 24.0% rate — not tax advice; consult a CPA.
Schools (NCES district)
- District
- Elgin ISD
- NCES district ID
- 4818360
- Math proficiency
- 17% ▼ -9.00%
- Reading proficiency
- 26% ▼ -5.00%
- Median HH income
- $55,176
- Composite
- 19.62/100
- National rank
- #8749
- State rank
- #741 of 826 in TX
Livability — Elgin
- Score
- 74/100
- State rank
- #167
- US rank
- #4404
Category grades
Schools grade is shown separately in the Schools card above.
Census & demographics
- County
- Bastrop County · 68,601 people
- City population
- 27,860
- Metro
- Austin-Round Rock-Georgetown, TX
- Population (ZIP)
- 30,411
- Household income
- $98,534
- Rent vs Own
- Severe rent burden
- 235.0
Population outlook (Bastrop County) Hauer SSP2
- Today (2025)
- 94,260 people
- By 2030
- 101,355 · +7.5%
- By 2040
- 115,578 · +22.6%
- By 2050
- 129,464 · +37.3%
- By 2075
- 168,068 · +78.3%
- By 2100
- 194,857 · +106.7%
Race, ethnicity, and origin ACS 2023
- Neighborhood character
- Diverse neighborhood (Simpson 0.64)
- Race & ethnicity
- Hispanic / Latino 46% White 38% Two or more races 19% Black 11% Native American 1%
- Hispanic origin (detail)
- Mexican 38%
- Common ancestry
- Slovak 2% Italian 2% Romanian 1%
- Foreign-born
- 17% · Canada, Vietnam
- Languages at home
- 63% English-only · Spanish 36%
Political lean MEDSL · Bastrop
- 2024 margin
- R (+18.4) · D 40.2% · R 58.6% · Other 1.2%
- 2008→2024 swing
- -10.2pp toward R · 2008: -8.2pp · 2024: -18.4pp
- All cycles
- 2024: R+18.4 2020: R+13.8 2016: R+20.4 2012: R+17.0 2008: R+8.2
Not yet ingested
- Civics
- —
Market trends
- HPI YoY
- ▲ 29.47%
- Current HPI
- 416.87
- Rent YoY
- ▲ 3.12%
- Metro
- Austin-Round Rock-Georgetown, TX
- State GDP YoY
- ▲ 3.95%
- F500 in state
- 110
Industry mix (Fortune 500 HQ in TX)
| Industry | F500 HQs | Revenue |
|---|---|---|
| Energy | 16 | $1,198B |
|
||
| Technology | 5 | $198B |
|
||
| Engineering / Construction | 4 | $72B |
|
||
| Energy Services | 3 | $60B |
|
||
| Utilities | 3 | $41B |
|
||
| Healthcare | 2 | $330B |
|
||
Cash-flow waterfall
monthlySold comps — $/sqft
last 12 mo · ≤1 miLoading sold comps…