41-18 27th St Unit 8-A · New York, NY
Flood risk 1/10 · Minimal
- FEMA flood zone
- X (unshaded)
- Chance of flooding over 30 yrs
- 0.0%
- Est. flood insurance / yr
- $507 – $1,088
Fire risk 1/10 · Minimal
- Est. fire insurance / yr
- $691 – $1,283
Heat risk 6/10 · Moderate
- Hot days now (above 99°F)
- 7 days/yr
- Hot days in 30 yrs
- 15 days/yr
Wind risk 6/10 · Moderate
- Chance of severe wind over 30 yrs
- 27.0%
Air-quality risk 4/10 · Minor
- Unhealthy air days now
- 5 days/yr
- Unhealthy air days in 30 yrs
- 6 days/yr
Risk factors via First Street. Map © Google.
Why this score? — see what drove the D- grade
The composite is a weighted blend of 9 inputs, each scored 0–100. Each bar is that input's sub-score; the figure is the points it added to the 100-point composite (weight × sub-score).
- Appreciation +7.8/10.0
- ARV discount +7.5/15.0
- Cash flow +6.7/30.0
- Schools +5.0/10.0
- Livability +3.8/5.0
- Rent growth +2.8/5.0
- Condition / age +2.5/5.0
- 1% rule +1.9/10.0
- DSCR +1.0/10.0
$750,000
🖨 Deal sheet 📄 Offer letter ✓ Due diligence
Listing remarks
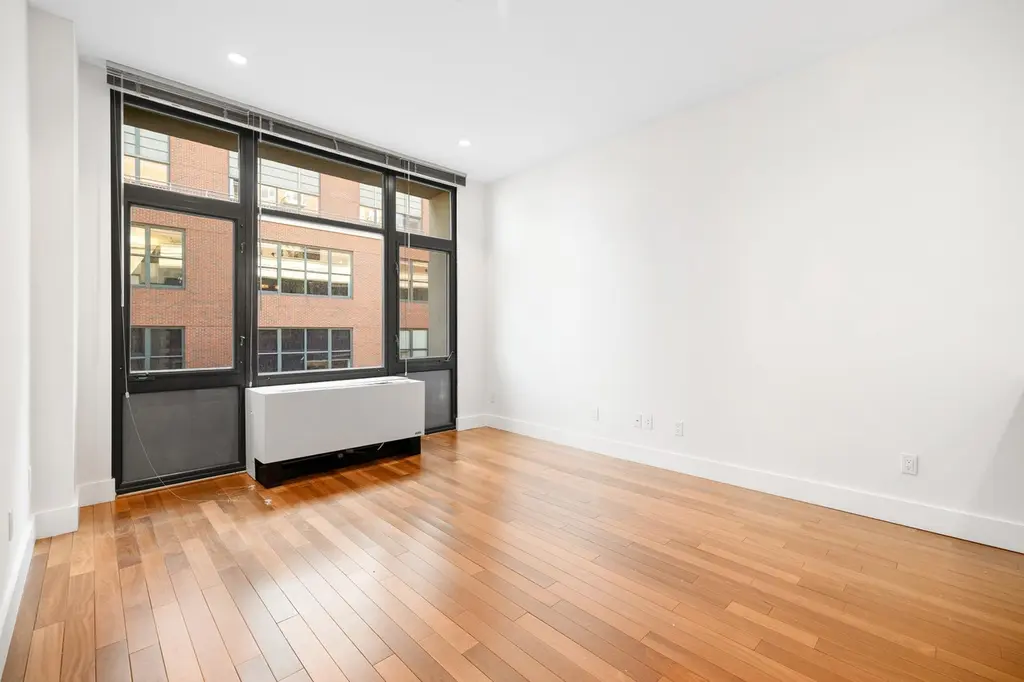
Prime Long Island City Location – Quiet 1-Bedroom in Boutique CondoIn the Millstone Condominium just one block from the Queens Plaza subway— well-maintained 1-bedroom featuring Brazilian teak hardwood floors, high 9’6” ceilings, and ample closet space. The living room includes custom shades and the adjacent open kitchen is equipped with granite countertops, custom cabinetry, an island, and Fisher & Paykel stainless steel appliances—including a dishwasher. The spacious bedroom provides generous closet space and the tiled bath features a soaking tub, ideal for relaxing. Additionally, a full-sized washer & dryer are in-unit for your convenience. With o
Key facts
- Custom shades
- Ample closet space
- High ceilings
Tags
Property features AI
Finance
- HOA & community: Monthly association fee of $509; Pets allowed in building
Exterior
- Home design: Condominium unit on 8th floor (entry level: 8); 8-story building
- Construction: Elevator-served building
- Exterior features: Building roof deck; East-facing exposure
Interior
- Bedrooms: 3 total rooms (includes bedrooms and living spaces)
- Bathrooms: 1 full bathroom
- Heating & cooling: Central air conditioning
- Interior features: Dining area
- Laundry & utility: In-unit washer and dryer; Building allows washer/dryer installation
Neighborhood map
What this means for you Summary
Snapshot
- This is a 1-bed/1.0-bath condo listed at $750k.
Deal economics
- At list price, monthly cash flow is $-1k ($-14k/yr) — negative.
- To cash-flow at today's rent, offer at most $538k (28.2% below list).
- To meet the 1% rule (rent ≥ 1% of price), the offer needs to be $521k (30.6% below list).
- Recommended offer: $521k (30.6% below list) — sets the bar for 1% rule.
- Cap rate 4.4% vs local median 2.6% in New York — top-decile yield for the area; either an underpriced asset or a hidden risk that comps aren't pricing in. Stress-test before assuming the spread holds.
Location & tenants
- Location reads 75/100 on livability (#268 in NY, #4,188 nationally) — a middle-class / working-renter tenant base. Strengths: amenities A+, commute A+, health & safety A; Watch: crime F, cost of living F.
- Market conditions: Rents rising (+1.1%/yr); 258 active listings in the ZIP; 24 comparable units currently listed for rent nearby; rentals leasing fast (median 3d on market — plan ~1-2 weeks tenant-placement turnaround); high-income renter base; 5,302 units permitted in Queens County in 2024 (4,918 in 5+ unit buildings).
- At $5,206/mo this rent would consume 52% of the median local household income ($121k/yr) (locally 3440% of renters already pay >50% of income on rent) — very limited rent-growth headroom before tenants either downsize or default.
Forward outlook
- In year one you build about $47k of equity ($5k loan paydown + $42k appreciation (5.6% local appreciation)).
- Queens County population projected at +16% by 2050 — long-run rental-demand tailwind backs the buy-and-hold thesis.
- By year 2, paydown + projected appreciation supports a ~$76k cash-out refi (75% LTV) — recoverable capital for the next deal without selling this one.
Negotiation context
- It's been on market 63 days — a 6% lower offer ($705k) is reasonable based on typical stale-listing flexibility.
- 11 sale attempts since 11y ago with the ask held roughly flat each time — persistent listings suggest the price (not the market) is what's stuck; bring a comps-based counter.
- Current owner paid $620k; 21% above their basis — modest negotiation headroom, anchor on the comps not their cost.
Risks & watch-outs
- Climate carrying-cost: major wind risk, 27% chance of damaging wind over 30y; extreme-heat days projected 7→15/yr by 2055 (HVAC capex compounding) — expect insurance premiums to compound above CPI over the hold.
Questions for the listing agent
- What do current leases actually rent for vs. the listed asking? Can we see a recent rent roll and the last 12 months of T-12 income?
- It's been on market 63 days. Have you received any prior offers? Is the seller open to a 31% concession, seller financing, or rate buy-down credit?
- What does the HOA fee cover, when was the last increase, and are there any pending special assessments or reserve-fund shortfalls?
- Any open or pending special assessments — roof, HVAC, plumbing, elevator, façade? What's the per-unit balance and payoff schedule, and is the seller paying it off at close or rolling it to the buyer?
- Why hasn't it sold? Are there any deal-killer items the seller is aware of (foundation, flood, title, zoning, code violations)?
- Is there a deadline driving the sale (1031 exchange, divorce, estate, relocation)? That informs how much negotiation room exists.
- Schools are B-rated — typically a magnet for longer-tenancy family renters. What's the average tenant stay here, and is there a school-zone premium baked into asking?
- Crime grade is F in this area — have there been break-ins, vandalism, or insurance claims at this property in the last 3 years? What carrier currently insures it and at what premium?
- The area grade is low — what's the realistic commute time and amenity access for the typical tenant pool here? Any planned neighborhood developments (good or bad) we should know about?
- What's the average days-on-market for RENTAL listings here right now (not sales)? A rising rental-DOM trend means longer vacancies and softer asking-rent achievability than the comps imply.
- What's the recent tenant-quality profile in this submarket — average credit score on applications, eviction rate, late-payment / NSF rate, and stable-employment percentage? A property-management company in the area should have these aggregated.
- How much new apartment / multifamily construction is in the pipeline within 1–3 miles? Heavy new supply (>2% of stock underway) typically softens rents 12–24 months out; light construction supports rent growth.
Investment metrics
- 1% rule
- 0.69% ✗
- Cap rate
- 4.38%
- Cash-on-cash
- -6.85%
- DSCR
- 0.70
- GRM
- 12.0
CMA / ARV
No comps found within radius.
Projected returns pro-forma
5.62% appreciation · 1.09% rent growth · sell at horizon
- IRR
- 8.2%
- Equity multiple
- 1.54×
- Total profit
- $113,571
- Equity at exit
- $453,379
- IRR
- 9.4%
- Equity multiple
- 2.81×
- Total profit
- $380,567
- Equity at exit
- $806,994
Cash invested: $210,000 (down + closing). Projections, not guarantees.
Landlord ↔ Tenant lean methodology
- Overall (CITY)
- 0 Strongly Tenant-Friendly
- State New York
- 15 Strongly Tenant-Friendly · D+10
- County
- — inherits STATE
- City New York
- 0 Strongly Tenant-Friendly · D+34
ZIP-level market 11101
- Home prices YoY
- 1.1%
- Rents YoY
- 1.1%
- Active inventory
- 258
- Price-to-rent
- 12.0×
Monthly cashflow live
- Estimated rent
- $5,206 high interval (Pro) →
- Mortgage (P&I)
- −$3,933
- Tax from tax record
- −$556 /mo · $6,674/yr
- Insurance
- −$312
- HOA
- −$509
- Vacancy / Maint / Mgmt
- −$1,093
- Net cashflow
- $-1,198
Break-even live
UW: 25.0% down · 7.5% · 30yr · 1.5% tax · 5.0% vac · 8.0% maint · 8.0% mgmt
Financing live
Cash to close
- Down payment
- $187,500
- Closing costs
- $22,500
- Reserves months
- —
- Total cash needed
- —
Loan-product check · same deal, 3 products live
Conventional
25% down · 7.5% · 30yr
- Down + closing
- —
- Monthly P&I
- —
- Monthly cashflow
- —
- DSCR
- —
- Eligible?
- —
Personal DTI + credit; lowest rate.
DSCR
20% down · 8.5% · 30yr
- Down + closing
- —
- Monthly P&I
- —
- Monthly cashflow
- —
- DSCR
- —
- Eligible?
- —
No personal income docs; deal must DSCR.
Hard money
10% down · 12.0% · 12mo
- Down + closing
- —
- Monthly P&I
- —
- Monthly cashflow
- —
- DSCR
- —
- Eligible?
- —
Short-term bridge; refi at stabilization.
Rent comps 24 comps
| Address | Beds | Baths | Sqft | Rent | $/sqft | DOM | Units | Dist |
|---|---|---|---|---|---|---|---|---|
| 2719 44th Dr Long Island City, NY | 1.0 | 1.0 | 628 | $4,945 | $7.87 | 7d | 2 | 0.39mi |
| 3705 30th St Long Island City, NY | 2.0 | 1.0–2.0 | 700 | $4,840 | $6.91 | 10d | 3 | 0.42mi |
| 475 48th Ave Long Island City, NY | 3.0 | 1.0–3.0 | 1293 | $5,374 | $4.15 | 1d | 1 | 1.04mi |
| 34-35 44th St Astoria, NY | 1.0–2.0 | 1.0–2.0 | 613 | $3,576 | $5.83 | 1d | 26 | 1.12mi |
| 888 Main St New York, NY | 1.0–3.0 | 1.0–2.0 | 963 | $4,431 | $4.60 | 6d | 7 | 1.18mi |
| 599 E 56th St Unit 1817 New York, NY | 1.0 | 1.0 | 625 | $4,850 | $7.76 | 24d | 1 | 1.19mi |
| 515 E 72nd St Unit 17D New York, NY | 1.0 | 1.0 | 687 | $5,500 | $8.01 | 24d | 1 | 1.24mi |
| 403 E 62nd St Unit 14C New York, NY | 1.0 | 1.0 | 650 | $4,900 | $7.54 | 21d | 1 | 1.28mi |
| 400 E 66th St Unit 1016404P New York, NY | 1.0–2.0 | 1.0–2.0 | 791 | $10,597 | $13.40 | 3d | 2 | 1.31mi |
| 420 E 54th St New York, NY | 3.0 | 1.0–2.5 | 1104 | $7,261 | $6.57 | 1d | 14 | 1.31mi |
| 400 E 57th St #2106 New York, NY | 2.0 | 1.0–2.0 | 903 | $6,610 | $7.32 | 3d | 3 | 1.31mi |
| 403 E 69th St #1518 New York, NY | 1.0–3.0 | 1.0 | 745 | $3,990 | $5.36 | 24d | 3 | 1.34mi |
| 1290 1st Ave #1499 New York, NY | 2.0 | 1.0 | 671 | $6,100 | $9.09 | 2d | 2 | 1.36mi |
| 940 1st Ave Unit 2040 New York, NY | 2.0 | 1.5 | 600 | $7,500 | $12.50 | 1d | 1 | 1.39mi |
| 329 E 58th St #807 New York, NY | 2.0 | 1.0 | 650 | $5,860 | $9.02 | 7d | 1 | 1.39mi |
| 959 1st Ave Unit 6X New York, NY | 1.0 | 1.0 | 739 | $6,000 | $8.12 | 24d | 1 | 1.40mi |
| 340 E 52nd St #1527 New York, NY | 1.0 | 1.0 | 575 | $8,080 | $14.05 | 1d | 2 | 1.44mi |
| 1 Bell Slip Brooklyn, NY | 2.0 | 1.0–2.0 | 766 | $5,354 | $6.98 | 1d | 7 | 1.44mi |
| 333 E 52nd St Unit 2177 New York, NY | 2.0 | 1.0 | 600 | $4,900 | $8.17 | 21d | 1 | 1.45mi |
| 1373 1st Ave Unit 1952 New York, NY | 2.0 | 2.0 | 650 | $7,260 | $11.17 | 24d | 1 | 1.45mi |
| 252 E 61st St #638 New York, NY | 1.0 | 1.0 | 666 | $5,530 | $8.30 | 1d | 2 | 1.47mi |
| 340 E 51st St New York, NY | 2.0 | 1.0–2.0 | 791 | $6,250 | $7.90 | 3d | 3 | 1.48mi |
| 1310 2nd Ave Unit 1224958P New York, NY | 1.0–2.0 | 1.0 | 699 | $5,450 | $7.80 | 1d | 2 | 1.48mi |
| 1 Blue Slip Brooklyn, NY | 2.0 | 1.0–2.0 | 834 | $5,484 | $6.57 | 1d | 13 | 1.50mi |
HOA detail condo
- Monthly dues
- $509 · $6,108/yr
- Assessments
- None detected in remarks — confirm with the listing agent.
Listing history 29 events
-
2026-06-18days on market $750,000 Active 63 DOM
-
2026-06-17days on market $750,000 Active 62 DOM
-
2026-06-15days on market $750,000 Active 60 DOM
-
2026-06-13days on market $750,000 Active 58 DOM
-
2026-06-10days on market $750,000 Active 54 DOM
-
2026-06-08days on market $750,000 Active 53 DOM
-
2026-06-08days on market $750,000 Active 52 DOM
-
2026-06-04days on market $750,000 Active 49 DOM
-
2026-06-03days on market $750,000 Active 48 DOM
-
2026-06-01days on market $750,000 Active 46 DOM
-
2026-05-31days on market $750,000 Active 45 DOM
-
2026-05-18price $750,000
-
2026-04-16$780,000 Active
-
2024-08-09historical $3,600
-
2024-08-08$3,600
-
2024-07-31historical $3,600
-
2024-07-29$3,600
-
2022-11-20price $567,000
-
2021-09-16price $620,000
-
2021-09-15soldstatus $620,000
-
2020-09-30$695,000 Active
-
2020-06-08$670,000 Active
-
2020-02-07$725,000 Active
-
2020-02-07$725,000 Active
-
2016-04-01$590,000
-
2016-04-01$590,000
-
2015-09-04price $620,000
-
2015-08-04$590,000
-
2015-08-04$590,000
ⓘ Source: listings_history table (triggers on properties + properties_extension) + one-shot
backfill from property_details.listing_events for pre-trigger history.
Tax reassessment forecast NY · Partial reset (capped growth)
- Current annual tax
- $6,674 · $556/mo
- Projected year-2 tax
- $9,674 · $806/mo
- Expected delta
- +$3,001/yr (+$250/mo · 45.0%)
ⓘ Screening estimate from a state-policy table — verify with the county assessor before closing.
Climate risk First Street
- Flood 1/10 Low FEMA zone X (unshaded) · 0% chance over 30 yrs
- Wildfire 1/10 Low
- Heat 6/10 Major 7 d/yr ≥99°F today · 15 d/yr by 30 yrs out
- Wind 6/10 Major 27% chance of damaging wind over 30 yrs
- Air quality 4/10 Moderate 5 unhealthy d/yr today · 6 by 30 yrs out
Nearby sold comps map
Loading sold comps map…
Walkable amenities ~0.75 mi
Loading nearby amenities…
Taxation est. · year 1
- Rental income
- $62,474
- − Mortgage interest
- −$42,012
- − Property taxes
- −$6,674
- − Insurance
- −$3,750
- − Repairs & maintenance
- −$4,998
- − Management
- −$4,998
- − HOA
- −$6,108
- − Depreciation
- −$21,818
- Taxable loss
- −$27,884
- Est. tax savings @ 24.0%
- +$6,692
- After-tax cash flow
- $-7,682/yr
For passive investors: Depreciation is non-cash, so a rental often shows a tax loss while cash-flowing — sheltering income. Rental losses are passive: they offset passive income freely, and up to $25,000/yr can offset ordinary (W-2) income if you actively participate and your MAGI is under $100k (phasing out to $0 by $150k); unused losses carry forward. On sale, claimed depreciation is recaptured at up to 25%, and gains may owe capital-gains tax (a 1031 exchange can defer both). Figures are a year-1 estimate at your 24.0% rate — not tax advice; consult a CPA.
Schools (NCES district)
No district data.
Livability — New York
- Score
- 75/100
- State rank
- #268
- US rank
- #4188
Category grades
Schools grade is shown separately in the Schools card above.
Census & demographics
- Census place
- New York, NY
- County
- Queens County · 1,914,869 people
- City population
- 7,731,280
- Metro
- New York-Newark-Jersey City, NY-NJ-PA
- Population (ZIP)
- 42,219
- Household income
- $121,062
- Rent vs Own
- Severe rent burden
- 3440.0
Population outlook (Queens County) Hauer SSP2
- Today (2025)
- 2,546,320 people
- By 2030
- 2,643,059 · +3.8%
- By 2040
- 2,815,563 · +10.6%
- By 2050
- 2,944,423 · +15.6%
- By 2075
- 3,123,338 · +22.7%
- By 2100
- 3,098,688 · +21.7%
Race, ethnicity, and origin ACS 2023
- Neighborhood character
- Highly diverse neighborhood (Simpson 0.74)
- Race & ethnicity
- White 34% Asian 31% Hispanic / Latino 19% Two or more races 11% Black 10%
- Hispanic origin (detail)
- Mexican 5% Puerto Rican 3% Dominican 2%
- Common ancestry
- Romanian 2% Lithuanian 1% Scotch-Irish 1%
- Foreign-born
- 41% · Canada, China, South Korea
- Languages at home
- 52% English-only · Spanish 15% Other Indo-European 11% Chinese 10%
Political lean MEDSL · Queens
- 2024 margin
- Strong D (+24.6) · D 62.3% · R 37.7%
- 2008→2024 swing
- -26.2pp toward R · 2008: 50.8pp · 2024: 24.6pp
- All cycles
- 2024: D+24.6 2020: D+45.2 2016: D+53.4 2012: D+58.5 2008: D+50.8
Not yet ingested
- Civics
- —
Market trends
- HPI YoY
- ▲ 5.62%
- Current HPI
- 500.0296
- Rent YoY
- ▲ 1.09%
- Metro
- New York-Newark-Jersey City, NY-NJ-PA
- State GDP YoY
- ▲ 2.60%
- F500 in state
- 92
Industry mix (Fortune 500 HQ in NY)
| Industry | F500 HQs | Revenue |
|---|---|---|
| Financial Services | 10 | $950B |
|
||
| Consumer Goods | 9 | $162B |
|
||
| Insurance | 4 | $225B |
|
||
| Telecommunications | 2 | $144B |
|
||
| Pharmaceuticals | 2 | $112B |
|
||
| Media / Entertainment | 2 | $69B |
|
||
Price history
+27.1% since first listed18 events — show timeline
- 2026-05-18 Price Changed $750,000 RLS at REBNY
- 2026-04-16 Listed $780,000 RLS at REBNY
- 2024-08-09 Rental Removed $3,600 REALTYMX
- 2024-08-08 Listed for Rent $3,600 REALTYMX
- 2024-07-31 Rental Removed $3,600 REBNY
- 2024-07-29 Listed for Rent $3,600 REBNY
- 2022-11-20 Price Changed $567,000 RLS at REBNY
- 2021-09-16 Price Changed $620,000 RLS at REBNY
- 2021-09-15 Sold (Public Records) $620,000 Public Records
- 2020-09-30 Listed $695,000 RLS at REBNY
- 2020-06-08 Listed $670,000 RLS at REBNY
- 2020-02-07 Listed $725,000 RLS at REBNY
- 2020-02-07 Listed $725,000 RLS at REBNY
- 2016-04-01 Listed $590,000 RLS at REBNY
- 2016-04-01 Listed $590,000 RLS at REBNY
- 2015-09-04 Price Changed $620,000 RLS at REBNY
- 2015-08-04 Listed $590,000 RLS at REBNY
- 2015-08-04 Listed $590,000 RLS at REBNY
Property tax history
+23.5%/yrLatest (2025): $6,674 · +27.8% YoY. Source: county tax records.
Cash-flow waterfall
monthlySold comps — $/sqft
last 12 mo · ≤1 miLoading sold comps…