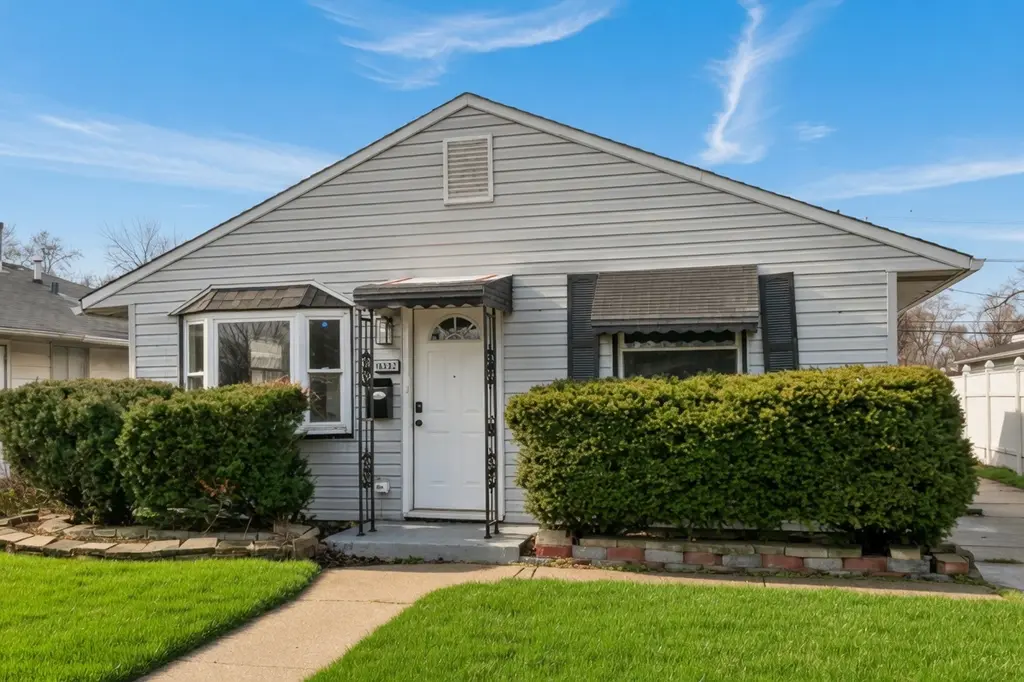
15332 Dante Ave · Dolton, IL
Flood risk 1/10 · Minimal
- FEMA flood zone
- X (unshaded)
- Chance of flooding over 30 yrs
- 0.0%
- Est. flood insurance / yr
- $473 – $860
Fire risk 1/10 · Minimal
- Est. fire insurance / yr
- $804 – $1,492
Heat risk 3/10 · Minor
- Hot days now (above 101°F)
- 7 days/yr
- Hot days in 30 yrs
- 15 days/yr
Wind risk 2/10 · Minimal
- Chance of severe wind over 30 yrs
- —
Air-quality risk 4/10 · Minor
- Unhealthy air days now
- 4 days/yr
- Unhealthy air days in 30 yrs
- 5 days/yr
Risk factors via First Street. Map © Google.
Why this score? — see what drove the C grade
The composite is a weighted blend of 9 inputs, each scored 0–100. Each bar is that input's sub-score; the figure is the points it added to the 100-point composite (weight × sub-score).
- Cash flow +29.6/30.0
- DSCR +10.0/10.0
- 1% rule +7.2/10.0
- Rent growth +4.9/5.0
- Livability +3.7/5.0
- Condition / age +2.5/5.0
- Schools +0.7/10.0
- ARV discount +0.0/15.0
- Appreciation +0.0/10.0
$169,800
🖨 Deal sheet 📄 Offer letter ✓ Due diligence
Listing remarks
Whether you're looking for a place to call home or a renovated investment opportunity, this property delivers. Move right in or take advantage of its strong rental potential and income-producing capabilities. This home is IHDAccess Home Eligible for many buyers! Nestled in the heart of Dolton, this charmingly updated ranch home radiates warmth and is ready to welcome its new owners-why rent when you can own this delightful gem? Buy this home with confidence! Your new home comes with a 13 month WARRANTY! Also, with an acceptable offer, our seller is willing to help buy down your interest rate and lower your expenses, or give you a credit towards your closing costs! Bathed in natural light, t
Key facts
- Fenced yard
- Remodeled bathroom
- Stone countertops
Tags
Property features AI
Finance
- Other: Fee simple ownership; Property not currently leased; Possession at closing
- HOA & community: No master association fee required
Exterior
- Parking: Detached garage (2 garage spaces, 2 total parking spaces)
- Utilities: Public water; Public sewer; Electric with circuit breakers
- Home design: Detached single-family home; One-story
- Construction: Vinyl siding; Asphalt roof; Built 71–80 years ago; Built before 1978
- Exterior features: Fenced yard; Lot under 0.25 acre
Interior
- Kitchen: Granite counters; Eating area/table space; Solid surface counters; Range; Microwave; Dishwasher; Refrigerator
- Bedrooms: Master bedroom on main level (10 x 12); Bedroom on main level (10 x 10); Bedroom on main level (8 x 10)
- Flooring: Carpet
- Bathrooms: 1 full bathroom
- Heating & cooling: Natural gas forced-air heating; Central air conditioning
- Interior features: First-floor bedroom; First-floor full bathroom; Granite counters; Kitchen/dining combo; 6 total rooms
- Laundry & utility: Main-level laundry, in-unit (5 x 11)
Neighborhood map
What this means for you Summary
Snapshot
- This is a 3-bed/1.0-bath single-family listed at $170k.
Deal economics
- At list price, monthly cash flow is $614 ($7k/yr) — positive.
- The deal already cash-flows at list — no discount required.
- Meets the 1% rule at list price ($2k rent vs $170k).
Location & tenants
- Location reads 74/100 on livability (#263 in IL, #4,883 nationally) — a middle-class / working-renter tenant base. Strengths: commute A+, cost of living A+, housing A+; Watch: employment C-, health & safety C-, crime D-.
- Thornton Twp Hsd 205 (suburban): math 7% / reading 8% proficiency, ranked #594 of 620 in IL (top 96%) — low school quality limits family demand, transient renter base, plan for 1-2y turnover.
- Zoned schools: Thornridge High School (math 8% / reading 8%, grade F, #589 of 693 statewide, top 86%, 1,057 students, 0% FRL).
- Market conditions: Rents rising fast (+9.7%/yr); 130 active listings in the ZIP; 14 comparable units currently listed for rent nearby; rentals leasing fast (median 14d on market — plan ~1-2 weeks tenant-placement turnaround); 6,272 units permitted in Cook County in 2024 (4,658 in 5+ unit buildings).
- This rent runs 43% of the median local income ($58k/yr) — at the standard rent-burdened threshold; future hikes will face affordability resistance.
Forward outlook
- Local home prices are declining (-3.0%/yr); year-one equity from $1k of loan paydown is wiped out by about $5k of value loss. Plan a longer hold.
- At projected returns (-3.0% appreciation + 8.0% rent growth), your $48k cash investment doubles in ~6 years — after that, you're playing with house money.
Negotiation context
- Only 9 days on market — expect competitive offers; lowballing is unlikely to land.
- 11 sale attempts since 3y ago; this cycle's ask has dropped $21k (11%) from the opening price — seller is motivated, your offer sets the floor, not the list.
- Current owner paid $102k; list at $170k implies a 66% gain — meaningful room to come down on a strong offer.
Risks & watch-outs
- Watch-outs: built in 1955 — expect roof / HVAC / electrical / plumbing capex.
Questions for the listing agent
- Built in 1955 — when were the roof, HVAC, electrical panel, plumbing, and water heater last replaced?
- Is there a deadline driving the sale (1031 exchange, divorce, estate, relocation)? That informs how much negotiation room exists.
- Schools are F-rated, which usually means shorter tenancies and higher turnover. Who's the typical renter profile here, and what's been the actual vacancy rate?
- Crime grade is D in this area — have there been break-ins, vandalism, or insurance claims at this property in the last 3 years? What carrier currently insures it and at what premium?
- What's the average days-on-market for RENTAL listings here right now (not sales)? A rising rental-DOM trend means longer vacancies and softer asking-rent achievability than the comps imply.
- What's the recent tenant-quality profile in this submarket — average credit score on applications, eviction rate, late-payment / NSF rate, and stable-employment percentage? A property-management company in the area should have these aggregated.
- How much new for-sale + rental construction is in the pipeline within 1–3 miles? Heavy new supply typically softens prices + rents 12–24 months out; constrained supply supports both.
Investment metrics
- 1% rule
- 1.22% ✓
- Cap rate
- 10.63%
- Cash-on-cash
- 15.50%
- DSCR
- 1.69
- GRM
- 6.8
CMA / ARV
- ARV (on-the-fly)
- $133,182
- Comps found
- 11
Show comp detail 11 sales within ~0.75 mi
| Address | Dist | Beds/Ba | Sqft | Sold | Price | $/sf | Match |
|---|---|---|---|---|---|---|---|
| 15325 Dorchester Ave | 0.04mi | 3/1.0 | 909 (+0%) | 5mo | $123,649 | $136 | 93 |
| 15337 Dorchester Ave | 0.04mi | 3/1.5 | 925 (+2%) | 19mo | $180,000 | $195 | 77 |
| 15309 Blackstone Ave | 0.11mi | 2/1.5 (-1) | 1,008 (+11%) | 14mo | $177,000 | $176 | 58 |
| 1354 E 158th St | 0.49mi | 3/1.5 | 993 (+10%) | 6mo | $174,000 | $175 | 54 |
| 15722 Woodlawn East Ave | 0.57mi | 3/1.5 | 1,015 (+12%) | 1mo | $101,000 | $100 | 50 |
| 15634 Avalon Ave | 0.45mi | 4/1.5 (+1) | 1,029 (+14%) | 1mo | $115,000 | $112 | 48 |
| 14738 Blackstone Ave | 0.73mi | 3/1.0 | 1,017 (+12%) | 1mo | $150,000 | $147 | 45 |
| 15519 Ellis Ave | 0.58mi | 2/2.0 (-1) | 1,024 (+13%) | 4mo | $133,000 | $130 | 39 |
| 15511 Drexel Ave | 0.69mi | 3/2.0 | 1,008 (+11%) | 9mo | $165,000 | $164 | 38 |
| 14822 Dorchester Ave | 0.64mi | 3/1.0 | 989 (+9%) | 23mo | $105,000 | $106 | 36 |
| 15540 Drexel Ave | 0.75mi | 4/2.0 (+1) | 1,008 (+11%) | 14mo | $205,000 | $203 | 26 |
Match score weights: distance 35% · size 25% · config 20% · recency 20%. Top-matched comps best support the ARV.
Projected returns pro-forma
-3.0% appreciation · 8.0% rent growth · sell at horizon
- IRR
- 11.3%
- Equity multiple
- 1.47×
- Total profit
- $22,452
- Equity at exit
- $25,318
- IRR
- 23.8%
- Equity multiple
- 3.51×
- Total profit
- $119,372
- Equity at exit
- $14,681
Cash invested: $47,544 (down + closing). Projections, not guarantees.
Landlord ↔ Tenant lean methodology
- Overall (STATE)
- 43 Moderately Tenant-Leaning
- State Illinois
- 43 Moderately Tenant-Leaning · D+7
- County
- — inherits STATE
- City
- — inherits STATE
ZIP-level market 60419
- Home prices YoY
- -25.7%
- Rents YoY
- 9.7%
- Active inventory
- 130
- Price-to-rent
- 6.8×
Monthly cashflow live
- Estimated rent
- $2,067 high interval (Pro) →
- Mortgage (P&I)
- −$890
- Tax from tax record
- −$58 /mo · $695/yr
- Insurance
- −$71
- HOA
- −$0
- Vacancy / Maint / Mgmt
- −$434
- Net cashflow
- $614
Break-even live
UW: 25.0% down · 7.5% · 30yr · 1.5% tax · 5.0% vac · 8.0% maint · 8.0% mgmt
Financing live
Cash to close
- Down payment
- $42,450
- Closing costs
- $5,094
- Reserves months
- —
- Total cash needed
- —
Loan-product check · same deal, 3 products live
Conventional
25% down · 7.5% · 30yr
- Down + closing
- —
- Monthly P&I
- —
- Monthly cashflow
- —
- DSCR
- —
- Eligible?
- —
Personal DTI + credit; lowest rate.
DSCR
20% down · 8.5% · 30yr
- Down + closing
- —
- Monthly P&I
- —
- Monthly cashflow
- —
- DSCR
- —
- Eligible?
- —
No personal income docs; deal must DSCR.
Hard money
10% down · 12.0% · 12mo
- Down + closing
- —
- Monthly P&I
- —
- Monthly cashflow
- —
- DSCR
- —
- Eligible?
- —
Short-term bridge; refi at stabilization.
Rent comps 14 comps
| Address | Beds | Baths | Sqft | Rent | $/sqft | DOM | Units | Dist |
|---|---|---|---|---|---|---|---|---|
| 14738 Blackstone Ave Dolton, IL | 3.0 | 1.0 | 1017 | $2,400 | $2.36 | 10d | 1 | 0.74mi |
| 405 Clyde Ave Calumet City, IL | 3.0 | 1.0 | 973 | $2,300 | $2.36 | 1d | 1 | 0.85mi |
| 14610 Blackstone Ave Dolton, IL | 3.0 | 1.0 | 1017 | $2,400 | $2.36 | 6d | 1 | 0.93mi |
| 1860 State St Calumet City, IL | 3.0 | 1.0 | 1100 | $1,800 | $1.64 | 17d | 1 | 1.14mi |
| 14817 Champlain Ave Dolton, IL | 2.0 | 1.0 | 980 | $2,430 | $2.48 | 22d | 1 | 1.19mi |
| 460 Hoxie Ave Unit R Calumet City, IL | 2.0 | 1.0 | 800 | $1,650 | $2.06 | 13d | 1 | 1.22mi |
| 460 Hoxie Ave Unit R Calumet City, IL | 2.0 | 1.0 | 800 | $1,650 | $2.06 | 7d | 1 | 1.22mi |
| 15238 Doctor Martin Luther King Junior Dr Unit 2W Dolton, IL | 2.0 | 1.0 | 800 | $1,500 | $1.88 | 10d | 1 | 1.34mi |
| 250 Yates Ave Unit 1616 Dolton 1E Calumet City, IL | 2.0 | 1.0 | 875 | $1,465 | $1.67 | 7d | 1 | 1.35mi |
| 14500 Cottage Grove Ave Unit 3 Dolton, IL | 2.0 | 1.0 | 1000 | $1,475 | $1.48 | 24d | 1 | 1.39mi |
| 1601 Downs Dr Unit 3S Calumet City, IL | 2.0 | 1.0 | 750 | $1,400 | $1.87 | 24d | 1 | 1.41mi |
| 101 Oglesby Ave Calumet City, IL | 2.0 | 1.0 | 1100 | $1,800 | $1.64 | 12d | 1 | 1.41mi |
| 101 Oglesby Ave Calumet City, IL | 2.0 | 1.0 | 1000 | $1,800 | $1.80 | 22d | 1 | 1.41mi |
| 101 Oglesby Ave Calumet City, IL | 2.0 | 1.0 | 1000 | $1,800 | $1.80 | 19d | 1 | 1.41mi |
Listing history 50 events
-
2026-06-18days on market $169,800 Active 9 DOM
-
2026-06-17days on market $169,800 Active 8 DOM
-
2026-06-16days on market $169,800 Active 7 DOM
-
2026-06-15days on market $169,800 Active 6 DOM
-
2026-06-13days on market $169,800 Active 4 DOM
-
2026-06-13days on market $169,800 Active 3 DOM
-
2026-06-10days on market $169,800 Active 1 DOM
-
2026-06-09days on market $169,800 Active 97 DOM
-
2026-06-08days on market $169,800 Active 96 DOM
-
2026-06-07days on market $169,800 Active 95 DOM
-
2026-06-04days on market $169,800 Active 92 DOM
-
2026-06-03days on market $169,800 Active 91 DOM
-
2026-06-02days on market $169,800 Active 90 DOM
-
2026-06-01days on market $169,800 Active 89 DOM
-
2026-05-31days on market $169,800 Active 88 DOM
-
2026-05-16price $169,800
-
2026-05-09price $175,800
-
2026-04-14price $179,800
-
2026-04-03price $184,800
-
2026-03-21price $187,500
-
2026-03-04$190,800 Active
-
2026-03-04historical
-
2026-02-18price
-
2026-01-07Active
-
2026-01-07historical
-
2025-10-27price
-
2025-10-17Active
-
2025-10-17historical
-
2025-09-15price
-
2025-09-04Active
-
2025-09-04historical
-
2025-08-08Active
-
2025-06-17soldstatus $102,500
-
2025-06-11soldstatus $102,205 Closed
-
2025-05-15historical Contingent - Continue to Show
-
2025-04-10status Active
-
2025-04-02historical Contingent - Continue to Show
-
2025-03-11$110,000 Active
-
2024-10-08historical
-
2024-09-03Active
-
2024-08-05historical
-
2023-07-06price
-
2023-07-05status Active
-
2023-06-30historical
-
2023-04-25status Active
-
2023-04-25price
-
2023-04-20historical
-
2023-04-03price
-
2023-01-20Auction
-
1996-06-24soldstatus $55,000
ⓘ Source: listings_history table (triggers on properties + properties_extension) + one-shot
backfill from property_details.listing_events for pre-trigger history.
Tax reassessment forecast IL · Partial reset (capped growth)
- Current annual tax
- $695 · $58/mo
- Projected year-2 tax
- $2,275 · $190/mo
- Expected delta
- +$1,580/yr (+$132/mo · 227.2%)
ⓘ Screening estimate from a state-policy table — verify with the county assessor before closing.
Climate risk First Street
- Flood 1/10 Low FEMA zone X (unshaded) · 0% chance over 30 yrs
- Wildfire 1/10 Low
- Heat 3/10 Moderate 7 d/yr ≥101°F today · 15 d/yr by 30 yrs out
- Wind 2/10 Low
- Air quality 4/10 Moderate 4 unhealthy d/yr today · 5 by 30 yrs out
Nearby sold comps map
Loading sold comps map…
Walkable amenities ~0.75 mi
Loading nearby amenities…
Taxation est. · year 1
- Rental income
- $24,807
- − Mortgage interest
- −$9,511
- − Property taxes
- −$695
- − Insurance
- −$849
- − Repairs & maintenance
- −$1,985
- − Management
- −$1,985
- − Depreciation
- −$4,940
- Taxable income
- $4,843
- Est. tax owed @ 24.0%
- −$1,162
- After-tax cash flow
- $6,206/yr
For passive investors: Depreciation is non-cash, so a rental often shows a tax loss while cash-flowing — sheltering income. Rental losses are passive: they offset passive income freely, and up to $25,000/yr can offset ordinary (W-2) income if you actively participate and your MAGI is under $100k (phasing out to $0 by $150k); unused losses carry forward. On sale, claimed depreciation is recaptured at up to 25%, and gains may owe capital-gains tax (a 1031 exchange can defer both). Figures are a year-1 estimate at your 24.0% rate — not tax advice; consult a CPA.
Schools (NCES district)
- District
- Thornton Twp Hsd 205
- NCES district ID
- 1738970
- Math proficiency
- 7% ▬ 0.00%
- Reading proficiency
- 8% ▼ -2.00%
- Median HH income
- $43,392
- Composite
- 6.92/100
- National rank
- #9976
- State rank
- #594 of 620 in IL
Livability — Dolton
- Score
- 74/100
- State rank
- #263
- US rank
- #4883
Category grades
Schools grade is shown separately in the Schools card above.
Census & demographics
- Census place
- Dolton, IL
- County
- Cook County · 4,486,803 people
- City population
- 20,825
- Metro
- Chicago-Naperville-Elgin, IL-IN-WI
- Population (ZIP)
- 20,825
- Household income
- $57,887
- Rent vs Own
- Severe rent burden
- 919.0
Population outlook (Cook County) Hauer SSP2
- Today (2025)
- 5,347,519 people
- By 2030
- 5,357,703 · +0.2%
- By 2040
- 5,324,924 · -0.4%
- By 2050
- 5,230,762 · -2.2%
- By 2075
- 4,785,735 · -10.5%
- By 2100
- 4,188,836 · -21.7%
Race, ethnicity, and origin ACS 2023
- Neighborhood character
- Predominantly Black (91%)
- Race & ethnicity
- Black 91% White 4% Two or more races 3% Hispanic / Latino 1%
- Common ancestry
- Romanian 1% Hispanic 1%
- Foreign-born
- 3% · Canada
- Languages at home
- 95% English-only · French/Haitian/Cajun 2% Spanish 1%
Political lean MEDSL · Cook
- 2024 margin
- Solid D (+42.0) · D 70.4% · R 28.4% · Other 1.2%
- 2008→2024 swing
- -11.4pp toward R · 2008: 53.4pp · 2024: 42.0pp
- All cycles
- 2024: D+42.0 2020: D+50.3 2016: D+53.0 2012: D+49.4 2008: D+53.4
Not yet ingested
- Civics
- —
Market trends
- HPI YoY
- ▼ -66.88%
- Current HPI
- 193.2346
- Rent YoY
- ▲ 9.65%
- Metro
- Chicago-Naperville-Elgin, IL-IN-WI
- State GDP YoY
- ▲ 1.59%
- F500 in state
- 60
Industry mix (Fortune 500 HQ in IL)
| Industry | F500 HQs | Revenue |
|---|---|---|
| Insurance | 4 | $201B |
|
||
| Consumer Goods | 4 | $87B |
|
||
| Industrial Machinery | 3 | $64B |
|
||
| Healthcare | 2 | $55B |
|
||
| Retail / Pharmacy | 1 | $148B |
|
||
| Agriculture / Food | 1 | $86B |
|
||
Price history
+208.7% since first listed35 events — show timeline
- 2026-05-16 Price Changed $169,800 MRED as Distributed by MLS Grid
- 2026-05-09 Price Changed $175,800 MRED as Distributed by MLS Grid
- 2026-04-14 Price Changed $179,800 MRED as Distributed by MLS Grid
- 2026-04-03 Price Changed $184,800 MRED as Distributed by MLS Grid
- 2026-03-21 Price Changed $187,500 MRED as Distributed by MLS Grid
- 2026-03-04 Listing Removed — MRED as Distributed by MLS Grid
- 2026-03-04 Listed $190,800 MRED as Distributed by MLS Grid
- 2026-02-18 Price Changed — MRED as Distributed by MLS Grid
- 2026-01-07 Listing Removed — MRED as Distributed by MLS Grid
- 2026-01-07 Listed — MRED as Distributed by MLS Grid
- 2025-10-27 Price Changed — MRED as Distributed by MLS Grid
- 2025-10-17 Listing Removed — MRED as Distributed by MLS Grid
- 2025-10-17 Listed — MRED as Distributed by MLS Grid
- 2025-09-15 Price Changed — MRED as Distributed by MLS Grid
- 2025-09-04 Listing Removed — MRED as Distributed by MLS Grid
- 2025-09-04 Listed — MRED as Distributed by MLS Grid
- 2025-08-08 Listed — MRED as Distributed by MLS Grid
- 2025-06-17 Sold (Public Records) $102,500 Public Records
- 2025-06-11 Sold (MLS) $102,205 MRED as Distributed by MLS Grid
- 2025-05-15 Contingent — MRED as Distributed by MLS Grid
- 2025-04-10 Relisted — MRED as Distributed by MLS Grid
- 2025-04-02 Contingent — MRED as Distributed by MLS Grid
- 2025-03-11 Listed $110,000 MRED as Distributed by MLS Grid
- 2024-10-08 Listing Removed — MRED as Distributed by MLS Grid
- 2024-09-03 Listed — MRED as Distributed by MLS Grid
- 2024-08-05 Listing Removed — MRED as Distributed by MLS Grid
- 2023-07-06 Price Changed — MRED as Distributed by MLS Grid
- 2023-07-05 Relisted — MRED as Distributed by MLS Grid
- 2023-06-30 Listing Removed — MRED as Distributed by MLS Grid
- 2023-04-25 Relisted — MRED as Distributed by MLS Grid
- 2023-04-25 Price Changed — MRED as Distributed by MLS Grid
- 2023-04-20 Listing Removed — MRED as Distributed by MLS Grid
- 2023-04-03 Price Changed — MRED as Distributed by MLS Grid
- 2023-01-20 Listed — MRED as Distributed by MLS Grid
- 1996-06-24 Sold (Public Records) $55,000 Public Records
Property tax history
-6.9%/yrLatest (2023): $695 · +323.0% YoY. Source: county tax records.
Cash-flow waterfall
monthlySold comps — $/sqft
last 12 mo · ≤1 miLoading sold comps…