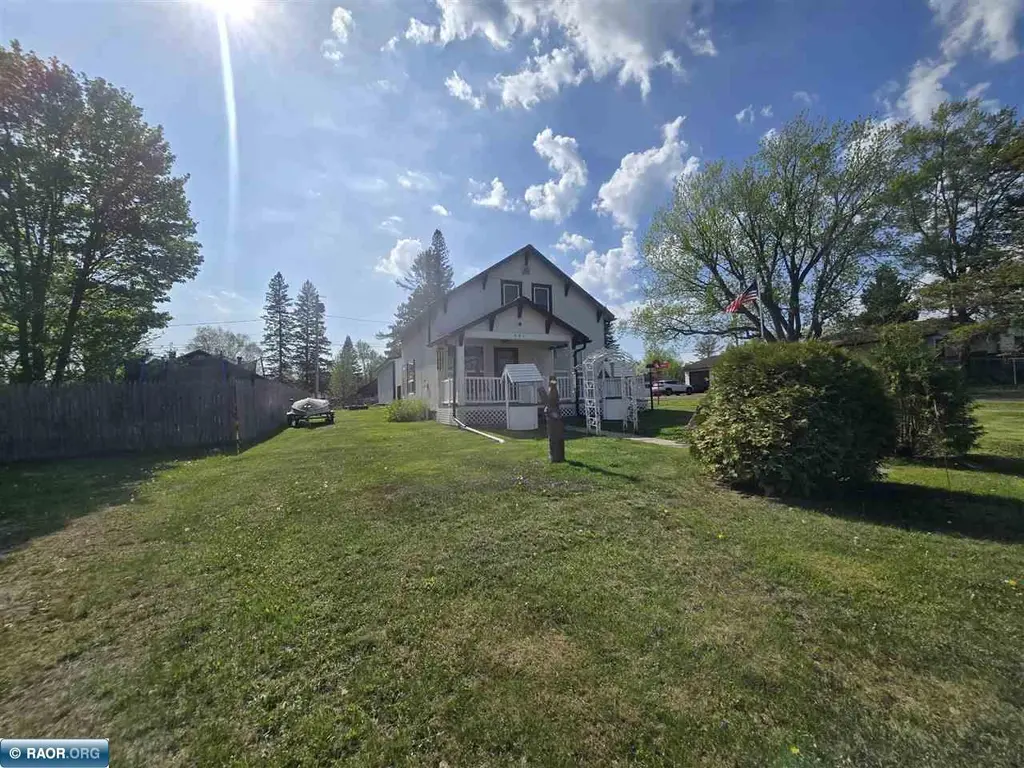
401 Center Ave · Hibbing, MN
Flood risk 1/10 · Minimal
- FEMA flood zone
- —
- Chance of flooding over 30 yrs
- 0.0%
- Est. flood insurance / yr
- —
Fire risk 5/10 · Moderate
- Est. fire insurance / yr
- $888 – $1,650
Heat risk 1/10 · Minimal
- Hot days now (above 91°F)
- 7 days/yr
- Hot days in 30 yrs
- 12 days/yr
Wind risk 1/10 · Minimal
- Chance of severe wind over 30 yrs
- —
Air-quality risk 2/10 · Minimal
- Unhealthy air days now
- 1 days/yr
- Unhealthy air days in 30 yrs
- 1 days/yr
Risk factors via First Street. Map © Google.
Why this score? — see what drove the C- grade
The composite is a weighted blend of 9 inputs, each scored 0–100. Each bar is that input's sub-score; the figure is the points it added to the 100-point composite (weight × sub-score).
- Cash flow +24.8/30.0
- DSCR +8.1/10.0
- 1% rule +5.3/10.0
- Schools +4.1/10.0
- Livability +4.0/5.0
- Rent growth +2.5/5.0
- Condition / age +2.5/5.0
- ARV discount +0.0/15.0
- Appreciation +0.0/10.0
$150,000
🖨 Deal sheet 📄 Offer letter ✓ Due diligence
Listing remarks MLS
Come sit on the porch and enjoy the view from this manicured corner lot. Spacious living room dining with open concept & fireplace. Kitchen has ample storage. 3 bedroom home. Landscaped with perrenals Metal roof. 30x30 garage with insulated doors. Short walk to the Kelly Lake beach.
Key facts
- Well manicured lawn
- Dining room area
- Front porch
Tags
Property features AI
Exterior
- Parking: 3-car garage
- Utilities: Public water; Public sewer
- Home design: Single-family residence; 2 stories
- Construction: Frame and stucco construction
- Exterior features: Covered porch; Partial fencing; Metal roof
Interior
- Kitchen: Gas range; Refrigerator
- Heating & cooling: Forced-air heating; Natural gas
- Interior features: Gas-log fireplace; Full basement
- Laundry & utility: Washer; Dryer; Electric dryer hookup; Electric water heater
Neighborhood map
What this means for you Summary
Snapshot
- This is a 3-bed/1.0-bath single-family listed at $150k.
Deal economics
- At list price, monthly cash flow is $319 ($4k/yr) — positive.
- The deal already cash-flows at list — no discount required.
- Meets the 1% rule at list price ($2k rent vs $150k).
- Recommended offer: $148k (1.5% below list) — sets the bar for market timing.
- Cap rate 8.8% vs local median 6.4% in Hibbing — top-decile yield for the area; either an underpriced asset or a hidden risk that comps aren't pricing in. Stress-test before assuming the spread holds.
Location & tenants
- Location reads 79/100 on livability (#103 in MN, #2,307 nationally) — a middle-class / working-renter tenant base. Strengths: crime A+, cost of living A+, housing A+; Watch: employment D+, amenities F, commute F.
- Hibbing Public School District (town): math 43% / reading 54% proficiency, ranked #150 of 301 in MN (top 50%) — families likely to look elsewhere, expect single-tenant / working-renter base with shorter leases.
- Market conditions: 96 active listings in the ZIP; 639 units permitted in St. Louis County in 2024 (338 in 5+ unit buildings).
- This rent runs 33% of the median local income ($56k/yr) — at the standard rent-burdened threshold; future hikes will face affordability resistance.
Forward outlook
- Local home prices are declining (-3.0%/yr); year-one equity from $1k of loan paydown is wiped out by about $4k of value loss. Plan a longer hold.
Negotiation context
- It's been on market 22 days — a 2% lower offer ($148k) is reasonable based on typical stale-listing flexibility.
- 3 sale attempts since 9y ago with the ask held roughly flat each time — persistent listings suggest the price (not the market) is what's stuck; bring a comps-based counter.
- Current owner paid $96k; list at $150k implies a 56% gain — meaningful room to come down on a strong offer.
Risks & watch-outs
- Watch-outs: built in 1930 — expect roof / HVAC / electrical / plumbing capex.
- Climate carrying-cost: moderate wildfire risk — expect insurance premiums to compound above CPI over the hold.
Questions for the listing agent
- Built in 1930 — when were the roof, HVAC, electrical panel, plumbing, and water heater last replaced?
- Is there a deadline driving the sale (1031 exchange, divorce, estate, relocation)? That informs how much negotiation room exists.
- Schools are A-rated — typically a magnet for longer-tenancy family renters. What's the average tenant stay here, and is there a school-zone premium baked into asking?
- What's the average days-on-market for RENTAL listings here right now (not sales)? A rising rental-DOM trend means longer vacancies and softer asking-rent achievability than the comps imply.
- What's the recent tenant-quality profile in this submarket — average credit score on applications, eviction rate, late-payment / NSF rate, and stable-employment percentage? A property-management company in the area should have these aggregated.
- How much new for-sale + rental construction is in the pipeline within 1–3 miles? Heavy new supply typically softens prices + rents 12–24 months out; constrained supply supports both.
Investment metrics
- 1% rule
- 1.03% ✓
- Cap rate
- 8.84%
- Cash-on-cash
- 9.11%
- DSCR
- 1.41
- GRM
- 8.1
CMA / ARV
- ARV (on-the-fly)
- $102,600
- Comps found
- 2
Show comp detail 2 sales within ~0.75 mi
| Address | Dist | Beds/Ba | Sqft | Sold | Price | $/sf | Match |
|---|---|---|---|---|---|---|---|
| 303 W 1st St | 0.23mi | 2/1.0 (-1) | 1,086 (+1%) | 5mo | $101,000 | $93 | 79 |
| 310 N 1st Ave | 0.65mi | 2/1.0 (-1) | 996 (-8%) | 12mo | $95,000 | $95 | 42 |
Match score weights: distance 35% · size 25% · config 20% · recency 20%. Top-matched comps best support the ARV.
Projected returns pro-forma
-3.0% appreciation · 3.0% rent growth · sell at horizon
- IRR
- -2.6%
- Equity multiple
- 0.90×
- Total profit
- $-4,065
- Equity at exit
- $22,365
- IRR
- 7.1%
- Equity multiple
- 1.53×
- Total profit
- $22,360
- Equity at exit
- $12,969
Cash invested: $42,000 (down + closing). Projections, not guarantees.
Landlord ↔ Tenant lean methodology
- Overall (STATE)
- 46 Balanced
- State Minnesota
- 46 Balanced · D+2
- County
- — inherits STATE
- City
- — inherits STATE
ZIP-level market 55746
- Home prices YoY
- -18.7%
- Active inventory
- 96
- Price-to-rent
- 8.1×
Monthly cashflow live
- Estimated rent
- $1,546 medium interval (Pro) →
- Mortgage (P&I)
- −$787
- Tax from tax record
- −$53 /mo · $640/yr
- Insurance
- −$62
- HOA
- −$0
- Vacancy / Maint / Mgmt
- −$325
- Net cashflow
- $319
Break-even live
UW: 25.0% down · 7.5% · 30yr · 1.5% tax · 5.0% vac · 8.0% maint · 8.0% mgmt
Financing live
Cash to close
- Down payment
- $37,500
- Closing costs
- $4,500
- Reserves months
- —
- Total cash needed
- —
Loan-product check · same deal, 3 products live
Conventional
25% down · 7.5% · 30yr
- Down + closing
- —
- Monthly P&I
- —
- Monthly cashflow
- —
- DSCR
- —
- Eligible?
- —
Personal DTI + credit; lowest rate.
DSCR
20% down · 8.5% · 30yr
- Down + closing
- —
- Monthly P&I
- —
- Monthly cashflow
- —
- DSCR
- —
- Eligible?
- —
No personal income docs; deal must DSCR.
Hard money
10% down · 12.0% · 12mo
- Down + closing
- —
- Monthly P&I
- —
- Monthly cashflow
- —
- DSCR
- —
- Eligible?
- —
Short-term bridge; refi at stabilization.
Listing history 24 events
-
2026-06-19days on market $150,000 Active 22 DOM
-
2026-06-18days on market $150,000 Active 21 DOM
-
2026-06-17days on market $150,000 Active 20 DOM
-
2026-06-16days on market $150,000 Active 19 DOM
-
2026-06-15days on market $150,000 Active 18 DOM
-
2026-06-14days on market $150,000 Active 16 DOM
-
2026-06-13days on market $150,000 Active 15 DOM
-
2026-06-10days on market $150,000 Active 13 DOM
-
2026-06-09days on market $150,000 Active 12 DOM
-
2026-06-08days on market $150,000 Active 11 DOM
-
2026-06-07days on market $150,000 Active 10 DOM
-
2026-06-05days on market $150,000 Active 7 DOM
-
2026-06-03days on market $150,000 Active 6 DOM
-
2026-06-02days on market $150,000 Active 5 DOM
-
2026-06-01days on market $150,000 Active 4 DOM
-
2026-05-31days on market $150,000 Active 3 DOM
-
2026-05-30days on market $150,000 Active 2 DOM
-
2026-05-28$150,000 Active
-
2021-08-10soldstatus $96,000
-
2021-07-15soldstatus $96,000 290-char remark
Show marketing remark (290 chars)
Come sit on the porch and enjoy the view from this manicured corner lot. Spacious living room dining with open concept & fireplace. Kitchen has ample storage. 3 bedroom home. Landscaped with perrenals Metal roof. 30x30 garage with insulated doors. Short walk to the Kelly Lake beach.
-
2021-06-17$88,000 290-char remark
Show marketing remark (290 chars)
Come sit on the porch and enjoy the view from this manicured corner lot. Spacious living room dining with open concept & fireplace. Kitchen has ample storage. 3 bedroom home. Landscaped with perrenals Metal roof. 30x30 garage with insulated doors. Short walk to the Kelly Lake beach.
-
2017-09-14soldstatus $69,900
-
2017-08-04soldstatus $69,900 183-char remark
Show marketing remark (183 chars)
Well maintained home with manicured corner lot, newer 30' x 30' garage, front porch, metal roof, main floor bath with walk-in shower, 3 bedrooms on one level and clean inside and out!
-
2017-06-27$69,900 183-char remark
Show marketing remark (183 chars)
Well maintained home with manicured corner lot, newer 30' x 30' garage, front porch, metal roof, main floor bath with walk-in shower, 3 bedrooms on one level and clean inside and out!
ⓘ Source: listings_history table (triggers on properties + properties_extension) + one-shot
backfill from property_details.listing_events for pre-trigger history.
Tax reassessment forecast MN · Partial reset (capped growth)
- Current annual tax
- $640 · $53/mo
- Projected year-2 tax
- $1,160 · $97/mo
- Expected delta
- +$520/yr (+$43/mo · 81.2%)
ⓘ Screening estimate from a state-policy table — verify with the county assessor before closing.
Climate risk First Street
- Flood 1/10 Low 0% chance over 30 yrs
- Wildfire 5/10 Major
- Heat 1/10 Low 7 d/yr ≥91°F today · 12 d/yr by 30 yrs out
- Wind 1/10 Low
- Air quality 2/10 Low 1 unhealthy d/yr today · 1 by 30 yrs out
Nearby sold comps map
Loading sold comps map…
Walkable amenities ~0.75 mi
Loading nearby amenities…
Taxation est. · year 1
- Rental income
- $18,550
- − Mortgage interest
- −$8,402
- − Property taxes
- −$640
- − Insurance
- −$750
- − Repairs & maintenance
- −$1,484
- − Management
- −$1,484
- − Depreciation
- −$4,364
- Taxable income
- $1,426
- Est. tax owed @ 24.0%
- −$342
- After-tax cash flow
- $3,483/yr
For passive investors: Depreciation is non-cash, so a rental often shows a tax loss while cash-flowing — sheltering income. Rental losses are passive: they offset passive income freely, and up to $25,000/yr can offset ordinary (W-2) income if you actively participate and your MAGI is under $100k (phasing out to $0 by $150k); unused losses carry forward. On sale, claimed depreciation is recaptured at up to 25%, and gains may owe capital-gains tax (a 1031 exchange can defer both). Figures are a year-1 estimate at your 24.0% rate — not tax advice; consult a CPA.
Schools (NCES district)
- District
- Hibbing Public School District
- NCES district ID
- 2713980
- Math proficiency
- 43% ▼ -14.00%
- Reading proficiency
- 54% ▼ -13.00%
- Median HH income
- $41,666
- Composite
- 40.7/100
- National rank
- #3667
- State rank
- #150 of 301 in MN
Livability — Hibbing
- Score
- 79/100
- State rank
- #103
- US rank
- #2307
Category grades
Schools grade is shown separately in the Schools card above.
Census & demographics
- Census place
- Hibbing, MN
- County
- Saint Louis County · 115,152 people
- City population
- 16,730
- Metro
- Duluth, MN-WI
- Population (ZIP)
- 16,730
- Household income
- $55,823
- Rent vs Own
- Severe rent burden
- 623.0
Population outlook (St. Louis County) Hauer SSP2
- Today (2025)
- 202,411 people
- By 2030
- 203,234 · +0.4%
- By 2040
- 202,520 · +0.1%
- By 2050
- 200,853 · -0.8%
- By 2075
- 200,943 · -0.7%
- By 2100
- 192,058 · -5.1%
Race, ethnicity, and origin ACS 2023
- Neighborhood character
- Predominantly White (93%)
- Race & ethnicity
- White 93% Two or more races 4% Black 2% Hispanic / Latino 2%
- Common ancestry
- Portuguese 10% Lithuanian 2% Romanian 2%
- Foreign-born
- 2% · Canada
- Languages at home
- 96% English-only · Spanish 1% German/W. Germanic 1%
Political lean MEDSL · St. Louis
- 2024 margin
- D (+13.7) · D 55.9% · R 42.2% · Other 1.8%
- 2008→2024 swing
- -18.8pp toward R · 2008: 32.5pp · 2024: 13.7pp
- All cycles
- 2024: D+13.7 2020: D+15.6 2016: D+11.8 2012: D+29.6 2008: D+32.5
Not yet ingested
- Civics
- —
Market trends
- HPI YoY
- ▼ -50.85%
- Current HPI
- 220.7198
- Rent YoY
- —
- Metro
- Duluth, MN-WI
- State GDP YoY
- ▲ 2.41%
- F500 in state
- 34
Industry mix (Fortune 500 HQ in MN)
| Industry | F500 HQs | Revenue |
|---|---|---|
| Healthcare | 2 | $407B |
|
||
| Retail | 2 | $150B |
|
||
| Consumer Goods | 2 | $32B |
|
||
| Industrial Machinery | 2 | $6B |
|
||
| Agriculture | 1 | $40B |
|
||
| Healthcare / Medical Devices | 1 | $32B |
|
||
Price history
+114.6% since first listed7 events — show timeline
- 2026-05-28 Listed $150,000 RAOR
- 2021-08-10 Sold (Public Records) $96,000 Public Records
- 2021-07-15 Sold (MLS) $96,000 RAOR
- 2021-06-17 Listed $88,000 RAOR
- 2017-09-14 Sold (Public Records) $69,900 Public Records
- 2017-08-04 Sold (MLS) $69,900 RAOR
- 2017-06-27 Listed $69,900 RAOR
Property tax history
+15.2%/yrLatest (2025): $640 · -46.3% YoY. Source: county tax records.
Cash-flow waterfall
monthlySold comps — $/sqft
last 12 mo · ≤1 miLoading sold comps…