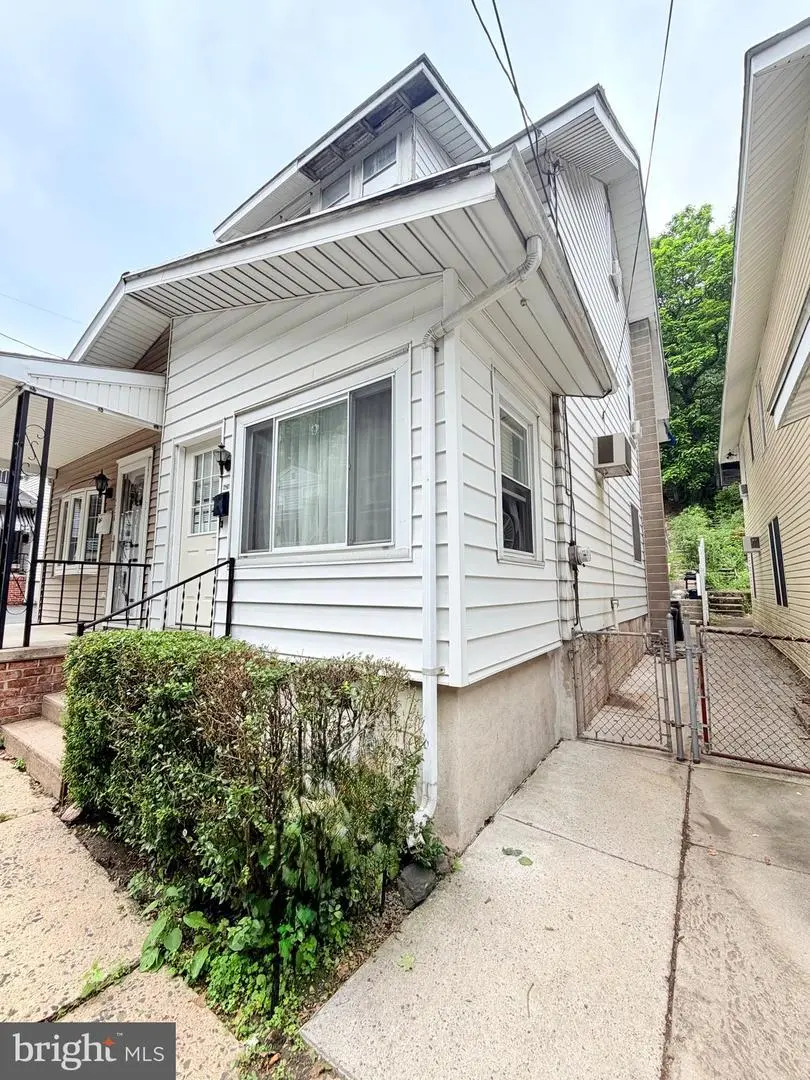
428 Laurel St · Minersville, PA
Flood risk 9/10 · Severe
- FEMA flood zone
- X (unshaded)
- Chance of flooding over 30 yrs
- 0.99%
- Est. flood insurance / yr
- $473 – $860
Fire risk 1/10 · Minimal
- Est. fire insurance / yr
- $511 – $949
Heat risk 4/10 · Minor
- Hot days now (above 95°F)
- 7 days/yr
- Hot days in 30 yrs
- 15 days/yr
Wind risk 4/10 · Minor
- Chance of severe wind over 30 yrs
- 8.0%
Air-quality risk 2/10 · Minimal
- Unhealthy air days now
- 1 days/yr
- Unhealthy air days in 30 yrs
- 3 days/yr
Risk factors via First Street. Map © Google.
Why this score? — see what drove the A- grade
The composite is a weighted blend of 9 inputs, each scored 0–100. Each bar is that input's sub-score; the figure is the points it added to the 100-point composite (weight × sub-score).
- Cash flow +30.0/30.0
- ARV discount +15.0/15.0
- 1% rule +10.0/10.0
- DSCR +10.0/10.0
- Appreciation +7.3/10.0
- Livability +3.5/5.0
- Schools +3.0/10.0
- Rent growth +2.5/5.0
- Condition / age +2.5/5.0
$45,000
🖨 Deal sheet (PDF) 📄 Offer letter ✓ Due diligence
Listing remarks
Attention investors and bargain hunters! This spacious 4 bedroom, 1 bath home offers oversized rooms, a functional layout, and endless potential. While it could use some updates and TLC, it's currently livable and ready for your vision. Featuring a small backyard, plenty of interior space, and a price designed to move quickly, this is an excellent opportunity for an investor, flipper, or handy homeowner looking to build equity. Don't wait, opportunities like this don't last long! SOLD AS IS.
Key facts
- Built 1920
Property features AI
Exterior
- Parking: On-street parking
- Utilities: Public water; Public sewer
- Home design: Semi-detached property; Estimated year built
- Construction: Aluminum siding exterior; Block foundation; Above-grade and below-grade structures noted
- Exterior features: Lot dimensions approximately 15 x 123 feet; Not in a federal flood zone
Interior
- Bedrooms: Three bedrooms on the first upper level; One bedroom on the second upper level
- Bathrooms: One full bathroom (total)
- Heating & cooling: Baseboard hot water heating; Oil-fired heating and hot water
- Interior features: Estimated living area; Full basement
Neighborhood map
What this means for you Summary
Snapshot
- This is a 3-bed/1.0-bath townhouse listed at $45k.
Deal economics
- At list price, monthly cash flow is $542 ($7k/yr) — positive.
- The deal already cash-flows at list — no discount required.
- Meets the 1% rule at list price ($1k rent vs $45k).
- Cap rate 22.2% vs local median 8.0% in Minersville — top-decile yield for the area; either an underpriced asset or a hidden risk that comps aren't pricing in. Stress-test before assuming the spread holds.
Location & tenants
- Location reads 70/100 on livability (#742 in PA) — a middle-class / working-renter tenant base. Strengths: cost of living A+, health & safety A+, crime A; Watch: commute F, employment F.
- Minersville Area SD (town): math 21% / reading 50% proficiency, ranked #420 of 539 in PA (top 78%) — families likely to look elsewhere, expect single-tenant / working-renter base with shorter leases.
- Zoned schools: Minersville Area Jshs (math 17% / reading 42%, grade F, #349 of 437 statewide, top 81%, 527 students, 96% FRL) — zoned schools average 96% FRL vs 39% district-wide (56 pts higher); higher-poverty schools than district average — tighter screening recommended.
- Market conditions: 38 active listings in the ZIP; 1 comparable units currently listed for rent nearby; 169 units permitted in Schuylkill County in 2024 (0 in 5+ unit buildings).
Forward outlook
- In year one you build about $2k of equity ($311 loan paydown + $2k appreciation (4.7% local appreciation)).
- Schuylkill County population projected at -16% by 2050 — secular population decline; favor cash flow + early exit over multi-decade hold.
- At projected returns (4.7% appreciation + 3.0% rent growth), your $13k cash investment doubles in ~2 years — after that, you're playing with house money.
Negotiation context
- Only 1 days on market — expect competitive offers; lowballing is unlikely to land.
Risks & watch-outs
- Watch-outs: flood insurance adds $56/mo; built in 1920 — expect roof / HVAC / electrical / plumbing capex.
- Climate carrying-cost: severe flood risk — expect insurance premiums to compound above CPI over the hold.
Questions for the listing agent
- Built in 1920 — when were the roof, HVAC, electrical panel, plumbing, and water heater last replaced?
- What's the actual annual flood-insurance premium (NFIP or private), and is the property in a SFHA with mandatory coverage?
- Is there a deadline driving the sale (1031 exchange, divorce, estate, relocation)? That informs how much negotiation room exists.
- What's the average days-on-market for RENTAL listings here right now (not sales)? A rising rental-DOM trend means longer vacancies and softer asking-rent achievability than the comps imply.
- What's the recent tenant-quality profile in this submarket — average credit score on applications, eviction rate, late-payment / NSF rate, and stable-employment percentage? A property-management company in the area should have these aggregated.
- How much new for-sale + rental construction is in the pipeline within 1–3 miles? Heavy new supply typically softens prices + rents 12–24 months out; constrained supply supports both.
Investment metrics
- 1% rule
- 2.56% ✓
- Cap rate
- 22.23%
- Cash-on-cash
- 56.91%
- DSCR
- 3.53
- GRM
- 3.3
CMA / ARV
- ARV (on-the-fly)
- $68,172
- Comps found
- 12
Show comp detail 12 sales within ~0.75 mi
| Address | Dist | Beds/Ba | Sqft | Sold | Price | $/sf | Match |
|---|---|---|---|---|---|---|---|
| 528 Lytle St | 0.17mi | 3/1.0 | 1,176 (-2%) | 4mo | $120,000 | $102 | 86 |
| 206 Oak St | 0.19mi | 3/1.0 | 1,200 (+0%) | 10mo | $82,500 | $69 | 82 |
| 444 Lewis St | 0.37mi | 3/1.0 | 1,158 (-3%) | 4mo | $45,000 | $39 | 74 |
| 651 Pine Hill St | 0.20mi | 4/1.0 (+1) | 1,176 (-2%) | 13mo | $106,900 | $91 | 72 |
| 141 Carbon St | 0.42mi | 3/1.0 | 1,163 (-3%) | 5mo | $42,000 | $36 | 72 |
| 309 Laurel St | 0.11mi | 3/1.0 | 1,308 (+9%) | 13mo | $139,900 | $107 | 68 |
| 115 S 3rd St | 0.21mi | 3/1.0 | 1,350 (+13%) | 1mo | $32,500 | $24 | 68 |
| 513 Pottsville | 0.23mi | 2/1.0 (-1) | 1,150 (-4%) | 11mo | $45,000 | $39 | 68 |
| 200 Oak St | 0.20mi | 3/2.0 | 1,148 (-4%) | 15mo | $65,000 | $57 | 68 |
| 220 North St | 0.39mi | 3/1.0 | 1,100 (-8%) | 6mo | $93,000 | $85 | 63 |
| 428 North St | 0.40mi | 3/1.5 | 1,307 (+9%) | 6mo | $46,500 | $36 | 59 |
| 325 New Castle St | 0.47mi | 3/1.0 | 1,320 (+10%) | 2mo | $68,000 | $52 | 59 |
Match score weights: distance 35% · size 25% · config 20% · recency 20%. Top-matched comps best support the ARV.
Projected returns pro-forma
4.65% appreciation · 3.0% rent growth · sell at horizon
- IRR
- 58.7%
- Equity multiple
- 4.50×
- Total profit
- $44,052
- Equity at exit
- $24,554
- IRR
- 56.8%
- Equity multiple
- 9.24×
- Total profit
- $103,870
- Equity at exit
- $41,613
Cash invested: $12,600 (down + closing). Projections, not guarantees.
Landlord ↔ Tenant lean methodology
- Overall (STATE)
- 62 Landlord-Friendly
- State Pennsylvania
- 62 Landlord-Friendly · EVEN
- County
- — inherits STATE
- City
- — inherits STATE
ZIP-level market 17954
- Home prices YoY
- 2.3%
- Active inventory
- 38
- Price-to-rent
- 3.3×
Monthly cashflow live
- Estimated rent
- $1,150 medium interval (Pro) →
- Mortgage (P&I)
- −$236
- Tax est. 1.5%
- −$56 /mo · $675/yr
- Insurance
- −$19
- Flood insurance flood zone
- −$56 /mo · $666/yr
- HOA
- −$0
- Vacancy / Maint / Mgmt
- −$242
- Net cashflow
- $542
Break-even live
Sensitivity live
| Price | -10% $573 | -5% $558 | +0% $542 | +5% $526 | +10% $511 |
|---|---|---|---|---|---|
| Rent | -10% $451 | -5% $497 | +0% $542 | +5% $587 | +10% $633 |
| Rate | -1.0pp $565 | -0.5pp $553 | base $542 | +0.5pp $530 | +1.0pp $518 |
UW: 25.0% down · 7.5% · 30yr · 1.5% tax · 5.0% vac · 8.0% maint · 8.0% mgmt
Financing live
Cash to close
- Down payment
- $11,250
- Closing costs
- $1,350
- Reserves months
- —
- Total cash needed
- —
Loan-product check · same deal, 3 products live
Conventional
25% down · 7.5% · 30yr
- Down + closing
- —
- Monthly P&I
- —
- Monthly cashflow
- —
- DSCR
- —
- Eligible?
- —
Personal DTI + credit; lowest rate.
DSCR
20% down · 8.5% · 30yr
- Down + closing
- —
- Monthly P&I
- —
- Monthly cashflow
- —
- DSCR
- —
- Eligible?
- —
No personal income docs; deal must DSCR.
Hard money
10% down · 12.0% · 12mo
- Down + closing
- —
- Monthly P&I
- —
- Monthly cashflow
- —
- DSCR
- —
- Eligible?
- —
Short-term bridge; refi at stabilization.
Rent comps 1 comps
| Address | Beds | Baths | Sqft | Rent | $/sqft | DOM | Units | Dist |
|---|---|---|---|---|---|---|---|---|
| 504 Laurel St Minersville, PA | 3.0 | 2.0 | 1059 | $1,150 | $1.09 | 44d | 1 | 0.04mi |
Listing history 2 events
-
2026-06-12remarks 496-char remark
-
2026-06-12$45,000 Pending 1 DOM
ⓘ Source: listings_history table (triggers on properties + properties_extension) + one-shot
backfill from property_details.listing_events for pre-trigger history.
Climate risk First Street
- Flood 9/10 Extreme FEMA zone X (unshaded) · 99% chance over 30 yrs
- Wildfire 1/10 Low
- Heat 4/10 Moderate 7 d/yr ≥95°F today · 15 d/yr by 30 yrs out
- Wind 4/10 Moderate 8% chance of damaging wind over 30 yrs
- Air quality 2/10 Low 1 unhealthy d/yr today · 3 by 30 yrs out
Nearby sold comps map
Loading sold comps map…
Walkable amenities ~0.75 mi
Loading nearby amenities…
Taxation est. · year 1
- Rental income
- $13,800
- − Mortgage interest
- −$2,521
- − Property taxes
- −$675
- − Insurance
- −$891
- − Repairs & maintenance
- −$1,104
- − Management
- −$1,104
- − Depreciation
- −$1,309
- Taxable income
- $6,196
- Est. tax owed @ 24.0%
- −$1,487
- After-tax cash flow
- $5,017/yr
For passive investors: Depreciation is non-cash, so a rental often shows a tax loss while cash-flowing — sheltering income. Rental losses are passive: they offset passive income freely, and up to $25,000/yr can offset ordinary (W-2) income if you actively participate and your MAGI is under $100k (phasing out to $0 by $150k); unused losses carry forward. On sale, claimed depreciation is recaptured at up to 25%, and gains may owe capital-gains tax (a 1031 exchange can defer both). Figures are a year-1 estimate at your 24.0% rate — not tax advice; consult a CPA.
Schools (NCES district)
- District
- Minersville Area SD
- NCES district ID
- 4215510
- Math proficiency
- 21% ▼ -12.00%
- Reading proficiency
- 50% ▼ -8.00%
- Median HH income
- $40,865
- Composite
- 29.77/100
- National rank
- #6433
- State rank
- #420 of 539 in PA
Livability — Minersville
- Score
- 70/100
- State rank
- #742
- US rank
- #7439
Category grades
Schools grade is shown separately in the Schools card above.
Census & demographics
- Census place
- Minersville, PA
- City population
- 27,121
- Population (ZIP)
- 4,564
Population outlook (Schuylkill County) Hauer SSP2
- Today (2025)
- 137,447 people
- By 2030
- 133,121 · -3.1%
- By 2040
- 124,172 · -9.7%
- By 2050
- 115,611 · -15.9%
- By 2075
- 100,796 · -26.7%
- By 2100
- 86,667 · -36.9%
Race, ethnicity, and origin ACS 2023
- Neighborhood character
- Predominantly White (81%)
- Race & ethnicity
- White 81% Two or more races 15% Hispanic / Latino 12%
- Hispanic origin (detail)
- Puerto Rican 11%
- Common ancestry
- Polish 5% Romanian 5% Subsaharan African 4%
- Foreign-born
- 3% · Canada, China
- Languages at home
- 97% English-only · Spanish 2%
Political lean MEDSL · Schuylkill
- 2024 margin
- Solid R (+42.1) · D 28.5% · R 70.6%
- 2008→2024 swing
- -33.4pp toward R · 2008: -8.7pp · 2024: -42.1pp
- All cycles
- 2024: R+42.1 2020: R+39.9 2016: R+43.4 2012: R+13.4 2008: R+8.7
Not yet ingested
- Civics
- —
Market trends
- HPI YoY
- ▲ 4.65%
- Current HPI
- 209.7647
- Rent YoY
- —
- Metro
- —
- State GDP YoY
- ▲ 1.68%
- F500 in state
- 34
Industry mix (Fortune 500 HQ in PA)
| Industry | F500 HQs | Revenue |
|---|---|---|
| Healthcare | 2 | $309B |
|
||
| Insurance | 2 | $27B |
|
||
| Telecommunications / Media | 1 | $124B |
|
||
| Industrial Distribution | 1 | $22B |
|
||
| Financial Services | 1 | $20B |
|
||
| Chemicals / Materials | 1 | $18B |
|
||
Price history
+0.0% since first listed3 events — show timeline
- 2026-06-11 Pending — BRIGHT MLS
- 2026-06-11 Listed $45,000 BRIGHT MLS
- 2026-06-10 Coming Soon $45,000 BRIGHT MLS
Property tax history
+13.8%/yrLatest (2026): $3,968 · +216.8% YoY. Source: county tax records.
Cash-flow waterfall
monthlySold comps — $/sqft
last 12 mo · ≤1 miLoading sold comps…