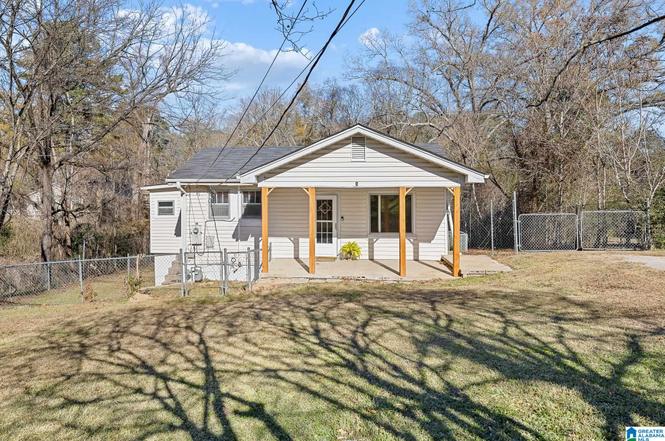
120 Vail Ave · Hueytown, AL
Flood risk 1/10 · Minimal
- FEMA flood zone
- X (unshaded)
- Chance of flooding over 30 yrs
- 0.0%
- Est. flood insurance / yr
- $507 – $1,088
Fire risk 3/10 · Minor
- Est. fire insurance / yr
- $916 – $1,700
Heat risk 6/10 · Moderate
- Hot days now (above 108°F)
- 7 days/yr
- Hot days in 30 yrs
- 19 days/yr
Wind risk 6/10 · Moderate
- Chance of severe wind over 30 yrs
- 27.0%
Air-quality risk 3/10 · Minor
- Unhealthy air days now
- 2 days/yr
- Unhealthy air days in 30 yrs
- 5 days/yr
Risk factors via First Street. Map © Google.
Why this score? — see what drove the B- grade
The composite is a weighted blend of 9 inputs, each scored 0–100. Each bar is that input's sub-score; the figure is the points it added to the 100-point composite (weight × sub-score).
- Cash flow +24.8/30.0
- ARV discount +15.0/15.0
- DSCR +8.0/10.0
- 1% rule +5.3/10.0
- Appreciation +4.7/10.0
- Rent growth +2.9/5.0
- Livability +2.9/5.0
- Condition / age +2.5/5.0
- Schools +1.8/10.0
$104,900
🖨 Deal sheet (PDF) 📄 Offer letter ✓ Due diligence
Listing remarks MLS
A charming one-level Hueytown cottage, nestled near at the end of a peaceful street, is ready for it's next chapter! This cozy 2-bedroom, 1-bathroom gem offers a perfect balance of comfort and convenience. Step into the spacious living room as it invites you to unwind while visiting with family and friends. Whip up your favorite treats in the generous kitchen that provides plenty of room for cooking and dining. A separate sunny laundry room adds to the ease of everyday living. Enjoy the outside in your private fenced yard, ideal for relaxation, pets or watching children play. With its quiet location and thoughtful layout, this home is perfect and close by all the conveniences of shopping and schools.
Key facts
- Generous kitchen
- Private fenced yard
- One level
Tags
Neighborhood map
What this means for you Summary
Snapshot
- This is a 2-bed/1.0-bath single-family listed at $105k.
Deal economics
- At list price, monthly cash flow is $221 ($3k/yr) — positive.
- The deal already cash-flows at list — no discount required.
- Meets the 1% rule at list price ($1k rent vs $105k).
- Recommended offer: $92k (12.0% below list) — sets the bar for market timing.
- Cap rate 8.8% vs local median 5.9% in Hueytown — top-decile yield for the area; either an underpriced asset or a hidden risk that comps aren't pricing in. Stress-test before assuming the spread holds.
Location & tenants
- Location reads 57/100 on livability (#378 in AL) — a working-class tenant base; expect higher turnover. Strengths: cost of living A+, housing A+; Watch: employment D, schools F, crime F.
- Jefferson County (suburban): math 9% / reading 32% proficiency, ranked #104 of 129 in AL (top 81%) — low school quality limits family demand, transient renter base, plan for 1-2y turnover.
- Market conditions: Rents rising (+1.6%/yr); 251 active listings in the ZIP; 21 comparable units currently listed for rent nearby; rentals at typical pace (median 20d on market — plan ~3-4 weeks tenant-placement turnaround); 2,114 units permitted in Jefferson County in 2024 (556 in 5+ unit buildings).
Forward outlook
- In year one you build about $96 of equity ($725 loan paydown + $-629 appreciation (-0.6% local appreciation)).
- Jefferson County population projected to shrink 4% by 2050 — rents likely to lag national; underwrite the cash flow, not the appreciation.
- At projected returns (-0.6% appreciation + 1.6% rent growth), your $29k cash investment doubles in ~9 years — after that, you're playing with house money.
Negotiation context
- It's been on market 170 days — a 12% lower offer ($92k) is reasonable based on typical stale-listing flexibility.
- Current owner paid $67k; list at $105k implies a 56% gain — meaningful room to come down on a strong offer.
Risks & watch-outs
- Watch-outs: built in 1950 — expect roof / HVAC / electrical / plumbing capex.
- Climate carrying-cost: major wind risk, 27% chance of damaging wind over 30y; extreme-heat days projected 7→19/yr by 2055 (HVAC capex compounding) — expect insurance premiums to compound above CPI over the hold.
Questions for the listing agent
- It's been on market 170 days. Have you received any prior offers? Is the seller open to a 12% concession, seller financing, or rate buy-down credit?
- Built in 1950 — when were the roof, HVAC, electrical panel, plumbing, and water heater last replaced?
- Why hasn't it sold? Are there any deal-killer items the seller is aware of (foundation, flood, title, zoning, code violations)?
- Is there a deadline driving the sale (1031 exchange, divorce, estate, relocation)? That informs how much negotiation room exists.
- Schools are F-rated, which usually means shorter tenancies and higher turnover. Who's the typical renter profile here, and what's been the actual vacancy rate?
- Crime grade is F in this area — have there been break-ins, vandalism, or insurance claims at this property in the last 3 years? What carrier currently insures it and at what premium?
- What's the average days-on-market for RENTAL listings here right now (not sales)? A rising rental-DOM trend means longer vacancies and softer asking-rent achievability than the comps imply.
- What's the recent tenant-quality profile in this submarket — average credit score on applications, eviction rate, late-payment / NSF rate, and stable-employment percentage? A property-management company in the area should have these aggregated.
- How much new for-sale + rental construction is in the pipeline within 1–3 miles? Heavy new supply typically softens prices + rents 12–24 months out; constrained supply supports both.
Investment metrics
- 1% rule
- 1.03% ✓
- Cap rate
- 8.82%
- Cash-on-cash
- 9.02%
- DSCR
- 1.40
- GRM
- 8.1
CMA / ARV
- ARV (median comp)
- $141,225
- List price
- $104,900
- Delta
- -25.72%
- Verdict
- UNDERPRICED
- Comps
- 20 within 1.0 mi
Show comp detail 12 sales within ~0.75 mi
| Address | Dist | Beds/Ba | Sqft | Sold | Price | $/sf | Match |
|---|---|---|---|---|---|---|---|
| 111 Westbrook Rd | 0.44mi | 2/1.0 | 1,007 (-2%) | 2mo | $60,000 | $60 | 75 |
| 108 Jones Ave | 0.40mi | 2/1.0 | 960 (-6%) | 1mo | $110,000 | $115 | 70 |
| 116 Midway Dr | 0.47mi | 2/1.0 | 1,040 (+1%) | 9mo | $155,000 | $149 | 69 |
| 104 Vail Ave | 0.09mi | 2/2.0 | 1,110 (+8%) | 15mo | $133,000 | $120 | 66 |
| 89 Midway Dr | 0.50mi | 3/2.0 (+1) | 1,020 (-1%) | 8mo | $179,864 | $176 | 60 |
| 103 Virginia Dr | 0.52mi | 2/1.0 | 1,050 (+2%) | 18mo | $159,000 | $151 | 57 |
| 117 Westbrook Rd | 0.46mi | 2/2.0 | 1,005 (-2%) | 18mo | $159,000 | $158 | 56 |
| 116 Louis Ave | 0.61mi | 2/1.0 | 919 (-10%) | 5mo | $127,000 | $138 | 50 |
| 1440 Hueytown Rd | 0.39mi | 3/1.5 (+1) | 1,146 (+12%) | 7mo | $159,000 | $139 | 49 |
| 158 21st St S | 0.66mi | 2/2.0 | 1,064 (+4%) | 15mo | $165,000 | $155 | 46 |
| 117 Walker Ave | 0.68mi | 2/1.0 | 947 (-8%) | 12mo | $155,000 | $164 | 46 |
| 304 Sunrise Blvd | 0.65mi | 2/2.0 | 1,099 (+7%) | 11mo | $108,000 | $98 | 45 |
Match score weights: distance 35% · size 25% · config 20% · recency 20%. Top-matched comps best support the ARV.
Projected returns pro-forma
-0.6% appreciation · 1.6% rent growth · sell at horizon
- IRR
- 4.9%
- Equity multiple
- 1.22×
- Total profit
- $6,523
- Equity at exit
- $27,350
- IRR
- 9.8%
- Equity multiple
- 1.96×
- Total profit
- $28,166
- Equity at exit
- $30,487
Cash invested: $29,372 (down + closing). Projections, not guarantees.
Landlord ↔ Tenant lean methodology
- Overall (STATE)
- 90 Strongly Landlord-Friendly
- State Alabama
- 90 Strongly Landlord-Friendly · R+15
- County
- — inherits STATE
- City
- — inherits STATE
ZIP-level market 35023
- Home prices YoY
- -0.1%
- Rents YoY
- 1.6%
- Active inventory
- 251
- Price-to-rent
- 8.1×
Monthly cashflow live
- Estimated rent
- $1,084 high interval (Pro) →
- Mortgage (P&I)
- −$550
- Tax from tax record
- −$42 /mo · $502/yr
- Insurance
- −$44
- HOA
- −$0
- Vacancy / Maint / Mgmt
- −$228
- Net cashflow
- $221
Break-even live
Sensitivity live
| Price | -10% $280 | -5% $250 | +0% $221 | +5% $191 | +10% $161 |
|---|---|---|---|---|---|
| Rent | -10% $135 | -5% $178 | +0% $221 | +5% $264 | +10% $306 |
| Rate | -1.0pp $274 | -0.5pp $247 | base $221 | +0.5pp $194 | +1.0pp $166 |
UW: 25.0% down · 7.5% · 30yr · 1.5% tax · 5.0% vac · 8.0% maint · 8.0% mgmt
Financing live
Cash to close
- Down payment
- $26,225
- Closing costs
- $3,147
- Reserves months
- —
- Total cash needed
- —
Loan-product check · same deal, 3 products live
Conventional
25% down · 7.5% · 30yr
- Down + closing
- —
- Monthly P&I
- —
- Monthly cashflow
- —
- DSCR
- —
- Eligible?
- —
Personal DTI + credit; lowest rate.
DSCR
20% down · 8.5% · 30yr
- Down + closing
- —
- Monthly P&I
- —
- Monthly cashflow
- —
- DSCR
- —
- Eligible?
- —
No personal income docs; deal must DSCR.
Hard money
10% down · 12.0% · 12mo
- Down + closing
- —
- Monthly P&I
- —
- Monthly cashflow
- —
- DSCR
- —
- Eligible?
- —
Short-term bridge; refi at stabilization.
Rent comps 21 comps
| Address | Beds | Baths | Sqft | Rent | $/sqft | DOM | Units | Dist |
|---|---|---|---|---|---|---|---|---|
| 116 Vail Ave Bessemer, AL | 2.0 | 1.0 | 1008 | $975 | $0.97 | 20d | 1 | 0.04mi |
| 1409 Hueytown Rd Unit 76 Bessemer, AL | 2.0 | 1.0 | 876 | $995 | $1.14 | 4d | 1 | 0.22mi |
| 1409 Hueytown Rd Apt 63 Bessemer, AL | 2.0 | 1.0 | 876 | $995 | $1.14 | 45d | 1 | 0.22mi |
| 110 Ray Ave Apt 7 Hueytown, AL | 2.0 | 2.0 | 900 | $875 | $0.97 | 4d | 1 | 0.25mi |
| 2020 High School Rd Unit C Bessemer, AL | 2.0 | 1.0 | 733 | $750 | $1.02 | 15d | 1 | 0.30mi |
| 622 S Parkell Ave Bessemer, AL | 3.0 | 1.0 | 963 | $1,200 | $1.25 | 45d | 1 | 0.32mi |
| 1444 Hueytown Rd Unit B Hueytown, AL | 2.0 | 1.0 | 725 | $945 | $1.30 | 24d | 1 | 0.41mi |
| 123 Westbrook Rd Bessemer, AL | 3.0 | 2.0 | 1427 | $1,275 | $0.89 | 45d | 1 | 0.47mi |
| 109 Oak Ave Bessemer, AL | 3.0 | 1.0 | 1120 | $1,200 | $1.07 | 4d | 1 | 0.57mi |
| 105 Louis Ave Bessemer, AL | 2.0 | 1.0 | 1073 | $1,100 | $1.03 | 45d | 1 | 0.65mi |
| 107 Wheeler Dr Bessemer, AL | 2.0 | 1.0 | 950 | $950 | $1.00 | 45d | 1 | 0.67mi |
| 309 Sunrise Blvd Bessemer, AL | 2.0 | 1.0 | 1105 | $1,160 | $1.05 | 12d | 1 | 0.70mi |
| 3269 Allison Bonnett Memorial Dr Bessemer, AL | 3.0 | 2.0 | 1306 | $1,435 | $1.10 | 15d | 1 | 0.71mi |
| 119 Wheeler Dr Bessemer, AL | 3.0 | 2.0 | 1215 | $1,300 | $1.07 | 12d | 1 | 0.72mi |
| 102 Wheeler Dr Bessemer, AL | 3.0 | 1.5 | 1200 | $1,175 | $0.98 | 45d | 1 | 0.72mi |
| 315 Pope Dr Bessemer, AL | 3.0 | 2.0 | 1292 | $1,225 | $0.95 | 20d | 1 | 0.92mi |
| 425 Oakwood Ave Bessemer, AL | 2.0–3.0 | 2.0 | 1082 | $700 | $0.65 | 2d | 2 | 0.93mi |
| 208 Kentwood Ave Bessemer, AL | 3.0 | 1.0 | 1177 | $1,075 | $0.91 | 45d | 1 | 1.09mi |
| 216 Meadowood Ave Bessemer, AL | 3.0 | 1.0 | 1430 | $1,250 | $0.87 | 4d | 1 | 1.17mi |
| 119 Lakeland Ave Bessemer, AL | 3.0 | 1.0 | 1042 | $1,125 | $1.08 | 24d | 1 | 1.19mi |
| 406 Forest Rd Bessemer, AL | 3.0 | 2.0 | 1200 | $1,175 | $0.98 | 15d | 1 | 1.39mi |
Listing history 14 events
-
2026-06-17days on market $104,900 Active 170 DOM
-
2026-06-16days on market $104,900 Active 169 DOM
-
2026-06-15days on market $104,900 Active 168 DOM
-
2026-06-13pricedays on market $104,900 Active 166 DOM
-
2026-06-10days on market $109,900 Active 163 DOM
-
2026-06-09days on market $109,900 Active 162 DOM
-
2026-06-08days on market $109,900 Active 161 DOM
-
2026-06-07days on market $109,900 Active 160 DOM
-
2026-06-03days on market $109,900 Active 156 DOM
-
2026-06-02days on market $109,900 Active 155 DOM
-
2026-06-01days on market $109,900 Active 154 DOM
-
2026-05-31days on market $109,900 Active 153 DOM
-
2025-12-28$109,900 Active 709-char remark
Show marketing remark (709 chars)
A charming one-level Hueytown cottage, nestled near at the end of a peaceful street, is ready for it's next chapter! This cozy 2-bedroom, 1-bathroom gem offers a perfect balance of comfort and convenience. Step into the spacious living room as it invites you to unwind while visiting with family and friends. Whip up your favorite treats in the generous kitchen that provides plenty of room for cooking and dining. A separate sunny laundry room adds to the ease of everyday living. Enjoy the outside in your private fenced yard, ideal for relaxation, pets or watching children play. With its quiet location and thoughtful layout, this home is perfect and close by all the conveniences of shopping and schools.
-
2004-03-10soldstatus $67,333
ⓘ Source: listings_history table (triggers on properties + properties_extension) + one-shot
backfill from property_details.listing_events for pre-trigger history.
Tax reassessment forecast AL · Resets to sale price
- Current annual tax
- $502 · $42/mo
- Projected year-2 tax
- $502 · $42/mo
- Expected delta
- $0/yr ($0/mo · -0.0%)
ⓘ Screening estimate from a state-policy table — verify with the county assessor before closing.
Climate risk First Street
- Flood 1/10 Low FEMA zone X (unshaded) · 0% chance over 30 yrs
- Wildfire 3/10 Moderate
- Heat 6/10 Major 7 d/yr ≥108°F today · 19 d/yr by 30 yrs out
- Wind 6/10 Major 27% chance of damaging wind over 30 yrs
- Air quality 3/10 Moderate 2 unhealthy d/yr today · 5 by 30 yrs out
Nearby sold comps map
Loading sold comps map…
Walkable amenities ~0.75 mi
Loading nearby amenities…
Taxation est. · year 1
- Rental income
- $13,009
- − Mortgage interest
- −$5,876
- − Property taxes
- −$502
- − Insurance
- −$524
- − Repairs & maintenance
- −$1,041
- − Management
- −$1,041
- − Depreciation
- −$3,052
- Taxable income
- $973
- Est. tax owed @ 24.0%
- −$234
- After-tax cash flow
- $2,415/yr
For passive investors: Depreciation is non-cash, so a rental often shows a tax loss while cash-flowing — sheltering income. Rental losses are passive: they offset passive income freely, and up to $25,000/yr can offset ordinary (W-2) income if you actively participate and your MAGI is under $100k (phasing out to $0 by $150k); unused losses carry forward. On sale, claimed depreciation is recaptured at up to 25%, and gains may owe capital-gains tax (a 1031 exchange can defer both). Figures are a year-1 estimate at your 24.0% rate — not tax advice; consult a CPA.
Schools (NCES district)
- District
- Jefferson County
- NCES district ID
- 0101920
- Math proficiency
- 9% ▼ -24.00%
- Reading proficiency
- 32% ▼ -5.00%
- Median HH income
- $51,712
- Composite
- 18.4/100
- National rank
- #8937
- State rank
- #104 of 129 in AL
Livability — Hueytown
- Score
- 57/100
- State rank
- #378
- US rank
- #21611
Category grades
Schools grade is shown separately in the Schools card above.
Census & demographics
- Census place
- Hueytown, AL
- County
- Jefferson County · 527,445 people
- Metro
- Birmingham-Hoover, AL
- Population (ZIP)
- 25,533
- Household income
- $69,863
- Rent vs Own
- Severe rent burden
- 247.0
Population outlook (Jefferson County) Hauer SSP2
- Today (2025)
- 669,185 people
- By 2030
- 669,694 · +0.1%
- By 2040
- 661,388 · -1.2%
- By 2050
- 643,086 · -3.9%
- By 2075
- 577,267 · -13.7%
- By 2100
- 474,758 · -29.1%
Race, ethnicity, and origin ACS 2023
- Neighborhood character
- Diverse neighborhood (Simpson 0.56)
- Race & ethnicity
- White 58% Black 30% Hispanic / Latino 7% Two or more races 3%
- Hispanic origin (detail)
- Mexican 5%
- Common ancestry
- Slovak 1% Lithuanian 1% Serbian 1%
- Foreign-born
- 4% · Canada
- Languages at home
- 93% English-only · Spanish 7%
Political lean MEDSL · Jefferson
- 2024 margin
- D (+10.4) · D 54.6% · R 44.2% · Other 1.2%
- 2008→2024 swing
- +5.4pp toward D · 2008: 5.1pp · 2024: 10.4pp
- All cycles
- 2024: D+10.4 2020: D+13.2 2016: D+7.2 2012: D+6.0 2008: D+5.1
Not yet ingested
- Civics
- —
Market trends
- HPI YoY
- ▼ -0.60%
- Current HPI
- 389.38
- Rent YoY
- ▲ 1.60%
- Metro
- Birmingham-Hoover, AL
- State GDP YoY
- ▲ 2.94%
- F500 in state
- 4
Industry mix (Fortune 500 HQ in AL)
| Industry | F500 HQs | Revenue |
|---|---|---|
| Financial Services | 1 | $8B |
|
||
| Healthcare | 1 | $5B |
|
||
Price history
+63.2% since first listed2 events — show timeline
- 2025-12-28 Listed $109,900 Greater Alabama MLS
- 2004-03-10 Sold (Public Records) $67,333 Public Records
Property tax history
+4.6%/yrLatest (2025): $502 · +2.2% YoY. Source: county tax records.
Cash-flow waterfall
monthlySold comps — $/sqft
last 12 mo · ≤1 miLoading sold comps…