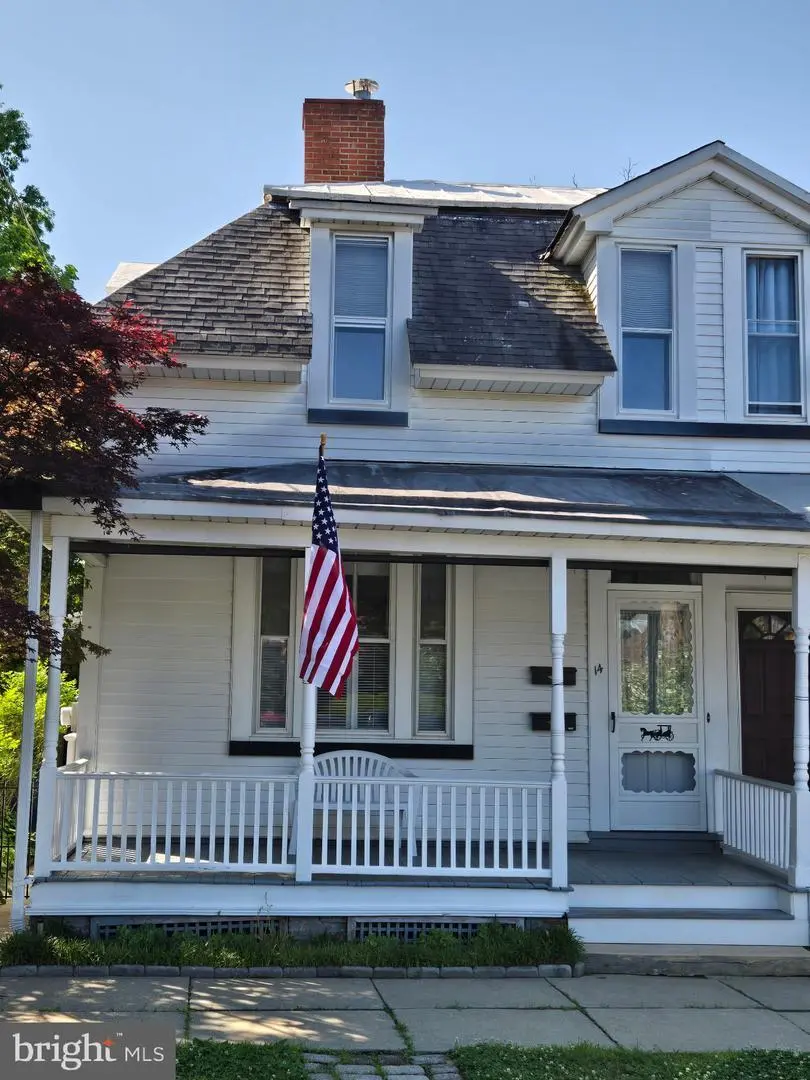
14 Union St · Vincentown, NJ
Flood risk 1/10 · Minimal
- FEMA flood zone
- X (unshaded)
- Chance of flooding over 30 yrs
- 0.0%
- Est. flood insurance / yr
- $507 – $1,088
Fire risk 1/10 · Minimal
- Est. fire insurance / yr
- $526 – $976
Heat risk 6/10 · Moderate
- Hot days now (above 104°F)
- 7 days/yr
- Hot days in 30 yrs
- 15 days/yr
Wind risk 6/10 · Moderate
- Chance of severe wind over 30 yrs
- 51.0%
Air-quality risk 4/10 · Minor
- Unhealthy air days now
- 5 days/yr
- Unhealthy air days in 30 yrs
- 7 days/yr
Risk factors via First Street. Map © Google.
Why this score? — see what drove the C+ grade
The composite is a weighted blend of 9 inputs, each scored 0–100. Each bar is that input's sub-score; the figure is the points it added to the 100-point composite (weight × sub-score).
- Cash flow +22.9/30.0
- ARV discount +15.0/15.0
- DSCR +7.4/10.0
- 1% rule +6.6/10.0
- Schools +3.4/10.0
- Rent growth +2.9/5.0
- Livability +2.5/5.0
- Condition / age +2.5/5.0
- Appreciation +0.0/10.0
$265,777
🖨 Deal sheet (PDF) 📄 Offer letter ✓ Due diligence
Listing remarks
OFFER has been ACCEPTED. Thank you. Great home or Investment!! Priced for new homeowner who wants to make it their own or an investor who can start Day 1 with Income. You can House Hack too!! Good to move in right away and update as you live there. A separate efficiency with its own kitchen, full bath, and washer & dryer (HUD FMR $1,350). The main house has 3 bedrooms and 2 FULL baths, washer & dryer. (HUD FMR $$2,050). Rent both, rent one, live in the whole thing! So many options!! In Historic Mt. Holly, this charming home has so much potential!! Just a quick walk down High St to the many Festivals and parades throughout the year! Burlington County's 250 Anniversary Festiva
Key facts
- Built 1900
- Listed 13 days
Property features AI
Exterior
- Parking: On-street parking
- Utilities: Public water; Public sewer; Natural gas available; Electric available (100 amp service); Cable and fiber optic internet available; Cable TV available; Natural gas hot water
- Home design: Semi-detached property; Fee simple ownership; Year built reported as estimated
- Construction: Brick construction; Block and brick/mortar foundation
- Exterior features: Lot dimensions approximately 22 x 74; Not in a federal flood zone; Pets allowed with no restrictions; Above-grade other structures
Interior
- Kitchen: Oven/Range - Gas; Dishwasher; Exhaust fan
- Bedrooms: One bedroom on the main level; Two bedrooms on the first upper level
- Bathrooms: Two full bathrooms (one on main level, one on first upper level)
- Heating & cooling: 90% forced air heating (natural gas); Central air conditioning (natural gas)
- Interior features: Second kitchen; Traditional floor plan; Formal separate dining room; Butler's pantry; Ceiling fans; Double/dual staircase; Efficiency unit (additional); Stall shower and tub/shower combination; Walk-in shower; Entry-level bedroom
- Laundry & utility: Washer in unit; Dryer in unit (gas); Laundry areas on main and upper floors
Neighborhood map
What this means for you Summary
Snapshot
- This is a 3-bed/2.0-bath townhouse listed at $266k.
Deal economics
- At list price, monthly cash flow is $468 ($6k/yr) — positive.
- The deal already cash-flows at list — no discount required.
- Meets the 1% rule at list price ($3k rent vs $266k).
- Cap rate 8.4% vs local median 4.5% in Vincentown — top-decile yield for the area; either an underpriced asset or a hidden risk that comps aren't pricing in. Stress-test before assuming the spread holds.
Location & tenants
- Location reads: area grade C — affects rentability + tenant quality, not the cash-flow math above.
- Rancocas Valley Regional High School District (suburban): math 29% / reading 49% proficiency, ranked #236 of 472 in NJ (top 50%) — families likely to look elsewhere, expect single-tenant / working-renter base with shorter leases.
- Zoned schools: Gertrude C. Folwell Elementary School (math 8% / reading 32%, grade F, #995 of 1,303 statewide, top 78%, 332 students, 60% FRL); F. W. Holbein Middle School (math 11% / reading 35%, grade F, #376 of 431 statewide, top 88%, 449 students, 64% FRL); Rancocas Valley Regional High School (math 29% / reading 49%, grade F, #197 of 399 statewide, top 51%, 1,981 students, 25% FRL).
- Market conditions: Rents rising (+1.4%/yr); 137 active listings in the ZIP; 12 comparable units currently listed for rent nearby; rentals leasing fast (median 0d on market — plan ~1-2 weeks tenant-placement turnaround); solid renter incomes; 2,161 units permitted in Burlington County in 2024 (988 in 5+ unit buildings).
- This rent runs 34% of the median local income ($109k/yr) — at the standard rent-burdened threshold; future hikes will face affordability resistance.
Forward outlook
- Local home prices are declining (-3.0%/yr); year-one equity from $2k of loan paydown is wiped out by about $8k of value loss. Plan a longer hold.
- Burlington County population projected to shrink 5% by 2050 — rents likely to lag national; underwrite the cash flow, not the appreciation.
Negotiation context
- Only 13 days on market — expect competitive offers; lowballing is unlikely to land.
- 2 sale attempts since 2y ago with the ask held roughly flat each time — persistent listings suggest the price (not the market) is what's stuck; bring a comps-based counter.
Risks & watch-outs
- Watch-outs: built in 1900 — expect roof / HVAC / electrical / plumbing capex.
- Climate carrying-cost: major wind risk, 51% chance of damaging wind over 30y; extreme-heat days projected 7→15/yr by 2055 (HVAC capex compounding) — expect insurance premiums to compound above CPI over the hold.
Questions for the listing agent
- Built in 1900 — when were the roof, HVAC, electrical panel, plumbing, and water heater last replaced?
- Is there a deadline driving the sale (1031 exchange, divorce, estate, relocation)? That informs how much negotiation room exists.
- What's the average days-on-market for RENTAL listings here right now (not sales)? A rising rental-DOM trend means longer vacancies and softer asking-rent achievability than the comps imply.
- What's the recent tenant-quality profile in this submarket — average credit score on applications, eviction rate, late-payment / NSF rate, and stable-employment percentage? A property-management company in the area should have these aggregated.
- How much new for-sale + rental construction is in the pipeline within 1–3 miles? Heavy new supply typically softens prices + rents 12–24 months out; constrained supply supports both.
Investment metrics
- 1% rule
- 1.16% ✓
- Cap rate
- 8.41%
- Cash-on-cash
- 7.55%
- DSCR
- 1.34
- GRM
- 7.2
CMA / ARV
- ARV (on-the-fly)
- $329,784
- Comps found
- 12
Show comp detail 12 sales within ~0.75 mi
| Address | Dist | Beds/Ba | Sqft | Sold | Price | $/sf | Match |
|---|---|---|---|---|---|---|---|
| 48 Buttonwood St | 0.16mi | 4/1.5 (+1) | 2,022 (+3%) | 8mo | $272,000 | $135 | 74 |
| 44 Buttonwood St | 0.18mi | 2/1.5 (-1) | 2,122 (+8%) | 0mo | $272,000 | $128 | 71 |
| 310 Garden St | 0.30mi | 4/1.5 (+1) | 1,950 (-1%) | 8mo | $286,000 | $147 | 71 |
| 73 Madison Ave | 0.59mi | 3/1.5 | 1,954 (-0%) | 1mo | $327,500 | $168 | 69 |
| 14 Brainerd St | 0.15mi | 4/1.5 (+1) | 1,760 (-10%) | 8mo | $300,000 | $170 | 62 |
| 46 White St | 0.38mi | 3/2.0 | 1,820 (-7%) | 10mo | $300,000 | $165 | 62 |
| 305 Garden St | 0.29mi | 4/2.0 (+1) | 2,186 (+11%) | 9mo | $245,000 | $112 | 55 |
| 246 Rutland Ave | 0.33mi | 4/1.5 (+1) | 1,696 (-14%) | 1mo | $210,000 | $124 | 54 |
| 102 Levis Dr | 0.60mi | 3/2.5 | 2,232 (+14%) | 2mo | $440,000 | $197 | 46 |
| 108 Levis Dr | 0.59mi | 3/2.5 | 2,232 (+14%) | 5mo | $450,000 | $202 | 43 |
| 34 Wallace Rd | 0.63mi | 3/2.5 | 1,728 (-12%) | 8mo | $379,000 | $219 | 42 |
| 16 Foundry Blvd | 0.57mi | 3/2.5 | 2,232 (+14%) | 12mo | $462,200 | $207 | 39 |
Match score weights: distance 35% · size 25% · config 20% · recency 20%. Top-matched comps best support the ARV.
Projected returns pro-forma
-3.0% appreciation · 1.42% rent growth · sell at horizon
- IRR
- -6.6%
- Equity multiple
- 0.76×
- Total profit
- $-17,932
- Equity at exit
- $39,628
- IRR
- 0.9%
- Equity multiple
- 1.06×
- Total profit
- $4,155
- Equity at exit
- $22,980
Cash invested: $74,418 (down + closing). Projections, not guarantees.
Landlord ↔ Tenant lean methodology
- Overall (STATE)
- 21 Tenant-Leaning
- State New Jersey
- 21 Tenant-Leaning · D+6
- County
- — inherits STATE
- City
- — inherits STATE
ZIP-level market 08060
- Home prices YoY
- -34.5%
- Rents YoY
- 1.4%
- Active inventory
- 137
- Price-to-rent
- 7.2×
Monthly cashflow live
- Estimated rent
- $3,076 high interval (Pro) →
- Mortgage (P&I)
- −$1,394
- Tax from tax record
- −$457 /mo · $5,487/yr
- Insurance
- −$111
- HOA
- −$0
- Vacancy / Maint / Mgmt
- −$646
- Net cashflow
- $468
Break-even live
Sensitivity live
| Price | -10% $619 | -5% $544 | +0% $468 | +5% $393 | +10% $318 |
|---|---|---|---|---|---|
| Rent | -10% $225 | -5% $347 | +0% $468 | +5% $590 | +10% $711 |
| Rate | -1.0pp $602 | -0.5pp $536 | base $468 | +0.5pp $399 | +1.0pp $329 |
UW: 25.0% down · 7.5% · 30yr · 1.5% tax · 5.0% vac · 8.0% maint · 8.0% mgmt
Financing live
Cash to close
- Down payment
- $66,444
- Closing costs
- $7,973
- Reserves months
- —
- Total cash needed
- —
Loan-product check · same deal, 3 products live
Conventional
25% down · 7.5% · 30yr
- Down + closing
- —
- Monthly P&I
- —
- Monthly cashflow
- —
- DSCR
- —
- Eligible?
- —
Personal DTI + credit; lowest rate.
DSCR
20% down · 8.5% · 30yr
- Down + closing
- —
- Monthly P&I
- —
- Monthly cashflow
- —
- DSCR
- —
- Eligible?
- —
No personal income docs; deal must DSCR.
Hard money
10% down · 12.0% · 12mo
- Down + closing
- —
- Monthly P&I
- —
- Monthly cashflow
- —
- DSCR
- —
- Eligible?
- —
Short-term bridge; refi at stabilization.
Rent comps 12 comps
| Address | Beds | Baths | Sqft | Rent | $/sqft | DOM | Units | Dist |
|---|---|---|---|---|---|---|---|---|
| 209 Mill St Mount Holly, NJ | 3.0 | 1.5 | 1274 | $2,400 | $1.88 | 3d | 1 | 0.30mi |
| 37 Church St Mount Holly, NJ | 3.0 | 1.5 | 1900 | $2,370 | $1.25 | 11d | 1 | 0.32mi |
| 144 Washington St Unit C Mt Holly, NJ | 3.0 | 1.0 | 1450 | $2,370 | $1.63 | 16d | 1 | 0.53mi |
| 10 Stanton Rd Mount Holly, NJ | 3.0 | 2.5 | 2208 | $3,300 | $1.49 | 0d | 1 | 0.58mi |
| 64 Regency Dr Mt Holly, NJ | 1.0–3.0 | 1.0–2.0 | 1066 | $2,800 | $2.63 | 0d | 1 | 0.58mi |
| 209 Front St Mount Holly, NJ | 4.0 | 2.5 | 1500 | $4,950 | $3.30 | 0d | 1 | 0.62mi |
| 302 Barrington Ct Mt Holly, NJ | 1.0–3.0 | 1.0–2.5 | 1226 | $2,959 | $2.41 | 0d | 11 | 0.67mi |
| 1 Kirby Ct Mt Holly, NJ | 1.0–3.0 | 1.0–2.5 | 1349 | $3,125 | $2.32 | 0d | 13 | 0.71mi |
| 610 Ogden Dr Westampton, NJ | 4.0 | 2.0 | 2370 | $4,200 | $1.77 | 23d | 1 | 0.94mi |
| 501 Bloomfield Dr Westampton, NJ | 4.0 | 2.0 | 1975 | $4,950 | $2.51 | 0d | 1 | 1.08mi |
| 502 Bloomfield Dr Westampton, NJ | 4.0 | 3.0 | 1666 | $4,950 | $2.97 | 0d | 1 | 1.09mi |
| 12000 Hamilton Way Eastampton Township, NJ | 1.0–2.0 | 1.0–2.5 | 1100 | $2,894 | $2.63 | 0d | 12 | 1.25mi |
Listing history 10 events
-
2026-06-13statusdays on market $265,777 Pending 13 DOM
-
2026-06-09days on market $265,777 Active 10 DOM
-
2026-06-08days on market $265,777 Active 9 DOM
-
2026-06-07days on market $265,777 Active 8 DOM
-
2026-06-04days on market $265,777 Active 5 DOM
-
2026-06-03days on market $265,777 Active 4 DOM
-
2026-06-02days on market $265,777 Active 3 DOM
-
2026-06-01days on market $265,777 Active 2 DOM
-
2026-05-31remarks 691-char remark
-
2026-05-31$265,777 Active 1 DOM
ⓘ Source: listings_history table (triggers on properties + properties_extension) + one-shot
backfill from property_details.listing_events for pre-trigger history.
Tax reassessment forecast NJ · Partial reset (capped growth)
- Current annual tax
- $5,487 · $457/mo
- Projected year-2 tax
- $6,053 · $504/mo
- Expected delta
- +$565/yr (+$47/mo · 10.3%)
ⓘ Screening estimate from a state-policy table — verify with the county assessor before closing.
Climate risk First Street
- Flood 1/10 Low FEMA zone X (unshaded) · 0% chance over 30 yrs
- Wildfire 1/10 Low
- Heat 6/10 Major 7 d/yr ≥104°F today · 15 d/yr by 30 yrs out
- Wind 6/10 Major 51% chance of damaging wind over 30 yrs
- Air quality 4/10 Moderate 5 unhealthy d/yr today · 7 by 30 yrs out
Nearby sold comps map
Loading sold comps map…
Walkable amenities ~0.75 mi
Loading nearby amenities…
Taxation est. · year 1
- Rental income
- $36,913
- − Mortgage interest
- −$14,888
- − Property taxes
- −$5,487
- − Insurance
- −$1,329
- − Repairs & maintenance
- −$2,953
- − Management
- −$2,953
- − Depreciation
- −$7,732
- Taxable income
- $1,571
- Est. tax owed @ 24.0%
- −$377
- After-tax cash flow
- $5,243/yr
For passive investors: Depreciation is non-cash, so a rental often shows a tax loss while cash-flowing — sheltering income. Rental losses are passive: they offset passive income freely, and up to $25,000/yr can offset ordinary (W-2) income if you actively participate and your MAGI is under $100k (phasing out to $0 by $150k); unused losses carry forward. On sale, claimed depreciation is recaptured at up to 25%, and gains may owe capital-gains tax (a 1031 exchange can defer both). Figures are a year-1 estimate at your 24.0% rate — not tax advice; consult a CPA.
Schools (NCES district)
- District
- Rancocas Valley Regional High School District
- NCES district ID
- 3413620
- Math proficiency
- 29% ▼ -18.00%
- Reading proficiency
- 49% ▼ -4.00%
- Median HH income
- $58,992
- Composite
- 34.45/100
- National rank
- #5195
- State rank
- #236 of 472 in NJ
Livability — Vincentown
No livability data for this city. (Only ~50 U.S. cities are tracked.)
Census & demographics
- County
- Burlington County · 323,710 people
- Metro
- Philadelphia-Camden-Wilmington, PA-NJ-DE-MD
- Population (ZIP)
- 25,835
- Household income
- $109,292
- Rent vs Own
- Severe rent burden
- 562.0
Population outlook (Burlington County) Hauer SSP2
- Today (2025)
- 453,425 people
- By 2030
- 452,359 · -0.2%
- By 2040
- 445,033 · -1.9%
- By 2050
- 431,760 · -4.8%
- By 2075
- 406,277 · -10.4%
- By 2100
- 364,732 · -19.6%
Race, ethnicity, and origin ACS 2023
- Neighborhood character
- Diverse neighborhood (Simpson 0.68)
- Race & ethnicity
- White 49% Black 25% Two or more races 15% Hispanic / Latino 13% Asian 4%
- Hispanic origin (detail)
- Mexican 2% Puerto Rican 7%
- Common ancestry
- Romanian 4% Lithuanian 2% Italian 1%
- Foreign-born
- 11% · Canada, Dominican Republic, China
- Languages at home
- 87% English-only · Spanish 7% Other Indo-European 2% French/Haitian/Cajun 1%
Political lean MEDSL · Burlington
- 2024 margin
- D (+16.6) · D 57.6% · R 41.0% · Other 1.3%
- 2008→2024 swing
- -2.0pp toward R · 2008: 18.6pp · 2024: 16.6pp
- All cycles
- 2024: D+16.6 2020: D+19.5 2016: D+14.8 2012: D+18.7 2008: D+18.6
Not yet ingested
- Civics
- —
Market trends
- HPI YoY
- ▼ -156.50%
- Current HPI
- 296.564
- Rent YoY
- ▲ 1.42%
- Metro
- Philadelphia-Camden-Wilmington, PA-NJ-DE-MD
- State GDP YoY
- ▲ 2.05%
- F500 in state
- 34
Industry mix (Fortune 500 HQ in NJ)
| Industry | F500 HQs | Revenue |
|---|---|---|
| Consumer Goods | 3 | $31B |
|
||
| Pharmaceuticals | 2 | $153B |
|
||
| Technology | 2 | $21B |
|
||
| Insurance | 2 | $20B |
|
||
| Healthcare | 2 | $19B |
|
||
| Financial Services | 1 | $70B |
|
||
Price history
3 events — show timeline
- 2026-05-31 Listed $265,777 BRIGHT MLS
- 2024-07-10 Rental Removed $950 BRIGHTMLS
- 2024-07-03 Listed for Rent $950 BRIGHTMLS
Property tax history
+2.9%/yrLatest (2025): $5,487 · +6.6% YoY. Source: county tax records.
Cash-flow waterfall
monthlySold comps — $/sqft
last 12 mo · ≤1 miLoading sold comps…