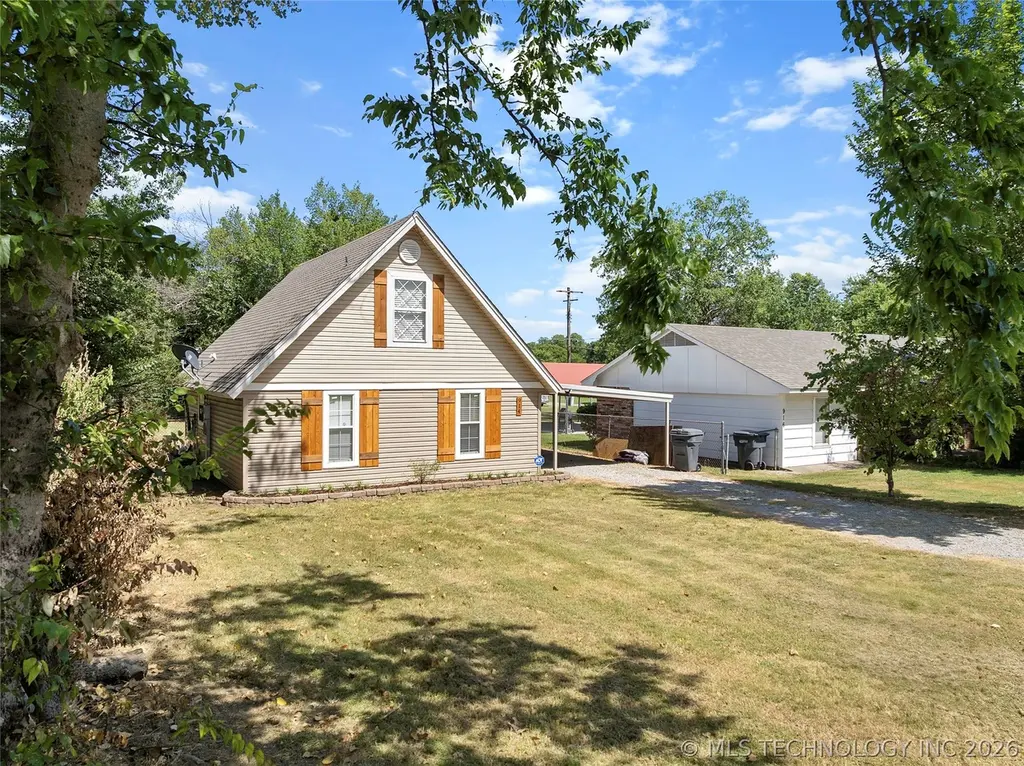
914 Hailey St · Ardmore, OK
Flood risk 1/10 · Minimal
- FEMA flood zone
- X (unshaded)
- Chance of flooding over 30 yrs
- 0.0%
- Est. flood insurance / yr
- $507 – $1,088
Fire risk 5/10 · Moderate
- Est. fire insurance / yr
- $2,463 – $4,575
Heat risk 6/10 · Moderate
- Hot days now (above 112°F)
- 7 days/yr
- Hot days in 30 yrs
- 20 days/yr
Wind risk 4/10 · Minor
- Chance of severe wind over 30 yrs
- 11.0%
Air-quality risk 3/10 · Minor
- Unhealthy air days now
- 2 days/yr
- Unhealthy air days in 30 yrs
- 3 days/yr
Risk factors via First Street. Map © Google.
Why this score? — see what drove the D+ grade
The composite is a weighted blend of 9 inputs, each scored 0–100. Each bar is that input's sub-score; the figure is the points it added to the 100-point composite (weight × sub-score).
- Cash flow +20.7/30.0
- ARV discount +6.8/15.0
- DSCR +6.6/10.0
- 1% rule +4.8/10.0
- Rent growth +4.3/5.0
- Livability +2.9/5.0
- Condition / age +2.5/5.0
- Schools +1.1/10.0
- Appreciation +0.0/10.0
$145,000
🖨 Deal sheet (PDF) 📄 Offer letter ✓ Due diligence
Listing remarks
Cozy & Well-Maintained Home in Southwest Ardmore! This charming two-bedroom, two-bathroom home is move-in ready and waiting for its new owners! Featuring an open living and kitchen area, the kitchen offers ample cabinetry and generous counter space—perfect for everyday living. The downstairs bedroom and full bathroom provide convenience, while the upstairs bedroom and bath offer added privacy. Soft carpeted stairs lead to the upper level, creating a warm and inviting feel. Outside, enjoy the spacious, chain-link fenced yard with mature shade trees, along with a covered carport for parking. This home is ideal for a first-time homeowner or a small family—don’t miss
Key facts
- Ample cabinetry
- Upstairs bedroom
- Full bathroom
Tags
Property features AI
Exterior
- Parking: 1-car garage; Carport
- Security: No safety shelter
- Utilities: Electricity available; Public water; Public sewer
- Home design: 2-story home; Faces west; Slab foundation
- Construction: Built with wood frame, aluminum siding and vinyl siding; Asphalt/fiberglass roof
- Exterior features: Gravel driveway; Shed(s); Chain link fencing; Mature trees
Interior
- Kitchen: Dishwasher; Microwave; Oven; Range; Stove; Electric water heater
- Flooring: Carpet; Laminate
- Bathrooms: 2 full bathrooms
- Heating & cooling: Central heating; Electric heating; Central air; Ductless cooling
- Interior features: Ceiling fan(s); Laminate counters; Vinyl windows
Neighborhood map
What this means for you Summary
Snapshot
- This is a 3-bed/1.0-bath single-family listed at $145k.
Deal economics
- At list price, monthly cash flow is $196 ($2k/yr) — positive.
- The deal already cash-flows at list — no discount required.
- To meet the 1% rule (rent ≥ 1% of price), the offer needs to be $141k (2.4% below list).
- Recommended offer: $136k (6.0% below list) — sets the bar for market timing.
- Cap rate 7.9% vs local median 4.6% in Ardmore — top-decile yield for the area; either an underpriced asset or a hidden risk that comps aren't pricing in. Stress-test before assuming the spread holds.
Location & tenants
- Location reads 58/100 on livability (#447 in OK) — a working-class tenant base; expect higher turnover. Strengths: cost of living A+, housing A+; Watch: crime F, amenities F, commute F.
- Ardmore (town): math 12% / reading 15% proficiency, ranked #241 of 270 in OK (top 89%) — low school quality limits family demand, transient renter base, plan for 1-2y turnover; 73% free/reduced lunch — lower-income household profile, screen leases tightly.
- Zoned schools: Will Rogers Es (352 students, 0% FRL); Ardmore Ms (math 7% / reading 12%, grade F, #299 of 345 statewide, top 88%, 498 students, 0% FRL); Ardmore Hs (math 12% / reading 17%, grade F, #348 of 447 statewide, top 79%, 751 students, 0% FRL) — zoned schools average 0% FRL vs 73% district-wide (73 pts lower); this property's tenant base skews higher-income than the district average.
- Market conditions: Rents rising fast (+7.4%/yr); 382 active listings in the ZIP; 73 units permitted in Carter County in 2024 (0 in 5+ unit buildings).
Forward outlook
- Local home prices are declining (-3.0%/yr); year-one equity from $1k of loan paydown is wiped out by about $4k of value loss. Plan a longer hold.
- Carter County population projected at +9% by 2050 — modest demand growth; plan on rents tracking national, not racing it.
- At projected returns (-3.0% appreciation + 7.4% rent growth), your $41k cash investment doubles in ~10 years — after that, you're playing with house money.
Negotiation context
- It's been on market 70 days — a 6% lower offer ($136k) is reasonable based on typical stale-listing flexibility.
- 8 sale attempts since 6y ago; this cycle's ask has dropped $10k (6%) from the opening price — seller is motivated, your offer sets the floor, not the list.
Risks & watch-outs
- Climate carrying-cost: moderate wildfire risk; extreme-heat days projected 7→20/yr by 2055 (HVAC capex compounding) — expect insurance premiums to compound above CPI over the hold.
Questions for the listing agent
- It's been on market 70 days. Have you received any prior offers? Is the seller open to a 6% concession, seller financing, or rate buy-down credit?
- Why hasn't it sold? Are there any deal-killer items the seller is aware of (foundation, flood, title, zoning, code violations)?
- Is there a deadline driving the sale (1031 exchange, divorce, estate, relocation)? That informs how much negotiation room exists.
- Schools are F-rated, which usually means shorter tenancies and higher turnover. Who's the typical renter profile here, and what's been the actual vacancy rate?
- Crime grade is F in this area — have there been break-ins, vandalism, or insurance claims at this property in the last 3 years? What carrier currently insures it and at what premium?
- The area grade is low — what's the realistic commute time and amenity access for the typical tenant pool here? Any planned neighborhood developments (good or bad) we should know about?
- What's the average days-on-market for RENTAL listings here right now (not sales)? A rising rental-DOM trend means longer vacancies and softer asking-rent achievability than the comps imply.
- What's the recent tenant-quality profile in this submarket — average credit score on applications, eviction rate, late-payment / NSF rate, and stable-employment percentage? A property-management company in the area should have these aggregated.
- How much new for-sale + rental construction is in the pipeline within 1–3 miles? Heavy new supply typically softens prices + rents 12–24 months out; constrained supply supports both.
Investment metrics
- 1% rule
- 0.98% ✗
- Cap rate
- 7.91%
- Cash-on-cash
- 5.79%
- DSCR
- 1.26
- GRM
- 8.5
CMA / ARV
- ARV (on-the-fly)
- $142,662
- Comps found
- 12
Show comp detail 12 sales within ~0.75 mi
| Address | Dist | Beds/Ba | Sqft | Sold | Price | $/sf | Match |
|---|---|---|---|---|---|---|---|
| 420 Wheeler St SW | 0.39mi | 3/1.0 | 1,220 (+1%) | 7mo | $113,400 | $93 | 74 |
| 1002 SW Howard St | 0.14mi | 2/1.0 (-1) | 1,056 (-13%) | 0mo | $125,000 | $118 | 67 |
| 909 SE D St | 0.66mi | 3/1.0 | 1,181 (-2%) | 10mo | $142,500 | $121 | 57 |
| 526 H St SW | 0.27mi | 4/1.5 (+1) | 1,373 (+14%) | 5mo | $144,900 | $106 | 54 |
| 923 3rd SW | 0.55mi | 2/1.0 (-1) | 1,156 (-4%) | 11mo | $125,000 | $108 | 52 |
| 816 Harbin | 0.26mi | 3/2.0 | 1,388 (+15%) | 10mo | $220,000 | $159 | 51 |
| 912 P SW | 0.56mi | 3/2.0 | 1,356 (+12%) | 9mo | $145,000 | $107 | 42 |
| 225 SW A St | 0.68mi | 3/2.0 | 1,284 (+6%) | 18mo | $177,500 | $138 | 39 |
| 1004 Mclish St | 0.74mi | 2/2.0 (-1) | 1,316 (+9%) | 11mo | $190,000 | $144 | 33 |
| 1906 Mockingbird | 0.74mi | 3/1.0 | 1,366 (+13%) | 14mo | $135,900 | $99 | 32 |
| 1112 Bixby St | 0.68mi | 2/2.0 (-1) | 1,358 (+12%) | 10mo | $154,000 | $113 | 30 |
| 1006 Mclish | 0.74mi | 2/2.0 (-1) | 1,366 (+13%) | 8mo | $177,500 | $130 | 28 |
Match score weights: distance 35% · size 25% · config 20% · recency 20%. Top-matched comps best support the ARV.
Projected returns pro-forma
-3.0% appreciation · 7.38% rent growth · sell at horizon
- IRR
- -2.8%
- Equity multiple
- 0.89×
- Total profit
- $-4,536
- Equity at exit
- $21,620
- IRR
- 10.9%
- Equity multiple
- 2.02×
- Total profit
- $41,245
- Equity at exit
- $12,537
Cash invested: $40,600 (down + closing). Projections, not guarantees.
Landlord ↔ Tenant lean methodology
- Overall (STATE)
- 83 Strongly Landlord-Friendly
- State Oklahoma
- 83 Strongly Landlord-Friendly · R+20
- County
- — inherits STATE
- City
- — inherits STATE
ZIP-level market 73401
- Home prices YoY
- -21.7%
- Rents YoY
- 7.4%
- Active inventory
- 382
- Price-to-rent
- 8.5×
Monthly cashflow live
- Estimated rent
- $1,415 medium interval (Pro) →
- Mortgage (P&I)
- −$760
- Tax from tax record
- −$101 /mo · $1,210/yr
- Insurance
- −$60
- HOA
- −$0
- Vacancy / Maint / Mgmt
- −$297
- Net cashflow
- $196
Break-even live
Sensitivity live
| Price | -10% $278 | -5% $237 | +0% $196 | +5% $155 | +10% $114 |
|---|---|---|---|---|---|
| Rent | -10% $84 | -5% $140 | +0% $196 | +5% $252 | +10% $308 |
| Rate | -1.0pp $269 | -0.5pp $233 | base $196 | +0.5pp $158 | +1.0pp $120 |
UW: 25.0% down · 7.5% · 30yr · 1.5% tax · 5.0% vac · 8.0% maint · 8.0% mgmt
Financing live
Cash to close
- Down payment
- $36,250
- Closing costs
- $4,350
- Reserves months
- —
- Total cash needed
- —
Loan-product check · same deal, 3 products live
Conventional
25% down · 7.5% · 30yr
- Down + closing
- —
- Monthly P&I
- —
- Monthly cashflow
- —
- DSCR
- —
- Eligible?
- —
Personal DTI + credit; lowest rate.
DSCR
20% down · 8.5% · 30yr
- Down + closing
- —
- Monthly P&I
- —
- Monthly cashflow
- —
- DSCR
- —
- Eligible?
- —
No personal income docs; deal must DSCR.
Hard money
10% down · 12.0% · 12mo
- Down + closing
- —
- Monthly P&I
- —
- Monthly cashflow
- —
- DSCR
- —
- Eligible?
- —
Short-term bridge; refi at stabilization.
Listing history 38 events
-
2026-06-12statusdays on market $145,000 Pending 70 DOM
-
2026-06-09days on market $145,000 Active 69 DOM
-
2026-06-08days on market $145,000 Active 68 DOM
-
2026-06-07pricedays on market $145,000 Active 67 DOM
-
2026-06-05days on market $155,000 Active 64 DOM
-
2026-06-03days on market $155,000 Active 63 DOM
-
2026-06-02days on market $155,000 Active 62 DOM
-
2026-06-01days on market $155,000 Active 61 DOM
-
2026-05-31days on market $155,000 Active 60 DOM
-
2026-05-30days on market $155,000 Active 59 DOM
-
2026-04-01historical
-
2026-04-01$155,000 Active
-
2026-01-07status Active
-
2025-11-03status Pending
-
2025-10-03$155,000 Active
-
2025-10-01historical
-
2025-06-05price $155,000
-
2025-03-30$159,000 Active
-
2023-11-20soldstatus $145,000
-
2023-11-13soldstatus $145,000 Closed
-
2023-10-02status Pending
-
2023-09-20price $149,500
-
2023-09-18price $151,900
-
2023-09-05price $154,000
-
2023-08-16price $155,900
-
2023-08-08status Active
-
2023-07-28status Pending
-
2023-07-27$159,900 Active
-
2023-04-24soldstatus $130,000 Closed
-
2023-03-22status Pending
-
2023-03-18price $135,000
-
2023-03-10price $145,000
-
2023-03-07$149,000 Active
-
2020-01-29soldstatus $80,000
-
2020-01-28soldstatus $80,000
-
2020-01-12$80,000
-
2008-07-18soldstatus $60,000
-
2001-10-08soldstatus $34,000
ⓘ Source: listings_history table (triggers on properties + properties_extension) + one-shot
backfill from property_details.listing_events for pre-trigger history.
Tax reassessment forecast OK · Resets to sale price
- Current annual tax
- $1,210 · $101/mo
- Projected year-2 tax
- $1,305 · $109/mo
- Expected delta
- +$95/yr (+$8/mo · 7.9%)
ⓘ Screening estimate from a state-policy table — verify with the county assessor before closing.
Climate risk First Street
- Flood 1/10 Low FEMA zone X (unshaded) · 0% chance over 30 yrs
- Wildfire 5/10 Major
- Heat 6/10 Major 7 d/yr ≥112°F today · 20 d/yr by 30 yrs out
- Wind 4/10 Moderate 11% chance of damaging wind over 30 yrs
- Air quality 3/10 Moderate 2 unhealthy d/yr today · 3 by 30 yrs out
Nearby sold comps map
Loading sold comps map…
Walkable amenities ~0.75 mi
Loading nearby amenities…
Taxation est. · year 1
- Rental income
- $16,976
- − Mortgage interest
- −$8,122
- − Property taxes
- −$1,210
- − Insurance
- −$725
- − Repairs & maintenance
- −$1,358
- − Management
- −$1,358
- − Depreciation
- −$4,218
- Taxable loss
- −$16
- Est. tax savings @ 24.0%
- +$4
- After-tax cash flow
- $2,355/yr
For passive investors: Depreciation is non-cash, so a rental often shows a tax loss while cash-flowing — sheltering income. Rental losses are passive: they offset passive income freely, and up to $25,000/yr can offset ordinary (W-2) income if you actively participate and your MAGI is under $100k (phasing out to $0 by $150k); unused losses carry forward. On sale, claimed depreciation is recaptured at up to 25%, and gains may owe capital-gains tax (a 1031 exchange can defer both). Figures are a year-1 estimate at your 24.0% rate — not tax advice; consult a CPA.
Schools (NCES district)
- District
- Ardmore
- NCES district ID
- 4003180
- Math proficiency
- 12% ▼ -7.00%
- Reading proficiency
- 15% ▼ -6.00%
- Median HH income
- $35,194
- Composite
- 11.1/100
- National rank
- #9733
- State rank
- #241 of 270 in OK
Livability — Ardmore
- Score
- 58/100
- State rank
- #447
- US rank
- #21387
Category grades
Schools grade is shown separately in the Schools card above.
Census & demographics
- Census place
- Ardmore, OK
- County
- Carter County · 36,833 people
- City population
- 36,833
- Metro
- Ardmore, OK
- Population (ZIP)
- 36,833
- Household income
- $61,989
- Rent vs Own
- Severe rent burden
- 1026.0
Population outlook (Carter County) Hauer SSP2
- Today (2025)
- 50,892 people
- By 2030
- 51,913 · +2.0%
- By 2040
- 53,857 · +5.8%
- By 2050
- 55,604 · +9.3%
- By 2075
- 60,670 · +19.2%
- By 2100
- 62,366 · +22.5%
Race, ethnicity, and origin ACS 2023
- Neighborhood character
- Diverse neighborhood (Simpson 0.57)
- Race & ethnicity
- White 65% Two or more races 14% Hispanic / Latino 9% Native American 8% Black 7% Asian 1%
- Hispanic origin (detail)
- Mexican 7%
- Common ancestry
- Slovak 2% Lithuanian 1% Italian 1%
- Foreign-born
- 4% · Canada
- Languages at home
- 92% English-only · Spanish 5%
Political lean MEDSL · Carter
- 2024 margin
- Solid R (+54.7) · D 21.9% · R 76.7% · Other 1.4%
- 2008→2024 swing
- -14.2pp toward R · 2008: -40.5pp · 2024: -54.7pp
- All cycles
- 2024: R+54.7 2020: R+52.5 2016: R+52.6 2012: R+42.7 2008: R+40.5
Not yet ingested
- Civics
- —
Market trends
- HPI YoY
- ▼ -74.93%
- Current HPI
- 269.7381
- Rent YoY
- ▲ 7.38%
- Metro
- Ardmore, OK
- State GDP YoY
- ▲ 1.55%
- F500 in state
- 6
Industry mix (Fortune 500 HQ in OK)
| Industry | F500 HQs | Revenue |
|---|---|---|
| Energy | 3 | $48B |
|
||
Price history
+355.9% since first listed28 events — show timeline
- 2026-04-01 Listed $155,000 MLS Technology, Inc.
- 2026-04-01 Listing Removed — MLS Technology, Inc.
- 2026-01-07 Relisted — MLS Technology, Inc.
- 2025-11-03 Pending — MLS Technology, Inc.
- 2025-10-03 Listed $155,000 MLS Technology, Inc.
- 2025-10-01 Listing Removed — MLS Technology, Inc.
- 2025-06-05 Price Changed $155,000 MLS Technology, Inc.
- 2025-03-30 Listed $159,000 MLS Technology, Inc.
- 2023-11-20 Sold (Public Records) $145,000 Public Records
- 2023-11-13 Sold (MLS) $145,000 MLS Technology, Inc.
- 2023-10-02 Pending — MLS Technology, Inc.
- 2023-09-20 Price Changed $149,500 MLS Technology, Inc.
- 2023-09-18 Price Changed $151,900 MLS Technology, Inc.
- 2023-09-05 Price Changed $154,000 MLS Technology, Inc.
- 2023-08-16 Price Changed $155,900 MLS Technology, Inc.
- 2023-08-08 Relisted — MLS Technology, Inc.
- 2023-07-28 Pending — MLS Technology, Inc.
- 2023-07-27 Listed $159,900 MLS Technology, Inc.
- 2023-04-24 Sold (MLS) $130,000 MLS Technology, Inc.
- 2023-03-22 Pending — MLS Technology, Inc.
- 2023-03-18 Price Changed $135,000 MLS Technology, Inc.
- 2023-03-10 Price Changed $145,000 MLS Technology, Inc.
- 2023-03-07 Listed $149,000 MLS Technology, Inc.
- 2020-01-29 Sold (Public Records) $80,000 Public Records
- 2020-01-28 Sold (MLS) $80,000 MLS Technology, Inc.
- 2020-01-12 Listed $80,000 MLS Technology, Inc.
- 2008-07-18 Sold (Public Records) $60,000 Public Records
- 2001-10-08 Sold (Public Records) $34,000 Public Records
Property tax history
+8.0%/yrLatest (2025): $1,210 · -30.3% YoY. Source: county tax records.
Cash-flow waterfall
monthlySold comps — $/sqft
last 12 mo · ≤1 miLoading sold comps…