 7-Plex
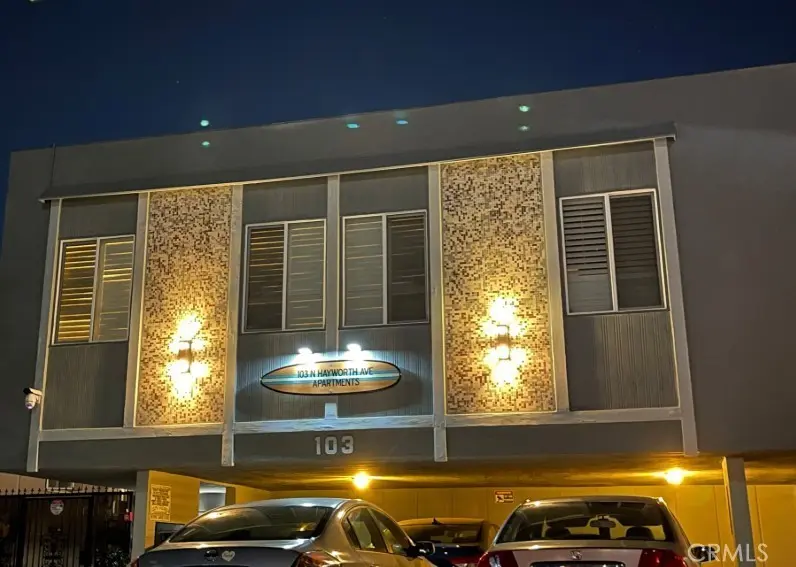
103 N Hayworth · Los Angeles, CA
Flood risk 1/10 · Minimal
- FEMA flood zone
- X (unshaded)
- Chance of flooding over 30 yrs
- 0.0%
- Est. flood insurance / yr
- $507 – $1,088
Fire risk 1/10 · Minimal
- Est. fire insurance / yr
- $659 – $1,223
Heat risk 6/10 · Moderate
- Hot days now (above 88°F)
- 7 days/yr
- Hot days in 30 yrs
- 22 days/yr
Wind risk 1/10 · Minimal
- Chance of severe wind over 30 yrs
- —
Air-quality risk 5/10 · Moderate
- Unhealthy air days now
- 7 days/yr
- Unhealthy air days in 30 yrs
- 7 days/yr
Risk factors via First Street. Map © Google.
Why this score? — see what drove the C grade
The composite is a weighted blend of 9 inputs, each scored 0–100. Each bar is that input's sub-score; the figure is the points it added to the 100-point composite (weight × sub-score).
- Cash flow +20.5/30.0
- Appreciation +8.1/10.0
- ARV discount +7.5/15.0
- DSCR +6.5/10.0
- 1% rule +5.0/10.0
- Schools +3.6/10.0
- Livability +3.4/5.0
- Rent growth +2.5/5.0
- Condition / age +2.5/5.0
$3,100,000
🖨 Deal sheet (PDF) 📄 Offer letter ✓ Due diligence
Multi-family units
County records classify this as Multi-Family (5+ Unit). Listing-text estimate: 7 units. confirmed
5+ unit building — per-unit beds/baths from public records are typically unavailable; the breakdown below (if shown) is an estimate from the listing text.
Listing remarks MLS
Located in the highly desirable neighborhood of Los Angeles, the Beverly Grove area , 103 N Hayworth has undergone an extensive redevelopment, featuring significant repairs and upgrades to both the building exterior and common areas. The property is now fully remodeled, offering improved functionality, modernized systems, and enhanced curb appeal. Five of the seven units have been completely gutted and thoughtfully remodeled with contemporary design and premium finishes throughout. Renovations include upgraded electrical and plumbing systems, new flooring, windows, custom blinds, and stainless steel appliances. Each renovated unit offers new custom kitchen cabinetry with granite countertops, modern lighting, spacious open-concept layouts, and beautifully tiled custom bathrooms. Additional improvements include new natural gas tankless water heater for the building. Exterior enhancements include fresh paint, new iron security gate doors, and a security camera system. Four units have also received new electrical panels. Residents benefit from additional amenities such as a dedicated community laundry room and a landscaped backyard featuring an elegant gazebo with table and chairs, creating an inviting outdoor space for relaxation and entertaining.
Key facts
- New flooring
- Custom blinds
- New windows
Tags
Neighborhood map
What this means for you Summary
Snapshot
- This is a 7 × 10-bed/9.0-bath units multifamily listed at $3.10M.
Deal economics
- At list price, monthly cash flow is $4k ($49k/yr) — positive. Per door: $582/mo.
- The deal already cash-flows at list — no discount required.
- Meets the 1% rule at list price ($31k rent vs $3.10M).
- Recommended offer: $3.05M (1.5% below list) — sets the bar for market timing.
- Cap rate 7.9% vs local median 2.1% in Los Angeles — top-decile yield for the area; either an underpriced asset or a hidden risk that comps aren't pricing in. Stress-test before assuming the spread holds.
Location & tenants
- Location reads 68/100 on livability (#273 in CA) — a middle-class / working-renter tenant base. Strengths: amenities A+, commute A+, employment B; Watch: health & safety C-, schools D+, crime F.
- Los Angeles Unified (urban): math 29% / reading 54% proficiency, ranked #223 of 517 in CA (top 43%) — families likely to look elsewhere, expect single-tenant / working-renter base with shorter leases; 67% free/reduced lunch — lower-income household profile, screen leases tightly.
- Market conditions: Rents flat; 122 active listings in the ZIP; solid renter incomes; 19,697 units permitted in Los Angeles County in 2024 (9,426 in 5+ unit buildings).
Forward outlook
- In year one you build about $215k of equity ($21k loan paydown + $194k appreciation (6.2% local appreciation)).
- Los Angeles County population projected at +9% by 2050 — modest demand growth; plan on rents tracking national, not racing it.
- At projected returns (6.2% appreciation + 0.1% rent growth), your $868k cash investment doubles in ~4 years — after that, you're playing with house money.
- By year 2, paydown + projected appreciation supports a ~$344k cash-out refi (75% LTV) — recoverable capital for the next deal without selling this one.
Negotiation context
- It's been on market 25 days — a 2% lower offer ($3.05M) is reasonable based on typical stale-listing flexibility.
- 7 sale attempts since 7y ago with the ask held roughly flat each time — persistent listings suggest the price (not the market) is what's stuck; bring a comps-based counter.
- Current owner paid $2.62M; 18% above their basis — modest negotiation headroom, anchor on the comps not their cost.
Risks & watch-outs
- Watch-outs: built in 1958 — expect roof / HVAC / electrical / plumbing capex.
- Climate carrying-cost: extreme-heat days projected 7→22/yr by 2055 (HVAC capex compounding) — expect insurance premiums to compound above CPI over the hold.
Questions for the listing agent
- Can we see the unit-by-unit rent roll, current vacancy, and any below-market leases? What's the average tenancy length?
- What capital expenditures (roof, boiler, parking lot, exteriors) have been made in the last 5 years, and what's planned in the next 2?
- Built in 1958 — when were the roof, HVAC, electrical panel, plumbing, and water heater last replaced?
- Is there a deadline driving the sale (1031 exchange, divorce, estate, relocation)? That informs how much negotiation room exists.
- Schools are D-rated, which usually means shorter tenancies and higher turnover. Who's the typical renter profile here, and what's been the actual vacancy rate?
- Crime grade is F in this area — have there been break-ins, vandalism, or insurance claims at this property in the last 3 years? What carrier currently insures it and at what premium?
- What's the average days-on-market for RENTAL listings here right now (not sales)? A rising rental-DOM trend means longer vacancies and softer asking-rent achievability than the comps imply.
- What's the recent tenant-quality profile in this submarket — average credit score on applications, eviction rate, late-payment / NSF rate, and stable-employment percentage? A property-management company in the area should have these aggregated.
- How much new apartment / multifamily construction is in the pipeline within 1–3 miles? Heavy new supply (>2% of stock underway) typically softens rents 12–24 months out; light construction supports rent growth.
Investment metrics
- 1% rule
- 1.00% ✓
- Cap rate
- 7.87%
- Cash-on-cash
- 5.63%
- DSCR
- 1.25
- GRM
- 8.3
CMA / ARV
- ARV (median comp)
- $2,048,186
- List price
- $3,100,000
- Delta
- 51.35%
- Verdict
- OVERPRICED
- Comps
- 20 within 1.0 mi
Projected returns pro-forma
6.25% appreciation · 0.14% rent growth · sell at horizon
- IRR
- 19.2%
- Equity multiple
- 2.28×
- Total profit
- $1,112,564
- Equity at exit
- $1,996,828
- IRR
- 17.6%
- Equity multiple
- 4.34×
- Total profit
- $2,900,863
- Equity at exit
- $3,663,357
Cash invested: $868,000 (down + closing). Projections, not guarantees.
Landlord ↔ Tenant lean methodology
- Overall (CITY)
- 0 Strongly Tenant-Friendly
- State California
- 18 Strongly Tenant-Friendly · D+13
- County
- — inherits STATE
- City Los Angeles
- 0 Strongly Tenant-Friendly · D+22
ZIP-level market 90048
- Home prices YoY
- 1.3%
- Rents YoY
- 0.1%
- Active inventory
- 122
- Price-to-rent
- 58.2×
Monthly cashflow live
- Estimated rent
- $31,089 medium interval (Pro) →
- Mortgage (P&I)
- −$16,257
- Tax from tax record
- −$2,938 /mo · $35,260/yr
- Insurance
- −$1,292
- HOA
- −$0
- Vacancy / Maint / Mgmt
- −$6,529
- Net cashflow
- $4,074
Break-even live
Sensitivity live
| Price | -10% $5,828 | -5% $4,951 | +0% $4,074 | +5% $3,196 | +10% $2,319 |
|---|---|---|---|---|---|
| Rent | -10% $1,618 | -5% $2,846 | +0% $4,074 | +5% $5,302 | +10% $6,530 |
| Rate | -1.0pp $5,635 | -0.5pp $4,862 | base $4,074 | +0.5pp $3,270 | +1.0pp $2,453 |
7-unit breakdown (identical units grouped — click to expand)
| Units | Beds | Baths | Est. rent |
|---|---|---|---|
| 7× units | 10 | 9 | $31,087 |
| #1 | 10 | 9 | $4,441 |
| #2 | 10 | 9 | $4,441 |
| #3 | 10 | 9 | $4,441 |
| #4 | 10 | 9 | $4,441 |
| #5 | 10 | 9 | $4,441 |
| #6 | 10 | 9 | $4,441 |
| #7 | 10 | 9 | $4,441 |
| Total (7 units) | $31,089 | ||
UW: 25.0% down · 7.5% · 30yr · 1.5% tax · 5.0% vac · 8.0% maint · 8.0% mgmt
Financing live
Cash to close
- Down payment
- $775,000
- Closing costs
- $93,000
- Reserves months
- —
- Total cash needed
- —
Loan-product check · same deal, 3 products live
Conventional
25% down · 7.5% · 30yr
- Down + closing
- —
- Monthly P&I
- —
- Monthly cashflow
- —
- DSCR
- —
- Eligible?
- —
Personal DTI + credit; lowest rate.
DSCR
20% down · 8.5% · 30yr
- Down + closing
- —
- Monthly P&I
- —
- Monthly cashflow
- —
- DSCR
- —
- Eligible?
- —
No personal income docs; deal must DSCR.
Hard money
10% down · 12.0% · 12mo
- Down + closing
- —
- Monthly P&I
- —
- Monthly cashflow
- —
- DSCR
- —
- Eligible?
- —
Short-term bridge; refi at stabilization.
Listing history 21 events
-
2026-06-09days on market $3,100,000 Active 25 DOM
-
2026-06-08days on market $3,100,000 Active 24 DOM
-
2026-06-07days on market $3,100,000 Active 23 DOM
-
2026-06-04days on market $3,100,000 Active 20 DOM
-
2026-06-03days on market $3,100,000 Active 19 DOM
-
2026-06-02days on market $3,100,000 Active 18 DOM
-
2026-06-01days on market $3,100,000 Active 17 DOM
-
2026-05-31days on market $3,100,000 Active 16 DOM
-
2026-05-15$3,100,000 Active 1266-char remark
Show marketing remark (1266 chars)
Located in the highly desirable neighborhood of Los Angeles, the Beverly Grove area , 103 N Hayworth has undergone an extensive redevelopment, featuring significant repairs and upgrades to both the building exterior and common areas. The property is now fully remodeled, offering improved functionality, modernized systems, and enhanced curb appeal. Five of the seven units have been completely gutted and thoughtfully remodeled with contemporary design and premium finishes throughout. Renovations include upgraded electrical and plumbing systems, new flooring, windows, custom blinds, and stainless steel appliances. Each renovated unit offers new custom kitchen cabinetry with granite countertops, modern lighting, spacious open-concept layouts, and beautifully tiled custom bathrooms. Additional improvements include new natural gas tankless water heater for the building. Exterior enhancements include fresh paint, new iron security gate doors, and a security camera system. Four units have also received new electrical panels. Residents benefit from additional amenities such as a dedicated community laundry room and a landscaped backyard featuring an elegant gazebo with table and chairs, creating an inviting outdoor space for relaxation and entertaining.
-
2025-06-26Active
-
2025-06-20historical $3,295
-
2025-06-12$3,295
-
2021-07-30status Active
-
2021-07-26status Active
-
2021-07-04historical Backup Offers Accepted
-
2021-05-14price
-
2021-03-27Active
-
2020-01-02status Pending
-
2020-01-02soldstatus $2,620,000 Sold
-
2019-12-27soldstatus $2,620,000
-
2019-09-05$2,795,000 Active
ⓘ Source: listings_history table (triggers on properties + properties_extension) + one-shot
backfill from property_details.listing_events for pre-trigger history.
Tax reassessment forecast CA · Resets to sale price
- Current annual tax
- $35,260 · $2,938/mo
- Projected year-2 tax
- $35,260 · $2,938/mo
- Expected delta
- $0/yr ($0/mo · 0.0%)
ⓘ Screening estimate from a state-policy table — verify with the county assessor before closing.
Climate risk First Street
- Flood 1/10 Low FEMA zone X (unshaded) · 0% chance over 30 yrs
- Wildfire 1/10 Low
- Heat 6/10 Major 7 d/yr ≥88°F today · 22 d/yr by 30 yrs out
- Wind 1/10 Low
- Air quality 5/10 Major 7 unhealthy d/yr today · 7 by 30 yrs out
Nearby sold comps map
Loading sold comps map…
Walkable amenities ~0.75 mi
Loading nearby amenities…
Taxation est. · year 1
- Rental income
- $373,068
- − Mortgage interest
- −$173,648
- − Property taxes
- −$35,260
- − Insurance
- −$15,500
- − Repairs & maintenance
- −$29,845
- − Management
- −$29,845
- − Depreciation
- −$90,182
- Taxable loss
- −$1,212
- Est. tax savings @ 24.0%
- +$291
- After-tax cash flow
- $49,174/yr
For passive investors: Depreciation is non-cash, so a rental often shows a tax loss while cash-flowing — sheltering income. Rental losses are passive: they offset passive income freely, and up to $25,000/yr can offset ordinary (W-2) income if you actively participate and your MAGI is under $100k (phasing out to $0 by $150k); unused losses carry forward. On sale, claimed depreciation is recaptured at up to 25%, and gains may owe capital-gains tax (a 1031 exchange can defer both). Figures are a year-1 estimate at your 24.0% rate — not tax advice; consult a CPA.
Schools (NCES district)
- District
- Los Angeles Unified
- NCES district ID
- 0622710
- Math proficiency
- 29% ▼ -4.00%
- Reading proficiency
- 54% ▲ 10.00%
- Median HH income
- $50,403
- Composite
- 35.67/100
- National rank
- #4875
- State rank
- #223 of 517 in CA
Livability — Los Angeles
- Score
- 68/100
- State rank
- #273
- US rank
- #9237
Category grades
Schools grade is shown separately in the Schools card above.
Census & demographics
- Census place
- Los Angeles, CA
- County
- Los Angeles County · 9,444,647 people
- City population
- 3,838,149
- Metro
- Los Angeles-Long Beach-Anaheim, CA
- Population (ZIP)
- 21,476
- Household income
- $103,495
- Rent vs Own
- Severe rent burden
- 2888.0
Population outlook (Los Angeles County) Hauer SSP2
- Today (2025)
- 10,940,515 people
- By 2030
- 11,256,481 · +2.9%
- By 2040
- 11,729,929 · +7.2%
- By 2050
- 11,948,407 · +9.2%
- By 2075
- 11,818,114 · +8.0%
- By 2100
- 10,842,928 · -0.9%
Race, ethnicity, and origin ACS 2023
- Neighborhood character
- Predominantly White (73%)
- Race & ethnicity
- White 73% Two or more races 9% Asian 8% Hispanic / Latino 8% Black 5%
- Hispanic origin (detail)
- Mexican 3%
- Common ancestry
- Romanian 5% Scotch-Irish 4% Lithuanian 3%
- Foreign-born
- 27% · Canada, China, South Korea
- Languages at home
- 74% English-only · Other Indo-European 7% Spanish 5% Russian/Polish/Slavic 2%
Political lean MEDSL · Los Angeles
- 2024 margin
- Solid D (+32.9) · D 64.8% · R 31.9% · Other 3.3%
- 2008→2024 swing
- -7.4pp toward R · 2008: 40.4pp · 2024: 32.9pp
- All cycles
- 2024: D+32.9 2020: D+44.2 2016: D+48.0 2012: D+40.0 2008: D+40.4
Not yet ingested
- Civics
- —
Market trends
- HPI YoY
- ▲ 6.25%
- Current HPI
- 500.5893
- Rent YoY
- ▲ 0.14%
- Metro
- Los Angeles-Long Beach-Anaheim, CA
- State GDP YoY
- ▲ 3.21%
- F500 in state
- 116
Industry mix (Fortune 500 HQ in CA)
| Industry | F500 HQs | Revenue |
|---|---|---|
| Technology | 27 | $1,492B |
|
||
| Financial Services | 3 | $174B |
|
||
| Retail | 3 | $44B |
|
||
| Insurance | 3 | $26B |
|
||
| Media / Entertainment | 2 | $115B |
|
||
| Pharmaceuticals / Biotech | 2 | $62B |
|
||
Price history
+10.9% since first listed13 events — show timeline
- 2026-05-15 Listed $3,100,000 CRMLS
- 2025-06-26 Listed — TheMLS
- 2025-06-20 Rental Removed $3,295 CRMLS
- 2025-06-12 Listed for Rent $3,295 CRMLS
- 2021-07-30 Relisted — TheMLS
- 2021-07-26 Relisted — TheMLS
- 2021-07-04 Contingent — TheMLS
- 2021-05-14 Price Changed — TheMLS
- 2021-03-27 Listed — TheMLS
- 2020-01-02 Pending — TheMLS
- 2020-01-02 Sold (MLS) $2,620,000 TheMLS
- 2019-12-27 Sold (Public Records) $2,620,000 Public Records
- 2019-09-05 Listed $2,795,000 TheMLS
Property tax history
+15.8%/yrLatest (2025): $35,260 · +1.2% YoY. Source: county tax records.
Cash-flow waterfall
monthlySold comps — $/sqft
last 12 mo · ≤1 miLoading sold comps…