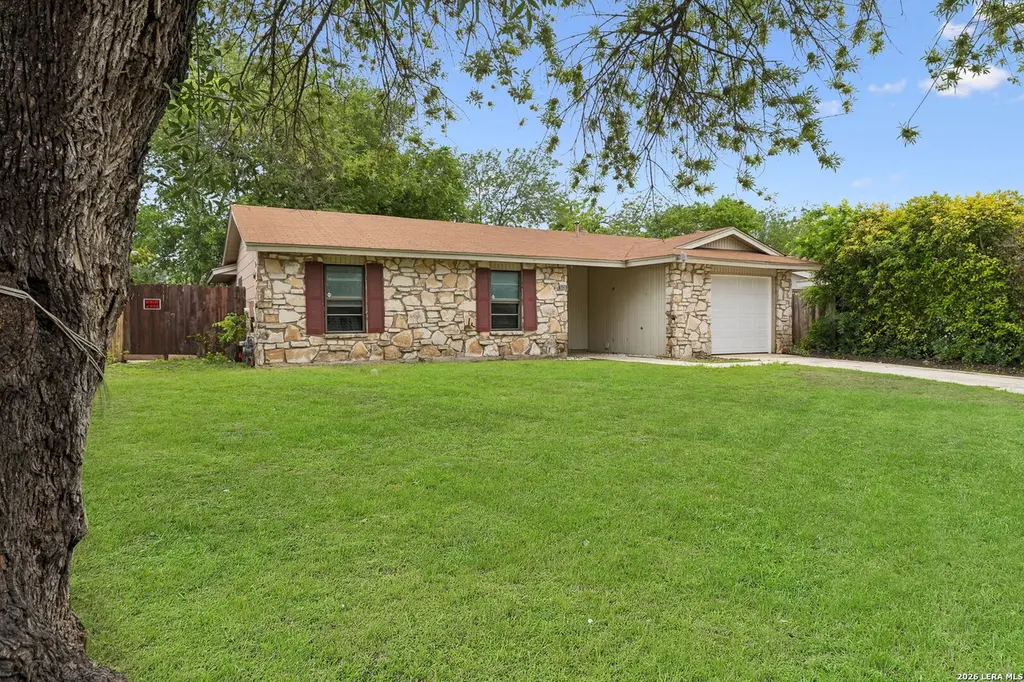
5026 Gene Cernan Dr · Kirby, TX
Flood risk 1/10 · Minimal
- FEMA flood zone
- X (unshaded)
- Chance of flooding over 30 yrs
- 0.0%
- Est. flood insurance / yr
- $507 – $1,088
Fire risk 1/10 · Minimal
- Est. fire insurance / yr
- $1,222 – $2,270
Heat risk 8/10 · Major
- Hot days now (above 108°F)
- 7 days/yr
- Hot days in 30 yrs
- 22 days/yr
Wind risk 8/10 · Major
- Chance of severe wind over 30 yrs
- 80.0%
Air-quality risk 2/10 · Minimal
- Unhealthy air days now
- 0 days/yr
- Unhealthy air days in 30 yrs
- 1 days/yr
Risk factors via First Street. Map © Google.
Why this score? — see what drove the C+ grade
The composite is a weighted blend of 9 inputs, each scored 0–100. Each bar is that input's sub-score; the figure is the points it added to the 100-point composite (weight × sub-score).
- Cash flow +16.4/30.0
- ARV discount +13.8/15.0
- Appreciation +6.4/10.0
- 1% rule +5.8/10.0
- DSCR +5.1/10.0
- Rent growth +4.4/5.0
- Livability +3.2/5.0
- Condition / age +2.5/5.0
- Schools +2.4/10.0
$154,999
🖨 Deal sheet 📄 Offer letter ✓ Due diligence
Listing remarks
An inviting home in the heart of Kirby offering comfort, space, and everyday convenience. This well-maintained property features a functional layout with generous living areas, great natural light, and plenty of room to make it your own. The kitchen flows seamlessly into the main living space, making it perfect for both daily living and entertaining. Enjoy a spacious backyard with endless potential-whether you're hosting, relaxing, or creating your ideal outdoor setup. Conveniently located with quick access to major highways, downtown San Antonio, JBSA Randolph, shopping, dining, and schools, this home puts you close to it all while still offering a quiet neighborhood feel. A great opportun
Key facts
- Great natural light
- Spacious backyard
- Functional layout
Tags
Property features AI
Finance
- HOA & community: Subdivision amenities include a pool and park/playground
Exterior
- Parking: Attached 1-car garage
- Utilities: City water and sewer
- Home design: Pre-owned single-family home; Slab entry level
- Construction: Stone/rock and siding exterior; Composition roof; Slab foundation; Approximately 55 years old
- Exterior features: Covered patio; Patio slab; Privacy fence; Mature trees; City view; Street paved with gutters and streetlights
Interior
- Kitchen: Gas cooking; Stove/Range; Solid countertops; Kitchen approx. 7 x 7
- Bedrooms: Master bedroom with full bath (master approx. 9 x 13); Bedroom 2 approx. 8 x 11; Bedroom 3 approx. 9 x 9; Bedroom 4 approx. 10 x 9
- Flooring: Ceramic tile; Linoleum
- Bathrooms: 2 full bathrooms; Master bath with shower only and single vanity (approx. 4 x 10)
- Heating & cooling: Central heating (electric); Central air conditioning
- Interior features: Ceiling fans; Smoke alarm; Garage door opener; Solid countertops; Separate dining room; Ground level / no steps; Cable TV available; High-speed internet; Some window coverings remain
- Laundry & utility: Washer connection; Dryer connection
Neighborhood map
What this means for you Summary
Snapshot
- This is a 4-bed/2.0-bath single-family listed at $155k.
Deal economics
- At list price, monthly cash flow is $89 ($1k/yr) — positive.
- The deal already cash-flows at list — no discount required.
- Meets the 1% rule at list price ($2k rent vs $155k).
- Recommended offer: $150k (3.0% below list) — sets the bar for market timing.
- Cap rate 7.0% vs local median 5.5% in Kirby — meaningfully above typical; check what's discounted (condition, days-on-market, listing class) to confirm the premium yield is real.
Location & tenants
- Location reads 64/100 on livability (#761 in TX) — a middle-class / working-renter tenant base. Strengths: cost of living A+, housing A+, health & safety B; Watch: crime F, amenities F, commute F.
- Judson ISD (suburban): math 21% / reading 33% proficiency, ranked #660 of 826 in TX (top 80%) — low school quality limits family demand, transient renter base, plan for 1-2y turnover.
- Zoned schools: Hopkins El (math 20% / reading 21%, grade F, #3,515 of 4,322 statewide, top 82%, 788 students, 84% FRL); Karen Wagner H S (math 12% / reading 29%, grade F, #1,389 of 1,632 statewide, top 86%, 2,366 students, 80% FRL) — zoned schools average 82% FRL vs 57% district-wide (25 pts higher); higher-poverty schools than district average — tighter screening recommended.
- Market conditions: Rents rising fast (+7.7%/yr); 66 active listings in the ZIP; 27 comparable units currently listed for rent nearby; rentals at typical pace (median 24d on market — plan ~3-4 weeks tenant-placement turnaround); 41% of comp listings sitting > 30 days — soft ceiling on asking rent; 8,308 units permitted in Bexar County in 2024 (2,506 in 5+ unit buildings).
Forward outlook
- In year one you build about $5k of equity ($1k loan paydown + $4k appreciation (2.7% local appreciation)).
- Bexar County population projected at +50% by 2050 — long-run rental-demand tailwind backs the buy-and-hold thesis.
- At projected returns (2.7% appreciation + 7.7% rent growth), your $43k cash investment doubles in ~5 years — after that, you're playing with house money.
- By year 7, paydown + projected appreciation supports a ~$34k cash-out refi (75% LTV) — recoverable capital for the next deal without selling this one.
Negotiation context
- It's been on market 43 days — a 3% lower offer ($150k) is reasonable based on typical stale-listing flexibility.
- Current owner paid $48k; list at $155k implies a 221% gain — meaningful room to come down on a strong offer.
Risks & watch-outs
- Watch-outs: property tax is 2.8% of price.
- Climate carrying-cost: severe wind risk, 80% chance of damaging wind over 30y; extreme-heat days projected 7→22/yr by 2055 (HVAC capex compounding) — expect insurance premiums to compound above CPI over the hold.
Questions for the listing agent
- It's been on market 43 days. Have you received any prior offers? Is the seller open to a 3% concession, seller financing, or rate buy-down credit?
- Built in 1971 — when were the roof, HVAC, electrical panel, plumbing, and water heater last replaced?
- Property tax is high relative to price — has the assessment been appealed recently, and will the sale trigger a re-assessment?
- Is there a deadline driving the sale (1031 exchange, divorce, estate, relocation)? That informs how much negotiation room exists.
- Schools are F-rated, which usually means shorter tenancies and higher turnover. Who's the typical renter profile here, and what's been the actual vacancy rate?
- Crime grade is F in this area — have there been break-ins, vandalism, or insurance claims at this property in the last 3 years? What carrier currently insures it and at what premium?
- What's the average days-on-market for RENTAL listings here right now (not sales)? A rising rental-DOM trend means longer vacancies and softer asking-rent achievability than the comps imply.
- What's the recent tenant-quality profile in this submarket — average credit score on applications, eviction rate, late-payment / NSF rate, and stable-employment percentage? A property-management company in the area should have these aggregated.
- How much new for-sale + rental construction is in the pipeline within 1–3 miles? Heavy new supply typically softens prices + rents 12–24 months out; constrained supply supports both.
Investment metrics
- 1% rule
- 1.08% ✓
- Cap rate
- 6.98%
- Cash-on-cash
- 2.47%
- DSCR
- 1.11
- GRM
- 7.7
CMA / ARV
- ARV (median comp)
- $180,206
- List price
- $154,999
- Delta
- -13.99%
- Verdict
- UNDERPRICED
- Comps
- 20 within 1.0 mi
Show comp detail 12 sales within ~0.75 mi
| Address | Dist | Beds/Ba | Sqft | Sold | Price | $/sf | Match |
|---|---|---|---|---|---|---|---|
| 5031 Gene Cernan Dr | 0.04mi | 4/2.0 | 1,055 (+2%) | 15mo | $125,000 | $118 | 82 |
| 3719 Autumn | 0.31mi | 3/2.0 (-1) | 1,050 (+2%) | 6mo | $203,000 | $193 | 73 |
| 5014 Cinderella | 0.12mi | 3/1.5 (-1) | 958 (-7%) | 8mo | $135,000 | $141 | 69 |
| 5239 Coral Mist | 0.37mi | 3/2.0 (-1) | 1,008 (-2%) | 13mo | $130,000 | $129 | 63 |
| 3414 Vinecrest | 0.50mi | 3/2.0 (-1) | 1,025 (-1%) | 12mo | $198,000 | $193 | 60 |
| 4814 Scott Carpenter Dr | 0.38mi | 3/2.0 (-1) | 1,110 (+8%) | 9mo | $189,900 | $171 | 58 |
| 4866 Aspen Wood | 0.55mi | 3/1.0 (-1) | 1,052 (+2%) | 6mo | $169,900 | $162 | 57 |
| 5130 Coral Mist | 0.25mi | 3/1.0 (-1) | 931 (-10%) | 13mo | $169,900 | $182 | 52 |
| 4916 Swann | 0.63mi | 3/2.0 (-1) | 1,108 (+7%) | 14mo | $215,000 | $194 | 42 |
| 5123 Alan Bean | 0.49mi | 3/2.0 (-1) | 1,173 (+14%) | 14mo | $217,500 | $185 | 38 |
| 2501 Telegraph | 0.67mi | 3/2.0 (-1) | 923 (-11%) | 12mo | $205,000 | $222 | 36 |
| 5230 Swann | 0.70mi | 3/1.0 (-1) | 888 (-14%) | 8mo | $105,000 | $118 | 28 |
Match score weights: distance 35% · size 25% · config 20% · recency 20%. Top-matched comps best support the ARV.
Projected returns pro-forma
2.73% appreciation · 7.72% rent growth · sell at horizon
- IRR
- 12.1%
- Equity multiple
- 1.71×
- Total profit
- $30,628
- Equity at exit
- $67,343
- IRR
- 17.2%
- Equity multiple
- 3.75×
- Total profit
- $119,390
- Equity at exit
- $101,991
Cash invested: $43,400 (down + closing). Projections, not guarantees.
Landlord ↔ Tenant lean methodology
- Overall (STATE)
- 87 Strongly Landlord-Friendly
- State Texas
- 87 Strongly Landlord-Friendly · R+5
- County
- — inherits STATE
- City
- — inherits STATE
ZIP-level market 78219
- Home prices YoY
- 0.8%
- Rents YoY
- 7.7%
- Active inventory
- 66
- Price-to-rent
- 7.7×
Monthly cashflow live
- Estimated rent
- $1,680 high interval (Pro) →
- Mortgage (P&I)
- −$813
- Tax from tax record
- −$361 /mo · $4,327/yr
- Insurance
- −$65
- HOA
- −$0
- Vacancy / Maint / Mgmt
- −$353
- Net cashflow
- $89
Break-even live
UW: 25.0% down · 7.5% · 30yr · 1.5% tax · 5.0% vac · 8.0% maint · 8.0% mgmt
Financing live
Cash to close
- Down payment
- $38,750
- Closing costs
- $4,650
- Reserves months
- —
- Total cash needed
- —
Loan-product check · same deal, 3 products live
Conventional
25% down · 7.5% · 30yr
- Down + closing
- —
- Monthly P&I
- —
- Monthly cashflow
- —
- DSCR
- —
- Eligible?
- —
Personal DTI + credit; lowest rate.
DSCR
20% down · 8.5% · 30yr
- Down + closing
- —
- Monthly P&I
- —
- Monthly cashflow
- —
- DSCR
- —
- Eligible?
- —
No personal income docs; deal must DSCR.
Hard money
10% down · 12.0% · 12mo
- Down + closing
- —
- Monthly P&I
- —
- Monthly cashflow
- —
- DSCR
- —
- Eligible?
- —
Short-term bridge; refi at stabilization.
Rent comps 27 comps
| Address | Beds | Baths | Sqft | Rent | $/sqft | DOM | Units | Dist |
|---|---|---|---|---|---|---|---|---|
| 5015 David Scott Dr San Antonio, TX | 3.0 | 2.0 | 1356 | $1,750 | $1.29 | 24d | 1 | 0.04mi |
| 5039 Ed White St Unit 78219 San Antonio, TX | 3.0 | 2.0 | 1145 | $1,600 | $1.40 | 4d | 1 | 0.14mi |
| 5003 Starfire St San Antonio, TX | 3.0 | 2.0 | 1277 | $1,650 | $1.29 | 4d | 1 | 0.17mi |
| 3407 Alan Shepard Dr San Antonio, TX | 3.0 | 2.0 | 1174 | $1,700 | $1.45 | 24d | 1 | 0.19mi |
| 3707 Autumn Ln San Antonio, TX | 3.0 | 2.0 | 1340 | $1,500 | $1.12 | 43d | 1 | 0.34mi |
| 5212 Vinecrest Cir San Antonio, TX | 3.0 | 2.5 | 1421 | $2,100 | $1.48 | 43d | 1 | 0.37mi |
| 2707 Alan Shepard Dr San Antonio, TX | 3.0 | 2.0 | 1285 | $1,900 | $1.48 | 43d | 1 | 0.53mi |
| 2540 Corian Glen Dr San Antonio, TX | 3.0 | 2.0 | 1178 | $1,300 | $1.10 | 22d | 1 | 0.63mi |
| 5405 Borchers Dr San Antonio, TX | 3.0 | 1.0 | 1024 | $1,295 | $1.26 | 2d | 1 | 0.78mi |
| 4819 Lunar San Antonio, TX | 3.0 | 2.0 | 1148 | $1,289 | $1.12 | 4d | 1 | 0.81mi |
| 4334 Hickory Hill Dr San Antonio, TX | 3.0 | 1.5 | 1129 | $1,550 | $1.37 | 11d | 1 | 0.93mi |
| 2644 Ackerman Rd San Antonio, TX | 1.0–3.0 | 1.0–2.0 | 853 | $1,230 | $1.44 | 43d | 1 | 1.01mi |
| 5719 Country Sun Dr San Antonio, TX | 3.0 | 2.0 | 1485 | $1,400 | $0.94 | 24d | 1 | 1.06mi |
| 4082 Sunrise Pass San Antonio, TX | 3.0 | 1.0 | 1125 | $1,355 | $1.20 | 4d | 1 | 1.25mi |
| 4066 Sunrise Pass San Antonio, TX | 3.0 | 2.0 | 977 | $1,550 | $1.59 | 4d | 1 | 1.25mi |
| 4102 Dakota Sun San Antonio, TX | 3.0 | 1.0 | 1202 | $1,350 | $1.12 | 43d | 1 | 1.30mi |
| 3669 Candlehead Ln San Antonio, TX | 3.0 | 2.5 | 1294 | $1,700 | $1.31 | 43d | 1 | 1.31mi |
| 5819 Woodhill San Antonio, TX | 3.0 | 2.0 | 1015 | $1,300 | $1.28 | 43d | 1 | 1.34mi |
| 4123 Frontier Sun San Antonio, TX | 3.0 | 2.0 | 1086 | $1,350 | $1.24 | 43d | 1 | 1.34mi |
| 4078 Enchanted Sun San Antonio, TX | 3.0 | 1.0 | 1056 | $1,250 | $1.18 | 24d | 1 | 1.37mi |
| 5414 Stoneshire San Antonio, TX | 3.0 | 2.0 | 1469 | $2,000 | $1.36 | 11d | 1 | 1.37mi |
| 4162 Frontier Sun San Antonio, TX | 3.0 | 2.5 | 1246 | $1,400 | $1.12 | 43d | 1 | 1.37mi |
| 5846 Sun Farm San Antonio, TX | 3.0 | 2.0 | 1168 | $1,425 | $1.22 | 24d | 1 | 1.40mi |
| 5840 Glacier Sun Dr San Antonio, TX | 3.0 | 2.0 | 1344 | $1,749 | $1.30 | 2d | 1 | 1.41mi |
| 4002 Fire Sun San Antonio, TX | 3.0 | 2.0 | 1004 | $1,800 | $1.79 | 24d | 1 | 1.43mi |
| 4619 Dietrich Rd San Antonio, TX | 1.0–3.0 | 1.0–1.5 | 775 | $999 | $1.29 | 43d | 1 | 1.46mi |
| 4047 Indian Sunrise San Antonio, TX | 3.0 | 1.0 | 1089 | $1,150 | $1.06 | 43d | 1 | 1.50mi |
Listing history 19 events
-
2026-06-18days on market $154,999 Active 43 DOM
-
2026-06-17days on market $154,999 Active 42 DOM
-
2026-06-16days on market $154,999 Active 41 DOM
-
2026-06-15days on market $154,999 Active 40 DOM
-
2026-06-13days on market $154,999 Active 38 DOM
-
2026-06-09days on market $154,999 Active 34 DOM
-
2026-06-08days on market $154,999 Active 33 DOM
-
2026-06-07days on market $154,999 Active 32 DOM
-
2026-06-04days on market $154,999 Active 29 DOM
-
2026-06-03statusdays on market $154,999 Active 28 DOM
-
2026-06-02days on market $154,999 Price Change 27 DOM
-
2026-06-01days on market $154,999 Price Change 26 DOM
-
2026-05-31days on market $154,999 Price Change 25 DOM
-
2026-05-06$164,999 New 787-char remark
-
2021-06-25soldstatus
-
2021-06-02soldstatus
-
2017-10-30soldstatus
-
1997-09-03soldstatus $48,358
-
1997-08-01soldstatus
ⓘ Source: listings_history table (triggers on properties + properties_extension) + one-shot
backfill from property_details.listing_events for pre-trigger history.
Tax reassessment forecast TX · Resets to sale price
- Current annual tax
- $4,327 · $361/mo
- Projected year-2 tax
- $4,327 · $361/mo
- Expected delta
- $0/yr ($0/mo · 0.0%)
ⓘ Screening estimate from a state-policy table — verify with the county assessor before closing.
Climate risk First Street
- Flood 1/10 Low FEMA zone X (unshaded) · 0% chance over 30 yrs
- Wildfire 1/10 Low
- Heat 8/10 Severe 7 d/yr ≥108°F today · 22 d/yr by 30 yrs out
- Wind 8/10 Severe 80% chance of damaging wind over 30 yrs
- Air quality 2/10 Low 0 unhealthy d/yr today · 1 by 30 yrs out
Nearby sold comps map
Loading sold comps map…
Walkable amenities ~0.75 mi
Loading nearby amenities…
Taxation est. · year 1
- Rental income
- $20,160
- − Mortgage interest
- −$8,682
- − Property taxes
- −$4,327
- − Insurance
- −$775
- − Repairs & maintenance
- −$1,613
- − Management
- −$1,613
- − Depreciation
- −$4,509
- Taxable loss
- −$1,359
- Est. tax savings @ 24.0%
- +$326
- After-tax cash flow
- $1,396/yr
For passive investors: Depreciation is non-cash, so a rental often shows a tax loss while cash-flowing — sheltering income. Rental losses are passive: they offset passive income freely, and up to $25,000/yr can offset ordinary (W-2) income if you actively participate and your MAGI is under $100k (phasing out to $0 by $150k); unused losses carry forward. On sale, claimed depreciation is recaptured at up to 25%, and gains may owe capital-gains tax (a 1031 exchange can defer both). Figures are a year-1 estimate at your 24.0% rate — not tax advice; consult a CPA.
Schools (NCES district)
- District
- Judson ISD
- NCES district ID
- 4824990
- Math proficiency
- 21% ▼ -21.00%
- Reading proficiency
- 33% ▼ -7.00%
- Median HH income
- $57,542
- Composite
- 24.39/100
- National rank
- #7689
- State rank
- #660 of 826 in TX
Livability — Kirby
- Score
- 64/100
- State rank
- #761
- US rank
- #13943
Category grades
Schools grade is shown separately in the Schools card above.
Census & demographics
- Census place
- Kirby, TX
- County
- Bexar County · 1,990,555 people
- Metro
- San Antonio-New Braunfels, TX
- Population (ZIP)
- 17,924
- Household income
- $52,094
- Rent vs Own
- Severe rent burden
- 852.0
Population outlook (Bexar County) Hauer SSP2
- Today (2025)
- 2,336,851 people
- By 2030
- 2,560,728 · +9.6%
- By 2040
- 3,020,569 · +29.3%
- By 2050
- 3,493,522 · +49.5%
- By 2075
- 4,668,459 · +99.8%
- By 2100
- 5,533,242 · +136.8%
Race, ethnicity, and origin ACS 2023
- Neighborhood character
- Diverse neighborhood (Simpson 0.63)
- Race & ethnicity
- Hispanic / Latino 53% Two or more races 27% Black 26% White 16% Asian 1%
- Hispanic origin (detail)
- Mexican 45%
- Common ancestry
- Lithuanian 1% Romanian 1% Slovak 1%
- Foreign-born
- 13% · Canada
- Languages at home
- 67% English-only · Spanish 31% Vietnamese 1%
Political lean MEDSL · Bexar
- 2024 margin
- Lean D (+9.8) · D 54.3% · R 44.6% · Other 1.1%
- 2008→2024 swing
- +4.2pp toward D · 2008: 5.6pp · 2024: 9.8pp
- All cycles
- 2024: D+9.8 2020: D+18.2 2016: D+13.5 2012: D+4.6 2008: D+5.6
Not yet ingested
- Civics
- —
Market trends
- HPI YoY
- ▲ 2.73%
- Current HPI
- 328.5107
- Rent YoY
- ▲ 7.72%
- Metro
- San Antonio-New Braunfels, TX
- State GDP YoY
- ▲ 3.95%
- F500 in state
- 110
Industry mix (Fortune 500 HQ in TX)
| Industry | F500 HQs | Revenue |
|---|---|---|
| Energy | 16 | $1,198B |
|
||
| Technology | 5 | $198B |
|
||
| Engineering / Construction | 4 | $72B |
|
||
| Energy Services | 3 | $60B |
|
||
| Utilities | 3 | $41B |
|
||
| Healthcare | 2 | $330B |
|
||
Price history
+220.5% since first listed7 events — show timeline
- 2026-05-23 Price Changed $154,999 LERA
- 2026-05-06 Listed $164,999 LERA
- 2021-06-25 Sold (Public Records) — Public Records
- 2021-06-02 Sold (Public Records) — Public Records
- 2017-10-30 Sold (Public Records) — Public Records
- 1997-09-03 Sold (Public Records) $48,358 Public Records
- 1997-08-01 Sold (Public Records) — Public Records
Property tax history
+11.6%/yrLatest (2025): $4,327 · +2.8% YoY. Source: county tax records.
Cash-flow waterfall
monthlySold comps — $/sqft
last 12 mo · ≤1 miLoading sold comps…