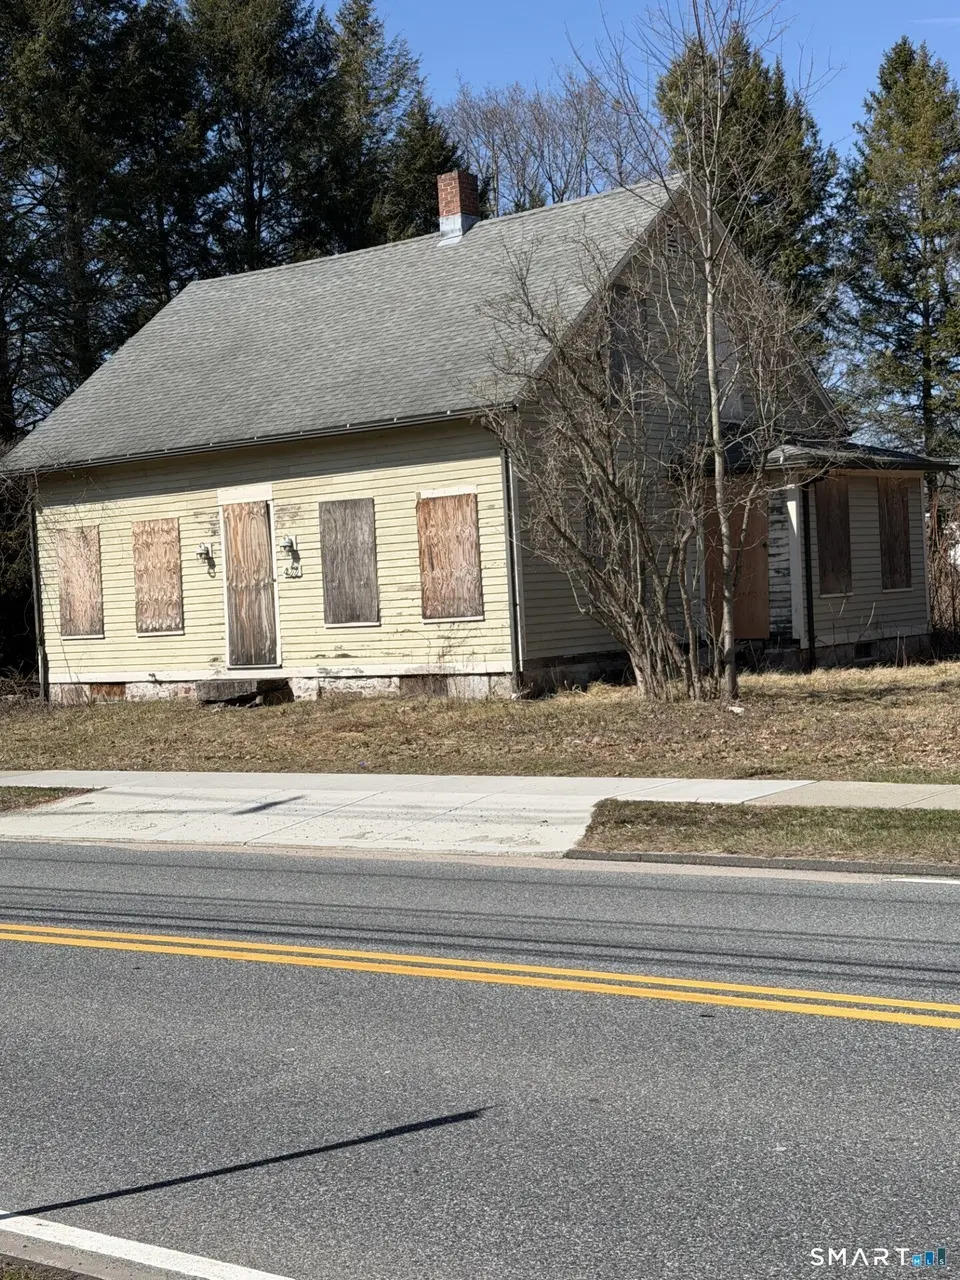
422 N Brooksvale Rd · Cheshire Village, CT
Flood risk 1/10 · Minimal
- FEMA flood zone
- X (unshaded)
- Chance of flooding over 30 yrs
- 0.0%
- Est. flood insurance / yr
- $473 – $860
Fire risk 3/10 · Minor
- Est. fire insurance / yr
- $829 – $1,539
Heat risk 6/10 · Moderate
- Hot days now (above 98°F)
- 8 days/yr
- Hot days in 30 yrs
- 18 days/yr
Wind risk 6/10 · Moderate
- Chance of severe wind over 30 yrs
- 27.0%
Air-quality risk 3/10 · Minor
- Unhealthy air days now
- 2 days/yr
- Unhealthy air days in 30 yrs
- 4 days/yr
Risk factors via First Street. Map © Google.
Why this score? — see what drove the B- grade
The composite is a weighted blend of 9 inputs, each scored 0–100. Each bar is that input's sub-score; the figure is the points it added to the 100-point composite (weight × sub-score).
- Cash flow +28.3/30.0
- DSCR +10.0/10.0
- 1% rule +8.3/10.0
- ARV discount +7.5/15.0
- Schools +6.5/10.0
- Livability +4.0/5.0
- Rent growth +2.5/5.0
- Condition / age +2.5/5.0
- Appreciation +0.0/10.0
$225,000
🖨 Deal sheet (PDF) 📄 Offer letter ✓ Due diligence
Listing remarks
Investors take notice. House needs total renovation. Being sold as is where is including contents. Cash Offers Only Highest and best offers by 4:00pm on Monday 3/30/2026
Key facts
- 0.46 acre lot
- Built 1860
- Listed 35 days
Property features AI
Finance
- Financial info: Assessed value available
Exterior
- Utilities: Public water connected; Public sewer connected; Sewer usage fee assessed annually
- Home design: Single-family home
- Construction: Frame construction; Concrete and stone foundation; Built before or by public records (living area listed)
- Exterior features: Level lot; Wood siding; Asphalt shingle roof
Interior
- Bedrooms: 3 bedrooms
- Heating & cooling: No heat; No hot water
- Interior features: 7 total rooms; Full basement; Attic with walk-up access
Neighborhood map
What this means for you Summary
Snapshot
- This is a 3-bed/?-bath single-family listed at $225k.
Deal economics
- At list price, monthly cash flow is $719 ($9k/yr) — positive.
- The deal already cash-flows at list — no discount required.
- Meets the 1% rule at list price ($3k rent vs $225k).
- Recommended offer: $218k (3.0% below list) — sets the bar for market timing.
- Cap rate 10.1% vs local median 2.3% in Cheshire Village — top-decile yield for the area; either an underpriced asset or a hidden risk that comps aren't pricing in. Stress-test before assuming the spread holds.
Location & tenants
- Location reads 79/100 on livability (#29 in CT, #2,087 nationally) — a middle-class / working-renter tenant base. Strengths: crime A+, employment A+, housing A+; Watch: amenities F, commute F, cost of living D-.
- Cheshire School District (suburban): math 64% / reading 76% proficiency, ranked #15 of 153 in CT (top 10%) — strong family-tenant draw, lease renewals of 3-5y typical; only 6% free/reduced lunch — higher-income household profile.
- Zoned schools: Norton School (math 73% / reading 81%, grade A, #28 of 553 statewide, top 7%, 429 students, 15% FRL); Dodd Middle School (math 61% / reading 73%, grade A-, #21 of 175 statewide, top 12%, 622 students, 16% FRL); Cheshire High School (math 46% / reading 73%, grade C+, #45 of 194 statewide, top 25%, 1,239 students, 16% FRL).
- Market conditions: 112 active listings in the ZIP; 1 comparable units currently listed for rent nearby; high-income renter base; 502 units permitted in Naugatuck Valley Planning Region in 2024 (171 in 5+ unit buildings).
Forward outlook
- Local home prices are declining (-3.0%/yr); year-one equity from $2k of loan paydown is wiped out by about $7k of value loss. Plan a longer hold.
- At projected returns (-3.0% appreciation + 3.0% rent growth), your $63k cash investment doubles in ~9 years — after that, you're playing with house money.
Negotiation context
- It's been on market 35 days — a 3% lower offer ($218k) is reasonable based on typical stale-listing flexibility.
- 2 sale attempts since 16y ago with the ask held roughly flat each time — persistent listings suggest the price (not the market) is what's stuck; bring a comps-based counter.
Risks & watch-outs
- Watch-outs: built in 1860 — expect roof / HVAC / electrical / plumbing capex.
- Climate carrying-cost: major wind risk, 27% chance of damaging wind over 30y; extreme-heat days projected 8→18/yr by 2055 (HVAC capex compounding) — expect insurance premiums to compound above CPI over the hold.
Questions for the listing agent
- It's been on market 35 days. Have you received any prior offers? Is the seller open to a 3% concession, seller financing, or rate buy-down credit?
- Built in 1860 — when were the roof, HVAC, electrical panel, plumbing, and water heater last replaced?
- Is there a deadline driving the sale (1031 exchange, divorce, estate, relocation)? That informs how much negotiation room exists.
- Schools are A-rated — typically a magnet for longer-tenancy family renters. What's the average tenant stay here, and is there a school-zone premium baked into asking?
- What's the average days-on-market for RENTAL listings here right now (not sales)? A rising rental-DOM trend means longer vacancies and softer asking-rent achievability than the comps imply.
- What's the recent tenant-quality profile in this submarket — average credit score on applications, eviction rate, late-payment / NSF rate, and stable-employment percentage? A property-management company in the area should have these aggregated.
- How much new for-sale + rental construction is in the pipeline within 1–3 miles? Heavy new supply typically softens prices + rents 12–24 months out; constrained supply supports both.
Investment metrics
- 1% rule
- 1.33% ✓
- Cap rate
- 10.13%
- Cash-on-cash
- 13.69%
- DSCR
- 1.61
- GRM
- 6.3
CMA / ARV
- ARV (on-the-fly)
- $468,600
- Comps found
- 10
Show comp detail 10 sales within ~0.75 mi
| Address | Dist | Beds/Ba | Sqft | Sold | Price | $/sf | Match |
|---|---|---|---|---|---|---|---|
| 31 Roslyn Dr | 0.25mi | 3/2.0 | 1,556 (-0%) | 10mo | $500,000 | $321 | 79 |
| 825 Farmington Dr | 0.33mi | 3/1.5 | 1,688 (+8%) | 1mo | $506,000 | $300 | 70 |
| 136 Crescent Cir | 0.20mi | 3/1.5 | 1,706 (+9%) | 9mo | $450,000 | $264 | 68 |
| 32 Rockview Dr | 0.34mi | 3/1.0 | 1,576 (+1%) | 18mo | $425,000 | $270 | 67 |
| 120 Hilltop Rd | 0.36mi | 3/2.0 | 1,564 (+0%) | 21mo | $465,000 | $297 | 65 |
| 143 Rockview Dr | 0.43mi | 3/1.0 | 1,416 (-9%) | 9mo | $430,000 | $304 | 57 |
| 7 Bayberry Rd | 0.42mi | 3/1.5 | 1,341 (-14%) | 1mo | $462,000 | $345 | 56 |
| 239 Bates Dr | 0.70mi | 3/2.5 | 1,646 (+5%) | 8mo | $370,000 | $225 | 52 |
| 1244 Long Hill Rd | 0.57mi | 3/1.5 | 1,356 (-13%) | 1mo | $457,000 | $337 | 50 |
| 278 Elmwood Cir | 0.74mi | 3/2.0 | 1,674 (+7%) | 23mo | $490,000 | $293 | 35 |
Match score weights: distance 35% · size 25% · config 20% · recency 20%. Top-matched comps best support the ARV.
Projected returns pro-forma
-3.0% appreciation · 3.0% rent growth · sell at horizon
- IRR
- 3.9%
- Equity multiple
- 1.15×
- Total profit
- $9,421
- Equity at exit
- $33,548
- IRR
- 13.4%
- Equity multiple
- 2.07×
- Total profit
- $67,552
- Equity at exit
- $19,454
Cash invested: $63,000 (down + closing). Projections, not guarantees.
Landlord ↔ Tenant lean methodology
- Overall (STATE)
- 27 Tenant-Leaning
- State Connecticut
- 27 Tenant-Leaning · D+7
- County
- — inherits STATE
- City
- — inherits STATE
ZIP-level market 06410
- Active inventory
- 112
- Price-to-rent
- 6.3×
Monthly cashflow live
- Estimated rent
- $2,986 medium interval (Pro) →
- Mortgage (P&I)
- −$1,180
- Tax from tax record
- −$366 /mo · $4,394/yr
- Insurance
- −$94
- HOA
- −$0
- Vacancy / Maint / Mgmt
- −$627
- Net cashflow
- $719
Break-even live
Sensitivity live
| Price | -10% $846 | -5% $783 | +0% $719 | +5% $655 | +10% $591 |
|---|---|---|---|---|---|
| Rent | -10% $483 | -5% $601 | +0% $719 | +5% $837 | +10% $955 |
| Rate | -1.0pp $832 | -0.5pp $776 | base $719 | +0.5pp $661 | +1.0pp $601 |
UW: 25.0% down · 7.5% · 30yr · 1.5% tax · 5.0% vac · 8.0% maint · 8.0% mgmt
Financing live
Cash to close
- Down payment
- $56,250
- Closing costs
- $6,750
- Reserves months
- —
- Total cash needed
- —
Loan-product check · same deal, 3 products live
Conventional
25% down · 7.5% · 30yr
- Down + closing
- —
- Monthly P&I
- —
- Monthly cashflow
- —
- DSCR
- —
- Eligible?
- —
Personal DTI + credit; lowest rate.
DSCR
20% down · 8.5% · 30yr
- Down + closing
- —
- Monthly P&I
- —
- Monthly cashflow
- —
- DSCR
- —
- Eligible?
- —
No personal income docs; deal must DSCR.
Hard money
10% down · 12.0% · 12mo
- Down + closing
- —
- Monthly P&I
- —
- Monthly cashflow
- —
- DSCR
- —
- Eligible?
- —
Short-term bridge; refi at stabilization.
Rent comps 1 comps
| Address | Beds | Baths | Sqft | Rent | $/sqft | DOM | Units | Dist |
|---|---|---|---|---|---|---|---|---|
| 85 Brentwood Dr Cheshire, CT | 4.0 | 3.0 | 2095 | $4,200 | $2.00 | 4d | 1 | 0.60mi |
Listing history 4 events
-
2026-04-29status Under Contract
-
2026-03-25$225,000 Active
-
2010-05-31historical
-
2010-02-03$259,900
ⓘ Source: listings_history table (triggers on properties + properties_extension) + one-shot
backfill from property_details.listing_events for pre-trigger history.
Tax reassessment forecast CT · Partial reset (capped growth)
- Current annual tax
- $4,394 · $366/mo
- Projected year-2 tax
- $4,604 · $384/mo
- Expected delta
- +$210/yr (+$18/mo · 4.8%)
ⓘ Screening estimate from a state-policy table — verify with the county assessor before closing.
Climate risk First Street
- Flood 1/10 Low FEMA zone X (unshaded) · 0% chance over 30 yrs
- Wildfire 3/10 Moderate
- Heat 6/10 Major 8 d/yr ≥98°F today · 18 d/yr by 30 yrs out
- Wind 6/10 Major 27% chance of damaging wind over 30 yrs
- Air quality 3/10 Moderate 2 unhealthy d/yr today · 4 by 30 yrs out
Nearby sold comps map
Loading sold comps map…
Walkable amenities ~0.75 mi
Loading nearby amenities…
Taxation est. · year 1
- Rental income
- $35,828
- − Mortgage interest
- −$12,603
- − Property taxes
- −$4,394
- − Insurance
- −$1,125
- − Repairs & maintenance
- −$2,866
- − Management
- −$2,866
- − Depreciation
- −$6,545
- Taxable income
- $5,428
- Est. tax owed @ 24.0%
- −$1,303
- After-tax cash flow
- $7,323/yr
For passive investors: Depreciation is non-cash, so a rental often shows a tax loss while cash-flowing — sheltering income. Rental losses are passive: they offset passive income freely, and up to $25,000/yr can offset ordinary (W-2) income if you actively participate and your MAGI is under $100k (phasing out to $0 by $150k); unused losses carry forward. On sale, claimed depreciation is recaptured at up to 25%, and gains may owe capital-gains tax (a 1031 exchange can defer both). Figures are a year-1 estimate at your 24.0% rate — not tax advice; consult a CPA.
Schools (NCES district)
- District
- Cheshire School District
- NCES district ID
- 0900750
- Math proficiency
- 64% ▼ -9.00%
- Reading proficiency
- 76% ▼ -6.00%
- Median HH income
- $107,049
- Composite
- 64.78/100
- National rank
- #519
- State rank
- #15 of 153 in CT
Livability — Cheshire Village
- Score
- 79/100
- State rank
- #29
- US rank
- #2087
Category grades
Schools grade is shown separately in the Schools card above.
Census & demographics
- County
- New Haven County · 688,236 people
- City population
- 28,792
- Metro
- New Haven-Milford, CT
- Population (ZIP)
- 28,904
- Household income
- $145,179
- Rent vs Own
- Severe rent burden
- 234.0
Population outlook (Naugatuck Valley County) Hauer SSP2
- By 2040
- 496,846
Race, ethnicity, and origin ACS 2023
- Neighborhood character
- Predominantly White (73%)
- Race & ethnicity
- White 73% Two or more races 10% Asian 10% Hispanic / Latino 7% Black 3%
- Hispanic origin (detail)
- Mexican 2% Puerto Rican 3%
- Common ancestry
- Romanian 6% Lithuanian 4% Scotch-Irish 3%
- Foreign-born
- 13% · China, Canada, South Korea
- Languages at home
- 85% English-only · Chinese 4% Other Indo-European 3% Spanish 3%
Political lean MEDSL · Naugatuck Valley
- 2024 margin
- Lean R (+7.4) · D 45.6% · R 53.0% · Other 1.4%
- All cycles
- 2024: R+7.4
Not yet ingested
- Civics
- —
Market trends
- HPI YoY
- ▼ -321.35%
- Current HPI
- 244.0737
- Rent YoY
- —
- Metro
- New Haven-Milford, CT
- State GDP YoY
- ▲ 1.06%
- F500 in state
- 38
Industry mix (Fortune 500 HQ in CT)
| Industry | F500 HQs | Revenue |
|---|---|---|
| Industrial Machinery | 4 | $38B |
|
||
| Insurance | 3 | $71B |
|
||
| Financial Services | 2 | $25B |
|
||
| Transportation / Logistics | 2 | $18B |
|
||
| Healthcare | 1 | $247B |
|
||
| Telecommunications | 1 | $55B |
|
||
Price history
-13.4% since first listed4 events — show timeline
- 2026-04-29 Pending — Smart MLS
- 2026-03-25 Listed $225,000 Smart MLS
- 2010-05-31 Listing Removed — Smart MLS
- 2010-02-03 Listed $259,900 Smart MLS
Property tax history
-0.4%/yrLatest (2023): $4,394 · +2.3% YoY. Source: county tax records.
Cash-flow waterfall
monthlySold comps — $/sqft
last 12 mo · ≤1 miLoading sold comps…