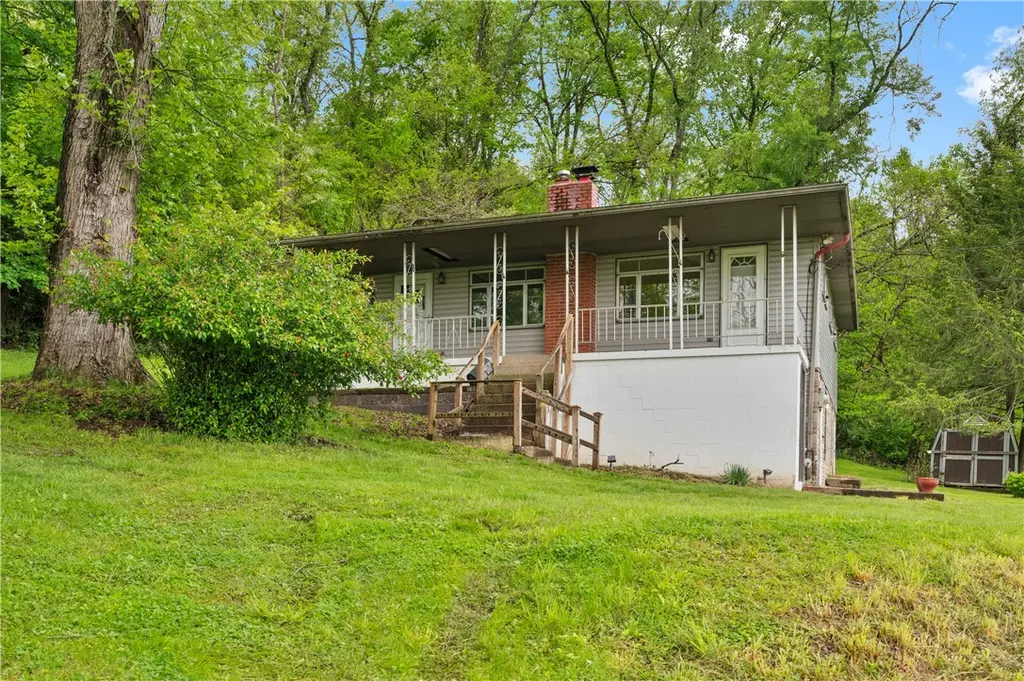
3601 Brandis Ave · Gastonville, PA
Flood risk 1/10 · Minimal
- FEMA flood zone
- X (unshaded)
- Chance of flooding over 30 yrs
- 0.0%
- Est. flood insurance / yr
- $473 – $860
Fire risk 1/10 · Minimal
- Est. fire insurance / yr
- $511 – $949
Heat risk 3/10 · Minor
- Hot days now (above 97°F)
- 7 days/yr
- Hot days in 30 yrs
- 17 days/yr
Wind risk 2/10 · Minimal
- Chance of severe wind over 30 yrs
- —
Air-quality risk 3/10 · Minor
- Unhealthy air days now
- 2 days/yr
- Unhealthy air days in 30 yrs
- 4 days/yr
Risk factors via First Street. Map © Google.
Why this score? — see what drove the B- grade
The composite is a weighted blend of 9 inputs, each scored 0–100. Each bar is that input's sub-score; the figure is the points it added to the 100-point composite (weight × sub-score).
- Cash flow +25.2/30.0
- ARV discount +14.0/15.0
- DSCR +8.3/10.0
- 1% rule +5.5/10.0
- Schools +4.8/10.0
- Livability +3.6/5.0
- Rent growth +2.6/5.0
- Condition / age +2.5/5.0
- Appreciation +0.0/10.0
$169,900
🖨 Deal sheet (PDF) 📄 Offer letter ✓ Due diligence
Listing remarks
Welcome to this well-maintained raised ranch in the heart of South Park! Nestled on a private lot with a peaceful setting, this 3 bed, 1 bath home offers the perfect blend of comfort, character, and opportunity. Original hardwood floors throughout much of the main level add timeless charm, while the functional layout provides comfortable everyday living. The spacious main level features an inviting living room, generously sized bedrooms, and a kitchen ready for your personal updates and finishing touches. Downstairs, the semi-framed basement with a separate entrance opens the door to endless possibilities — ideal for additional living space, a workshop, home office, in-law suite, or p
Key facts
- Separate entrance
- Private lot
- Nearby trails
Tags
Property features AI
Exterior
- Parking: 2 parking spaces
- Utilities: Public water; Public sewer
- Exterior features: 0.201-acre lot; Resale property
Interior
- Kitchen: Cooktop; Stove
- Bathrooms: 1 full bathroom
- Heating & cooling: Forced-air heating; Gas heating
- Interior features: Walk-out basement
- Laundry & utility: Some electric appliances
Neighborhood map
What this means for you Summary
Snapshot
- This is a 3-bed/1.0-bath single-family listed at $170k.
Deal economics
- At list price, monthly cash flow is $380 ($5k/yr) — positive.
- The deal already cash-flows at list — no discount required.
- Meets the 1% rule at list price ($2k rent vs $170k).
- Recommended offer: $165k (3.0% below list) — sets the bar for market timing.
- Cap rate 9.0% vs local median 2.5% in Gastonville — top-decile yield for the area; either an underpriced asset or a hidden risk that comps aren't pricing in. Stress-test before assuming the spread holds.
Location & tenants
- Location reads 71/100 on livability (#726 in PA) — a middle-class / working-renter tenant base. Strengths: crime A+, cost of living A+, housing A+; Watch: amenities F, health & safety F.
- South Park SD (suburban): math 46% / reading 63% proficiency, ranked #101 of 539 in PA (top 19%) — acceptable for families but not a draw, mixed tenant base, ~2y average lease; only 19% free/reduced lunch — higher-income household profile.
- Zoned schools: South Park Elem Center (math 41% / reading 70%, grade C, #492 of 1,518 statewide, top 33%, 679 students, 35% FRL); South Park Ms (math 38% / reading 60%, grade C-, #140 of 512 statewide, top 28%, 541 students, 32% FRL); South Park Shs (math 77%, 560 students, 22% FRL).
- Market conditions: Rents flat; 54 active listings in the ZIP; 9 comparable units currently listed for rent nearby; rentals leasing fast (median 4d on market — plan ~1-2 weeks tenant-placement turnaround); solid renter incomes; 2,996 units permitted in Allegheny County in 2024 (1,588 in 5+ unit buildings).
Forward outlook
- Local home prices are declining (-3.0%/yr); year-one equity from $1k of loan paydown is wiped out by about $5k of value loss. Plan a longer hold.
Negotiation context
- It's been on market 45 days — a 3% lower offer ($165k) is reasonable based on typical stale-listing flexibility.
Risks & watch-outs
- Watch-outs: built in 1900 — expect roof / HVAC / electrical / plumbing capex.
Questions for the listing agent
- It's been on market 45 days. Have you received any prior offers? Is the seller open to a 3% concession, seller financing, or rate buy-down credit?
- Built in 1900 — when were the roof, HVAC, electrical panel, plumbing, and water heater last replaced?
- Is there a deadline driving the sale (1031 exchange, divorce, estate, relocation)? That informs how much negotiation room exists.
- Schools are F-rated, which usually means shorter tenancies and higher turnover. Who's the typical renter profile here, and what's been the actual vacancy rate?
- What's the average days-on-market for RENTAL listings here right now (not sales)? A rising rental-DOM trend means longer vacancies and softer asking-rent achievability than the comps imply.
- What's the recent tenant-quality profile in this submarket — average credit score on applications, eviction rate, late-payment / NSF rate, and stable-employment percentage? A property-management company in the area should have these aggregated.
- How much new for-sale + rental construction is in the pipeline within 1–3 miles? Heavy new supply typically softens prices + rents 12–24 months out; constrained supply supports both.
Investment metrics
- 1% rule
- 1.05% ✓
- Cap rate
- 8.98%
- Cash-on-cash
- 9.59%
- DSCR
- 1.43
- GRM
- 7.9
CMA / ARV
- ARV (median comp)
- $198,812
- List price
- $169,900
- Delta
- -14.54%
- Verdict
- UNDERPRICED
- Comps
- 20 within 1.0 mi
Show comp detail 12 sales within ~0.75 mi
| Address | Dist | Beds/Ba | Sqft | Sold | Price | $/sf | Match |
|---|---|---|---|---|---|---|---|
| 6417 Helen St | 0.54mi | 3/2.0 | 1,080 (+2%) | 1mo | $232,000 | $215 | 66 |
| 6222 Pleasant St | 0.57mi | 4/1.0 (+1) | 1,080 (+2%) | 1mo | $150,000 | $139 | 64 |
| 6412 Helen St | 0.48mi | 3/1.0 | 1,125 (+7%) | 3mo | $100,000 | $89 | 64 |
| 6207 Pleasant St | 0.58mi | 3/1.0 | 1,088 (+3%) | 9mo | $115,000 | $106 | 60 |
| 3802 Grant St | 0.41mi | 3/1.5 | 1,160 (+10%) | 3mo | $125,077 | $108 | 59 |
| 6415 Helen St | 0.54mi | 3/2.0 | 1,125 (+7%) | 2mo | $244,900 | $218 | 58 |
| 1524 Roosevelt Ave | 0.65mi | 3/1.5 | 1,110 (+5%) | 5mo | $236,850 | $213 | 55 |
| 1549 Roosevelt Ave | 0.61mi | 3/1.0 | 926 (-12%) | 3mo | $160,000 | $173 | 49 |
| 6212 Pleasant St | 0.59mi | 4/1.0 (+1) | 1,125 (+7%) | 10mo | $185,000 | $164 | 48 |
| 6489 Simmons Ave | 0.71mi | 3/1.5 | 1,180 (+12%) | 2mo | $165,000 | $140 | 43 |
| 1495 Washington Ave | 0.71mi | 2/2.0 (-1) | 928 (-12%) | 5mo | $232,000 | $250 | 34 |
| 1368 Berryman Ave | 0.74mi | 3/3.0 | 1,200 (+14%) | 11mo | $253,000 | $211 | 26 |
Match score weights: distance 35% · size 25% · config 20% · recency 20%. Top-matched comps best support the ARV.
Projected returns pro-forma
-3.0% appreciation · 0.29% rent growth · sell at horizon
- IRR
- -4.7%
- Equity multiple
- 0.83×
- Total profit
- $-8,134
- Equity at exit
- $25,333
- IRR
- 1.8%
- Equity multiple
- 1.11×
- Total profit
- $5,376
- Equity at exit
- $14,690
Cash invested: $47,572 (down + closing). Projections, not guarantees.
Landlord ↔ Tenant lean methodology
- Overall (STATE)
- 62 Landlord-Friendly
- State Pennsylvania
- 62 Landlord-Friendly · EVEN
- County
- — inherits STATE
- City
- — inherits STATE
ZIP-level market 15129
- Rents YoY
- 0.3%
- Active inventory
- 54
- Price-to-rent
- 7.9×
Monthly cashflow live
- Estimated rent
- $1,790 high interval (Pro) →
- Mortgage (P&I)
- −$891
- Tax from tax record
- −$72 /mo · $869/yr
- Insurance
- −$71
- HOA
- −$0
- Vacancy / Maint / Mgmt
- −$376
- Net cashflow
- $380
Break-even live
Sensitivity live
| Price | -10% $476 | -5% $428 | +0% $380 | +5% $332 | +10% $284 |
|---|---|---|---|---|---|
| Rent | -10% $239 | -5% $309 | +0% $380 | +5% $451 | +10% $522 |
| Rate | -1.0pp $466 | -0.5pp $423 | base $380 | +0.5pp $336 | +1.0pp $291 |
UW: 25.0% down · 7.5% · 30yr · 1.5% tax · 5.0% vac · 8.0% maint · 8.0% mgmt
Financing live
Cash to close
- Down payment
- $42,475
- Closing costs
- $5,097
- Reserves months
- —
- Total cash needed
- —
Loan-product check · same deal, 3 products live
Conventional
25% down · 7.5% · 30yr
- Down + closing
- —
- Monthly P&I
- —
- Monthly cashflow
- —
- DSCR
- —
- Eligible?
- —
Personal DTI + credit; lowest rate.
DSCR
20% down · 8.5% · 30yr
- Down + closing
- —
- Monthly P&I
- —
- Monthly cashflow
- —
- DSCR
- —
- Eligible?
- —
No personal income docs; deal must DSCR.
Hard money
10% down · 12.0% · 12mo
- Down + closing
- —
- Monthly P&I
- —
- Monthly cashflow
- —
- DSCR
- —
- Eligible?
- —
Short-term bridge; refi at stabilization.
Rent comps 9 comps
| Address | Beds | Baths | Sqft | Rent | $/sqft | DOM | Units | Dist |
|---|---|---|---|---|---|---|---|---|
| 3001 Perimeter Blvd South Park, PA | 1.0–2.0 | 1.0–2.0 | 926 | $2,105 | $2.27 | 0d | 19 | 0.30mi |
| 6450 Pleasant St South Park, PA | 1.0–2.0 | 1.0 | 815 | $1,499 | $1.84 | 0d | 3 | 0.62mi |
| 6301 Broad St South Park, PA | 3.0 | 1.0 | 816 | $1,750 | $2.14 | 45d | 1 | 0.73mi |
| 6478 2nd Ave South Park, PA | 3.0 | 2.0 | 1326 | $1,795 | $1.35 | 45d | 1 | 0.80mi |
| 600 Royal Dr South Park Township, PA | 1.0–3.0 | 1.0 | 801 | $1,585 | $1.98 | 0d | 16 | 0.95mi |
| 3106 Southern Dr South Park, PA | 4.0 | 1.0 | 1125 | $1,695 | $1.51 | 3d | 1 | 1.02mi |
| 7000 Squires Manor Ln South Park Township, PA | 1.0–2.0 | 1.0 | 805 | $1,440 | $1.79 | 0d | 15 | 1.19mi |
| 1700 Patrick Pl South Park, PA | 1.0–3.0 | 1.0–2.0 | 972 | $1,510 | $1.55 | 3d | 15 | 1.22mi |
| 201 Woods Edge Finleyville, PA | 3.0 | 1.5 | 1500 | $1,600 | $1.07 | 9d | 1 | 1.28mi |
Listing history 17 events
-
2026-06-21days on market $169,900 Active 45 DOM
-
2026-06-18days on market $169,900 Active 42 DOM
-
2026-06-17days on market $169,900 Active 41 DOM
-
2026-06-16days on market $169,900 Active 40 DOM
-
2026-06-15days on market $169,900 Active 39 DOM
-
2026-06-13days on market $169,900 Active 37 DOM
-
2026-06-13days on market $169,900 Active 36 DOM
-
2026-06-09days on market $169,900 Active 33 DOM
-
2026-06-08days on market $169,900 Active 32 DOM
-
2026-06-07days on market $169,900 Active 31 DOM
-
2026-06-05days on market $169,900 Active 28 DOM
-
2026-06-03days on market $169,900 Active 27 DOM
-
2026-06-02days on market $169,900 Active 26 DOM
-
2026-06-01days on market $169,900 Active 25 DOM
-
2026-05-31days on market $169,900 Active 24 DOM
-
2026-05-18price $169,900 1413-char remark
-
2026-05-07$179,900 Active 1413-char remark
ⓘ Source: listings_history table (triggers on properties + properties_extension) + one-shot
backfill from property_details.listing_events for pre-trigger history.
Tax reassessment forecast PA · Partial reset (capped growth)
- Current annual tax
- $869 · $72/mo
- Projected year-2 tax
- $1,777 · $148/mo
- Expected delta
- +$907/yr (+$76/mo · 104.4%)
ⓘ Screening estimate from a state-policy table — verify with the county assessor before closing.
Climate risk First Street
- Flood 1/10 Low FEMA zone X (unshaded) · 0% chance over 30 yrs
- Wildfire 1/10 Low
- Heat 3/10 Moderate 7 d/yr ≥97°F today · 17 d/yr by 30 yrs out
- Wind 2/10 Low
- Air quality 3/10 Moderate 2 unhealthy d/yr today · 4 by 30 yrs out
Nearby sold comps map
Loading sold comps map…
Walkable amenities ~0.75 mi
Loading nearby amenities…
Taxation est. · year 1
- Rental income
- $21,483
- − Mortgage interest
- −$9,517
- − Property taxes
- −$869
- − Insurance
- −$850
- − Repairs & maintenance
- −$1,719
- − Management
- −$1,719
- − Depreciation
- −$4,943
- Taxable income
- $1,867
- Est. tax owed @ 24.0%
- −$448
- After-tax cash flow
- $4,113/yr
For passive investors: Depreciation is non-cash, so a rental often shows a tax loss while cash-flowing — sheltering income. Rental losses are passive: they offset passive income freely, and up to $25,000/yr can offset ordinary (W-2) income if you actively participate and your MAGI is under $100k (phasing out to $0 by $150k); unused losses carry forward. On sale, claimed depreciation is recaptured at up to 25%, and gains may owe capital-gains tax (a 1031 exchange can defer both). Figures are a year-1 estimate at your 24.0% rate — not tax advice; consult a CPA.
Schools (NCES district)
- District
- South Park SD
- NCES district ID
- 4222060
- Math proficiency
- 46% ▼ -12.00%
- Reading proficiency
- 63% ▼ -8.00%
- Median HH income
- $66,606
- Composite
- 48.04/100
- National rank
- #2194
- State rank
- #101 of 539 in PA
Livability — Gastonville
- Score
- 71/100
- State rank
- #726
- US rank
- #7265
Category grades
Schools grade is shown separately in the Schools card above.
Census & demographics
- County
- Allegheny County · 1,022,028 people
- Metro
- Pittsburgh, PA
- Population (ZIP)
- 10,789
- Household income
- $99,519
- Rent vs Own
- Severe rent burden
- 269.0
Population outlook (Allegheny County) Hauer SSP2
- Today (2025)
- 1,250,282 people
- By 2030
- 1,256,482 · +0.5%
- By 2040
- 1,256,318 · +0.5%
- By 2050
- 1,244,169 · -0.5%
- By 2075
- 1,197,693 · -4.2%
- By 2100
- 1,093,187 · -12.6%
Race, ethnicity, and origin ACS 2023
- Neighborhood character
- Predominantly White (92%)
- Race & ethnicity
- White 92% Two or more races 4% Black 3% Asian 2%
- Common ancestry
- Romanian 9% Slovak 3% Serbian 2%
- Foreign-born
- 3% · India, Canada, Jamaica
- Languages at home
- 97% English-only · Other Indo-European 2% Spanish 1%
Political lean MEDSL · Allegheny
- 2024 margin
- Strong D (+20.3) · D 59.7% · R 39.4%
- 2008→2024 swing
- +4.8pp toward D · 2008: 15.5pp · 2024: 20.3pp
- All cycles
- 2024: D+20.3 2020: D+20.4 2016: D+16.4 2012: D+14.4 2008: D+15.5
Not yet ingested
- Civics
- —
Market trends
- HPI YoY
- ▼ -151.17%
- Current HPI
- 261.5253
- Rent YoY
- ▲ 0.29%
- Metro
- Pittsburgh, PA
- State GDP YoY
- ▲ 1.68%
- F500 in state
- 34
Industry mix (Fortune 500 HQ in PA)
| Industry | F500 HQs | Revenue |
|---|---|---|
| Healthcare | 2 | $309B |
|
||
| Insurance | 2 | $27B |
|
||
| Telecommunications / Media | 1 | $124B |
|
||
| Industrial Distribution | 1 | $22B |
|
||
| Financial Services | 1 | $20B |
|
||
| Chemicals / Materials | 1 | $18B |
|
||
Price history
-5.6% since first listed2 events — show timeline
- 2026-05-18 Price Changed $169,900 West Penn MLS
- 2026-05-07 Listed $179,900 West Penn MLS
Property tax history
+1.5%/yrLatest (2026): $869 · +2.3% YoY. Source: county tax records.
Cash-flow waterfall
monthlySold comps — $/sqft
last 12 mo · ≤1 miLoading sold comps…