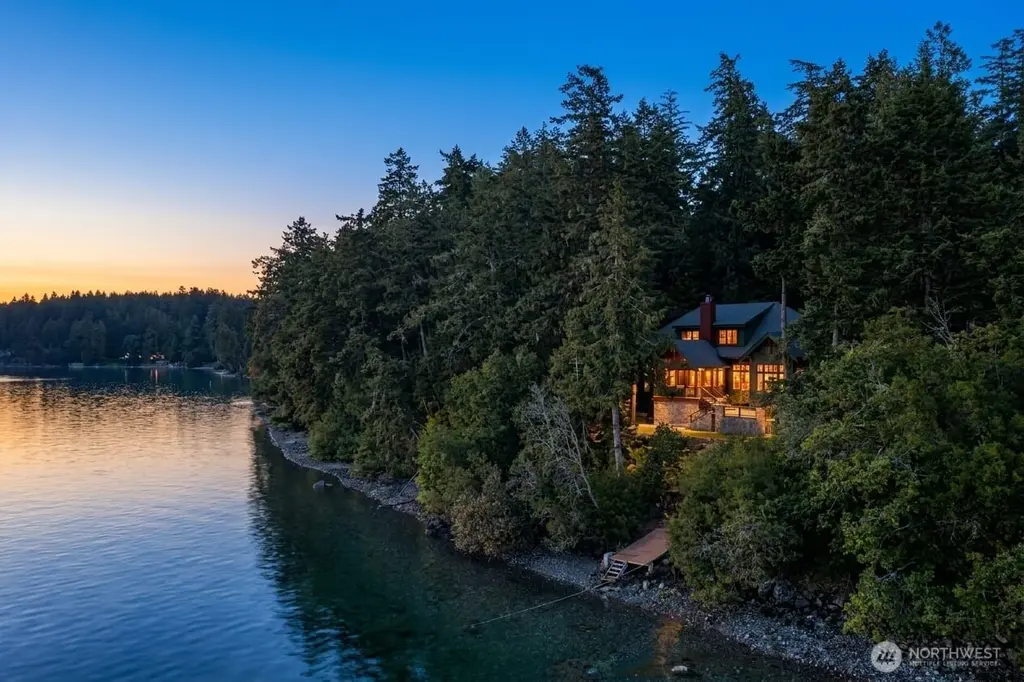
550 Westcott Dr · Roche Harbor, WA
Flood risk 1/10 · Minimal
- FEMA flood zone
- X (unshaded)
- Chance of flooding over 30 yrs
- 0.0%
- Est. flood insurance / yr
- $473 – $860
Fire risk 5/10 · Moderate
- Est. fire insurance / yr
- $604 – $1,122
Heat risk 1/10 · Minimal
- Hot days now (above 78°F)
- 7 days/yr
- Hot days in 30 yrs
- 20 days/yr
Wind risk 1/10 · Minimal
- Chance of severe wind over 30 yrs
- —
Air-quality risk 6/10 · Moderate
- Unhealthy air days now
- 8 days/yr
- Unhealthy air days in 30 yrs
- 10 days/yr
Risk factors via First Street. Map © Google.
Why this score? — see what drove the C- grade
The composite is a weighted blend of 9 inputs, each scored 0–100. Each bar is that input's sub-score; the figure is the points it added to the 100-point composite (weight × sub-score).
- Cash flow +19.9/30.0
- ARV discount +7.5/15.0
- DSCR +6.3/10.0
- Schools +5.7/10.0
- 1% rule +4.3/10.0
- Rent growth +2.5/5.0
- Livability +2.5/5.0
- Condition / age +2.5/5.0
- Appreciation +0.0/10.0
$2,695,000
🖨 Deal sheet (PDF) 📄 Offer letter ✓ Due diligence
Listing remarks
Custom Pacific Northwest Craftsman with 171 feet of northwest-facing shoreline on Westcott Bay, capturing expansive water views and the ever-changing activity of boats, wildlife, and tides. For the first time on the market, the home maximizes its waterfront setting-- showcasing custom woodwork, generous windows, 10ft ceilings, open living spaces, and inviting outdoor areas designed for entertaining and relaxation. The residence offers 3 lovely bedrooms and 3 baths, an upmarket kitchen featuring Viking and Fisher & Paykel appliances, water views from virtually every room, an intuitive floor plan, and an enormous unfinished walk-out basement. Well suited for year-round living or as a se
Key facts
- Open living spaces
- Upmarket kitchen
- Custom woodwork
Tags
Property features AI
Finance
- Financial info: Listing terms: Cash or Conventional
Exterior
- Parking: Covered parking for 4; Driveway; Detached garage; RV parking
- Utilities: Water from community system (Roche Harbor Water Co); Septic tank; Power by OPALCO; Energy sources: Electric and Propane; Electric water heater located in basement; Internet: Centurylink
- Home design: Single family residence, two stories; Main-level entry; Northwest facing; Has view; Built on lot; Property condition: good
- Construction: Wood construction; Composition roof; Poured concrete foundation; Built on lot (house)
- Exterior features: Wood exterior; Deck; Moorage; Outbuildings; Patio; RV parking; Shop; Garden space; Wooded yard; Dead end street; Drought-resistant landscaping; Paved surfaces; Water access with deeded beach rights; Saltwater/sea frontage (171 ft waterfront)
Interior
- Kitchen: Dishwasher; Garbage disposal; Microwave; Refrigerator; Stove/Range
- Bedrooms: 3 bedrooms (2 upstairs, 1 main level)
- Flooring: Ceramic tile; Hardwood; Carpet
- Bathrooms: 1 full bath; 1 three-quarter bath; 1 half bath; 2 main level bathrooms; 1 bathtub; 2 showers
- Heating & cooling: Forced air heating; Forced air cooling
- Interior features: Ceiling fans; Dining room; Fireplace (gas); Loft; Vaulted ceilings; Walk-in closets; Water heater
- Laundry & utility: Washer; Dryer
Neighborhood map
What this means for you Summary
Snapshot
- This is a 2-bed/3.0-bath single-family listed at $2.69M.
Deal economics
- At list price, monthly cash flow is $3k ($39k/yr) — positive.
- The deal already cash-flows at list — no discount required.
- To meet the 1% rule (rent ≥ 1% of price), the offer needs to be $2.50M (7.2% below list).
- Recommended offer: $2.50M (7.2% below list) — sets the bar for 1% rule.
- Cap rate 7.7% vs local median 0.5% in Roche Harbor — top-decile yield for the area; either an underpriced asset or a hidden risk that comps aren't pricing in. Stress-test before assuming the spread holds.
Location & tenants
- Location reads: area grade C — affects rentability + tenant quality, not the cash-flow math above.
- San Juan Island School District (rural): math 61% / reading 67% proficiency, ranked #36 of 291 in WA (top 12%) — acceptable for families but not a draw, mixed tenant base, ~2y average lease.
- Zoned schools: Friday Harbor Elementary School (321 students, 38% FRL); Friday Harbor High School (245 students, 42% FRL).
- Market conditions: 165 active listings in the ZIP; 1 comparable units currently listed for rent nearby; 99 units permitted in San Juan County in 2024 (0 in 5+ unit buildings).
Forward outlook
- Local home prices are declining (-3.0%/yr); year-one equity from $19k of loan paydown is wiped out by about $81k of value loss. Plan a longer hold.
- San Juan County population projected at +6% by 2050 — modest demand growth; plan on rents tracking national, not racing it.
Negotiation context
- Only 13 days on market — expect competitive offers; lowballing is unlikely to land.
- Current owner paid $350k; list at $2.69M implies a 670% gain — meaningful room to come down on a strong offer.
Risks & watch-outs
- Climate carrying-cost: moderate wildfire risk — expect insurance premiums to compound above CPI over the hold.
Questions for the listing agent
- Is there a deadline driving the sale (1031 exchange, divorce, estate, relocation)? That informs how much negotiation room exists.
- What's the average days-on-market for RENTAL listings here right now (not sales)? A rising rental-DOM trend means longer vacancies and softer asking-rent achievability than the comps imply.
- What's the recent tenant-quality profile in this submarket — average credit score on applications, eviction rate, late-payment / NSF rate, and stable-employment percentage? A property-management company in the area should have these aggregated.
- How much new for-sale + rental construction is in the pipeline within 1–3 miles? Heavy new supply typically softens prices + rents 12–24 months out; constrained supply supports both.
Investment metrics
- 1% rule
- 0.93% ✗
- Cap rate
- 7.75%
- Cash-on-cash
- 5.20%
- DSCR
- 1.23
- GRM
- 9.0
CMA / ARV
No comps found within radius.
Projected returns pro-forma
-3.0% appreciation · 3.0% rent growth · sell at horizon
- IRR
- -8.3%
- Equity multiple
- 0.70×
- Total profit
- $-229,408
- Equity at exit
- $401,833
- IRR
- 1.2%
- Equity multiple
- 1.09×
- Total profit
- $64,556
- Equity at exit
- $233,014
Cash invested: $754,600 (down + closing). Projections, not guarantees.
Landlord ↔ Tenant lean methodology
- Overall (STATE)
- 28 Tenant-Leaning
- State Washington
- 28 Tenant-Leaning · D+8
- County
- — inherits STATE
- City
- — inherits STATE
ZIP-level market 98250
- Active inventory
- 165
- Price-to-rent
- 9.0×
Monthly cashflow live
- Estimated rent
- $25,000 medium interval (Pro) →
- Mortgage (P&I)
- −$14,133
- Tax from tax record
- −$1,225 /mo · $14,696/yr
- Insurance
- −$1,123
- HOA
- −$0
- Vacancy / Maint / Mgmt
- −$5,250
- Net cashflow
- $3,270
Break-even live
Sensitivity live
| Price | -10% $4,795 | -5% $4,032 | +0% $3,270 | +5% $2,507 | +10% $1,744 |
|---|---|---|---|---|---|
| Rent | -10% $1,295 | -5% $2,282 | +0% $3,270 | +5% $4,257 | +10% $5,245 |
| Rate | -1.0pp $4,627 | -0.5pp $3,955 | base $3,270 | +0.5pp $2,571 | +1.0pp $1,861 |
UW: 25.0% down · 7.5% · 30yr · 1.5% tax · 5.0% vac · 8.0% maint · 8.0% mgmt
Financing live
Cash to close
- Down payment
- $673,750
- Closing costs
- $80,850
- Reserves months
- —
- Total cash needed
- —
Loan-product check · same deal, 3 products live
Conventional
25% down · 7.5% · 30yr
- Down + closing
- —
- Monthly P&I
- —
- Monthly cashflow
- —
- DSCR
- —
- Eligible?
- —
Personal DTI + credit; lowest rate.
DSCR
20% down · 8.5% · 30yr
- Down + closing
- —
- Monthly P&I
- —
- Monthly cashflow
- —
- DSCR
- —
- Eligible?
- —
No personal income docs; deal must DSCR.
Hard money
10% down · 12.0% · 12mo
- Down + closing
- —
- Monthly P&I
- —
- Monthly cashflow
- —
- DSCR
- —
- Eligible?
- —
Short-term bridge; refi at stabilization.
Rent comps 1 comps
| Address | Beds | Baths | Sqft | Rent | $/sqft | DOM | Units | Dist |
|---|---|---|---|---|---|---|---|---|
| 25 Cobblestone Ln Friday Harbor, WA | 3.0 | 3.5 | 1820 | $25,000 | $13.74 | 44d | 1 | 0.74mi |
Listing history 11 events
-
2026-06-18days on market $2,695,000 Active 13 DOM
-
2026-06-17days on market $2,695,000 Active 12 DOM
-
2026-06-16days on market $2,695,000 Active 11 DOM
-
2026-06-15days on market $2,695,000 Active 10 DOM
-
2026-06-15days on market $2,695,000 Active 9 DOM
-
2026-06-13days on market $2,695,000 Active 8 DOM
-
2026-06-12days on market $2,695,000 Active 7 DOM
-
2026-06-09days on market $2,695,000 Active 4 DOM
-
2026-06-08days on market $2,695,000 Active 3 DOM
-
2026-06-08remarks 695-char remark
-
2026-06-08$2,695,000 Active 2 DOM
ⓘ Source: listings_history table (triggers on properties + properties_extension) + one-shot
backfill from property_details.listing_events for pre-trigger history.
Tax reassessment forecast WA · Resets to sale price
- Current annual tax
- $14,696 · $1,225/mo
- Projected year-2 tax
- $26,411 · $2,201/mo
- Expected delta
- +$11,715/yr (+$976/mo · 79.7%)
ⓘ Screening estimate from a state-policy table — verify with the county assessor before closing.
Climate risk First Street
- Flood 1/10 Low FEMA zone X (unshaded) · 0% chance over 30 yrs
- Wildfire 5/10 Major
- Heat 1/10 Low 7 d/yr ≥78°F today · 20 d/yr by 30 yrs out
- Wind 1/10 Low
- Air quality 6/10 Major 8 unhealthy d/yr today · 10 by 30 yrs out
Nearby sold comps map
Loading sold comps map…
Walkable amenities ~0.75 mi
Loading nearby amenities…
Taxation est. · year 1
- Rental income
- $300,000
- − Mortgage interest
- −$150,962
- − Property taxes
- −$14,696
- − Insurance
- −$13,475
- − Repairs & maintenance
- −$24,000
- − Management
- −$24,000
- − Depreciation
- −$78,400
- Taxable loss
- −$5,533
- Est. tax savings @ 24.0%
- +$1,328
- After-tax cash flow
- $40,562/yr
For passive investors: Depreciation is non-cash, so a rental often shows a tax loss while cash-flowing — sheltering income. Rental losses are passive: they offset passive income freely, and up to $25,000/yr can offset ordinary (W-2) income if you actively participate and your MAGI is under $100k (phasing out to $0 by $150k); unused losses carry forward. On sale, claimed depreciation is recaptured at up to 25%, and gains may owe capital-gains tax (a 1031 exchange can defer both). Figures are a year-1 estimate at your 24.0% rate — not tax advice; consult a CPA.
Schools (NCES district)
- District
- San Juan Island School District
- NCES district ID
- 5307650
- Math proficiency
- 61% ▲ 6.00%
- Reading proficiency
- 67% ▬ 0.00%
- Median HH income
- $58,476
- Composite
- 56.64/100
- National rank
- #2434
- State rank
- #36 of 291 in WA
Livability — Roche Harbor
No livability data for this city. (Only ~50 U.S. cities are tracked.)
Census & demographics
- Census place
- Roche Harbor, WA
- Population (ZIP)
- 9,127
Population outlook (San Juan County) Hauer SSP2
- Today (2025)
- 17,439 people
- By 2030
- 17,871 · +2.5%
- By 2040
- 18,236 · +4.6%
- By 2050
- 18,468 · +5.9%
- By 2075
- 19,749 · +13.2%
- By 2100
- 20,348 · +16.7%
Race, ethnicity, and origin ACS 2023
- Neighborhood character
- Predominantly White (84%)
- Race & ethnicity
- White 84% Hispanic / Latino 9% Two or more races 7% Asian 1%
- Hispanic origin (detail)
- Mexican 8%
- Common ancestry
- Slovak 5% Portuguese 5% Lithuanian 4%
- Foreign-born
- 7% · Canada
- Languages at home
- 93% English-only · Spanish 4% Other Indo-European 1% German/W. Germanic 1%
Political lean MEDSL · San Juan
- 2024 margin
- Solid D (+51.4) · D 73.7% · R 22.3% · Other 3.9%
- 2008→2024 swing
- +9.5pp toward D · 2008: 41.9pp · 2024: 51.4pp
- All cycles
- 2024: D+51.4 2020: D+50.5 2016: D+41.6 2012: D+37.5 2008: D+41.9
Not yet ingested
- Civics
- —
Market trends
- HPI YoY
- ▼ -105.89%
- Current HPI
- 187.6787
- Rent YoY
- —
- Metro
- —
- State GDP YoY
- ▲ 4.65%
- F500 in state
- 22
Industry mix (Fortune 500 HQ in WA)
| Industry | F500 HQs | Revenue |
|---|---|---|
| Retail | 2 | $269B |
|
||
| Technology / Retail | 1 | $638B |
|
||
| Technology | 1 | $245B |
|
||
| Telecommunications | 1 | $38B |
|
||
| Food / Beverage | 1 | $36B |
|
||
| Automotive / Trucks | 1 | $34B |
|
||
Price history
+670.0% since first listed2 events — show timeline
- 2026-06-05 Listed $2,695,000 NWMLS as Distributed by MLS Grid
- 2001-11-13 Sold (Public Records) $350,000 Public Records
Property tax history
+8.0%/yrLatest (2026): $14,696 · -5.3% YoY. Source: county tax records.
Cash-flow waterfall
monthlySold comps — $/sqft
last 12 mo · ≤1 miLoading sold comps…