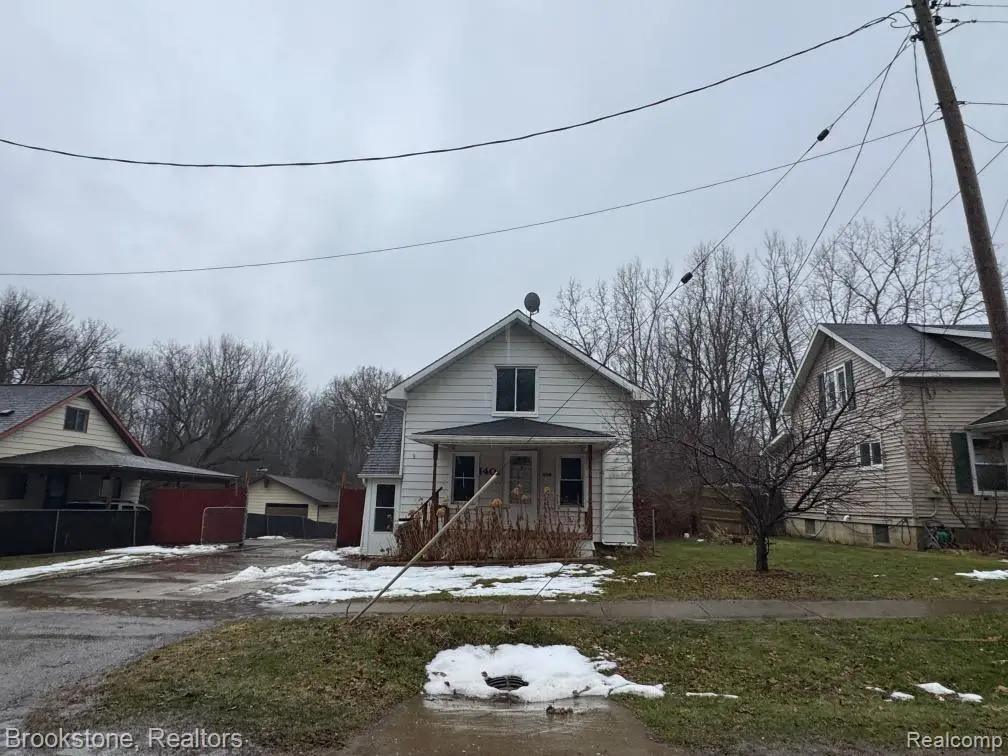
140 E Johnson St · Clio, MI
Flood risk 8/10 · Major
- FEMA flood zone
- X (unshaded)
- Chance of flooding over 30 yrs
- 0.99%
- Est. flood insurance / yr
- $473 – $860
Fire risk 1/10 · Minimal
- Est. fire insurance / yr
- $784 – $1,456
Heat risk 2/10 · Minimal
- Hot days now (above 97°F)
- 7 days/yr
- Hot days in 30 yrs
- 14 days/yr
Wind risk 2/10 · Minimal
- Chance of severe wind over 30 yrs
- —
Air-quality risk 2/10 · Minimal
- Unhealthy air days now
- 1 days/yr
- Unhealthy air days in 30 yrs
- 2 days/yr
Risk factors via First Street. Map © Google.
Why this score? — see what drove the C+ grade
The composite is a weighted blend of 9 inputs, each scored 0–100. Each bar is that input's sub-score; the figure is the points it added to the 100-point composite (weight × sub-score).
- Cash flow +22.4/30.0
- ARV discount +15.0/15.0
- DSCR +7.2/10.0
- 1% rule +7.0/10.0
- Livability +3.5/5.0
- Schools +3.1/10.0
- Rent growth +2.5/5.0
- Condition / age +2.5/5.0
- Appreciation +0.0/10.0
$99,999
🖨 Deal sheet (PDF) 📄 Offer letter ✓ Due diligence
Listing remarks MLS
Price to move quickly. Currently used as single family but could be used as two unit income property. Three bedrooms with possibility to convert into 4. Property is located on small dead end street and offers a garage with enough room for 4 cars and lift.
Key facts
- 7,841 sq ft lot
- 2 garage spots
- Built 1948
Neighborhood map
What this means for you Summary
Snapshot
- This is a 3-bed/2.0-bath single-family listed at $100k.
Deal economics
- At list price, monthly cash flow is $112 ($1k/yr) — positive.
- The deal already cash-flows at list — no discount required.
- Meets the 1% rule at list price ($1k rent vs $100k).
- Recommended offer: $98k (1.5% below list) — sets the bar for market timing.
- Cap rate 8.3% vs local median 4.7% in Clio — top-decile yield for the area; either an underpriced asset or a hidden risk that comps aren't pricing in. Stress-test before assuming the spread holds.
Location & tenants
- Location reads 69/100 on livability (#332 in MI) — a middle-class / working-renter tenant base. Strengths: cost of living A+, health & safety A-, crime B+; Watch: schools D+, amenities F, commute F.
- Clio Area School District (suburban): math 27% / reading 44% proficiency, ranked #269 of 540 in MI (top 50%) — families likely to look elsewhere, expect single-tenant / working-renter base with shorter leases.
- Market conditions: 148 active listings in the ZIP; 419 units permitted in Genesee County in 2024 (68 in 5+ unit buildings).
Forward outlook
- Local home prices are declining (-3.0%/yr); year-one equity from $691 of loan paydown is wiped out by about $3k of value loss. Plan a longer hold.
- Genesee County population projected at -27% by 2050 — secular population decline; favor cash flow + early exit over multi-decade hold.
Negotiation context
- It's been on market 17 days — a 2% lower offer ($98k) is reasonable based on typical stale-listing flexibility.
- 19 sale attempts since 20y ago with the ask held roughly flat each time — persistent listings suggest the price (not the market) is what's stuck; bring a comps-based counter.
- Current owner paid $31k; list at $100k implies a 222% gain — meaningful room to come down on a strong offer.
Risks & watch-outs
- Watch-outs: property tax is 2.6% of price; flood insurance adds $56/mo; built in 1948 — expect roof / HVAC / electrical / plumbing capex.
- Climate carrying-cost: severe flood risk — expect insurance premiums to compound above CPI over the hold.
Questions for the listing agent
- Built in 1948 — when were the roof, HVAC, electrical panel, plumbing, and water heater last replaced?
- Property tax is high relative to price — has the assessment been appealed recently, and will the sale trigger a re-assessment?
- What's the actual annual flood-insurance premium (NFIP or private), and is the property in a SFHA with mandatory coverage?
- Is there a deadline driving the sale (1031 exchange, divorce, estate, relocation)? That informs how much negotiation room exists.
- Schools are D-rated, which usually means shorter tenancies and higher turnover. Who's the typical renter profile here, and what's been the actual vacancy rate?
- What's the average days-on-market for RENTAL listings here right now (not sales)? A rising rental-DOM trend means longer vacancies and softer asking-rent achievability than the comps imply.
- What's the recent tenant-quality profile in this submarket — average credit score on applications, eviction rate, late-payment / NSF rate, and stable-employment percentage? A property-management company in the area should have these aggregated.
- How much new for-sale + rental construction is in the pipeline within 1–3 miles? Heavy new supply typically softens prices + rents 12–24 months out; constrained supply supports both.
Investment metrics
- 1% rule
- 1.20% ✓
- Cap rate
- 8.30%
- Cash-on-cash
- 7.18%
- DSCR
- 1.32
- GRM
- 6.9
CMA / ARV
- ARV (on-the-fly)
- $147,375
- Comps found
- 12
Show comp detail 12 sales within ~0.75 mi
| Address | Dist | Beds/Ba | Sqft | Sold | Price | $/sf | Match |
|---|---|---|---|---|---|---|---|
| 140 E Johnson St | 0.00mi | 3/2.0 | 1,179 (0%) | 3mo | $63,000 | $53 | 98 |
| 311 Pine St | 0.32mi | 2/1.0 (-1) | 1,138 (-4%) | 11mo | $142,500 | $125 | 61 |
| 312 Hughes St | 0.37mi | 3/1.0 | 1,092 (-7%) | 9mo | $195,400 | $179 | 59 |
| 242 Curry St | 0.58mi | 2/1.5 (-1) | 1,218 (+3%) | 8mo | $130,000 | $107 | 54 |
| 322 Smith St | 0.40mi | 3/1.0 | 1,300 (+10%) | 10mo | $106,000 | $82 | 52 |
| 533 Poplar St | 0.59mi | 3/1.0 | 1,098 (-7%) | 8mo | $137,500 | $125 | 50 |
| 243 Campbell St | 0.53mi | 2/1.0 (-1) | 1,056 (-10%) | 1mo | $139,900 | $132 | 48 |
| 516 Allen St | 0.62mi | 3/1.0 | 1,092 (-7%) | 14mo | $212,000 | $194 | 43 |
| 105 Butler St | 0.48mi | 3/1.0 | 1,020 (-14%) | 11mo | $110,000 | $108 | 42 |
| 511 Jefferson St | 0.47mi | 2/1.0 (-1) | 1,024 (-13%) | 13mo | $75,000 | $73 | 37 |
| 2417 Vaughn Dr | 0.74mi | 3/1.0 | 1,352 (+15%) | 2mo | $176,400 | $130 | 35 |
| 414 Clarion St | 0.61mi | 2/1.0 (-1) | 1,016 (-14%) | 10mo | $140,000 | $138 | 31 |
Match score weights: distance 35% · size 25% · config 20% · recency 20%. Top-matched comps best support the ARV.
Projected returns pro-forma
-3.0% appreciation · 3.0% rent growth · sell at horizon
- IRR
- -8.7%
- Equity multiple
- 0.68×
- Total profit
- $-8,969
- Equity at exit
- $14,910
- IRR
- 0.9%
- Equity multiple
- 1.06×
- Total profit
- $1,802
- Equity at exit
- $8,646
Cash invested: $28,000 (down + closing). Projections, not guarantees.
Landlord ↔ Tenant lean methodology
- Overall (STATE)
- 62 Landlord-Friendly
- State Michigan
- 62 Landlord-Friendly · EVEN
- County
- — inherits STATE
- City
- — inherits STATE
ZIP-level market 48420
- Active inventory
- 148
- Price-to-rent
- 6.9×
Monthly cashflow live
- Estimated rent
- $1,199 medium interval (Pro) →
- Mortgage (P&I)
- −$524
- Tax from tax record
- −$214 /mo · $2,568/yr
- Insurance
- −$42
- Flood insurance flood zone
- −$56 /mo · $666/yr
- HOA
- −$0
- Vacancy / Maint / Mgmt
- −$252
- Net cashflow
- $112
Break-even live
Sensitivity live
| Price | -10% $169 | -5% $140 | +0% $112 | +5% $84 | +10% $55 |
|---|---|---|---|---|---|
| Rent | -10% $17 | -5% $65 | +0% $112 | +5% $159 | +10% $207 |
| Rate | -1.0pp $162 | -0.5pp $137 | base $112 | +0.5pp $86 | +1.0pp $60 |
UW: 25.0% down · 7.5% · 30yr · 1.5% tax · 5.0% vac · 8.0% maint · 8.0% mgmt
Financing live
Cash to close
- Down payment
- $25,000
- Closing costs
- $3,000
- Reserves months
- —
- Total cash needed
- —
Loan-product check · same deal, 3 products live
Conventional
25% down · 7.5% · 30yr
- Down + closing
- —
- Monthly P&I
- —
- Monthly cashflow
- —
- DSCR
- —
- Eligible?
- —
Personal DTI + credit; lowest rate.
DSCR
20% down · 8.5% · 30yr
- Down + closing
- —
- Monthly P&I
- —
- Monthly cashflow
- —
- DSCR
- —
- Eligible?
- —
No personal income docs; deal must DSCR.
Hard money
10% down · 12.0% · 12mo
- Down + closing
- —
- Monthly P&I
- —
- Monthly cashflow
- —
- DSCR
- —
- Eligible?
- —
Short-term bridge; refi at stabilization.
Listing history 44 events
-
2026-03-16status Pending 255-char remark
Show marketing remark (255 chars)
Price to move quickly. Currently used as single family but could be used as two unit income property. Three bedrooms with possibility to convert into 4. Property is located on small dead end street and offers a garage with enough room for 4 cars and lift.
-
2026-03-16status Pending
Show marketing remark (255 chars)
Price to move quickly. Currently used as single family but could be used as two unit income property. Three bedrooms with possibility to convert into 4. Property is located on small dead end street and offers a garage with enough room for 4 cars and lift.
-
2026-02-27$99,999 Active 255-char remark
Show marketing remark (255 chars)
Price to move quickly. Currently used as single family but could be used as two unit income property. Three bedrooms with possibility to convert into 4. Property is located on small dead end street and offers a garage with enough room for 4 cars and lift.
-
2026-02-27$99,999 Active
Show marketing remark (255 chars)
Price to move quickly. Currently used as single family but could be used as two unit income property. Three bedrooms with possibility to convert into 4. Property is located on small dead end street and offers a garage with enough room for 4 cars and lift.
-
2024-04-08historical
-
2024-04-08historical
-
2024-03-28status Active
-
2024-03-28status Back on Market
-
2024-03-27status Pending
-
2024-03-27status Pending
-
2024-02-26price $109,000
-
2024-02-26price $109,000
-
2024-01-19price $120,000
-
2024-01-18price $120,000
-
2024-01-11status Active
-
2024-01-11status Active
-
2024-01-07historical
-
2024-01-06historical
-
2023-12-06$149,900 Active
-
2023-12-06$149,900 Active
-
2014-03-06historical
-
2014-03-06historical
-
2013-12-18historical
-
2013-12-17historical
-
2013-11-13$34,549
-
2013-11-13$34,549
-
2013-11-05historical
-
2013-11-05historical
-
2013-10-14$40,000
-
2013-10-14$40,000
-
2013-07-22$45,500
-
2013-07-22$45,500
-
2011-02-09soldstatus $31,010
-
2010-12-24$31,000
-
2010-05-01historical
-
2010-05-01historical
-
2009-05-29$39,000
-
2009-05-29$39,000
-
2007-05-14soldstatus $85,000
-
2007-05-01soldstatus $85,000
-
2007-05-01soldstatus $85,000
-
2007-04-13historical
-
2006-09-27$89,900
-
2006-09-27$89,900
ⓘ Source: listings_history table (triggers on properties + properties_extension) + one-shot
backfill from property_details.listing_events for pre-trigger history.
Tax reassessment forecast MI · Partial reset (capped growth)
- Current annual tax
- $2,568 · $214/mo
- Projected year-2 tax
- $2,568 · $214/mo
- Expected delta
- $0/yr ($0/mo · 0.0%)
ⓘ Screening estimate from a state-policy table — verify with the county assessor before closing.
Climate risk First Street
- Flood 8/10 Severe FEMA zone X (unshaded) · 99% chance over 30 yrs
- Wildfire 1/10 Low
- Heat 2/10 Low 7 d/yr ≥97°F today · 14 d/yr by 30 yrs out
- Wind 2/10 Low
- Air quality 2/10 Low 1 unhealthy d/yr today · 2 by 30 yrs out
Nearby sold comps map
Loading sold comps map…
Walkable amenities ~0.75 mi
Loading nearby amenities…
Taxation est. · year 1
- Rental income
- $14,393
- − Mortgage interest
- −$5,601
- − Property taxes
- −$2,568
- − Insurance
- −$1,166
- − Repairs & maintenance
- −$1,151
- − Management
- −$1,151
- − Depreciation
- −$2,909
- Taxable loss
- −$155
- Est. tax savings @ 24.0%
- +$37
- After-tax cash flow
- $1,380/yr
For passive investors: Depreciation is non-cash, so a rental often shows a tax loss while cash-flowing — sheltering income. Rental losses are passive: they offset passive income freely, and up to $25,000/yr can offset ordinary (W-2) income if you actively participate and your MAGI is under $100k (phasing out to $0 by $150k); unused losses carry forward. On sale, claimed depreciation is recaptured at up to 25%, and gains may owe capital-gains tax (a 1031 exchange can defer both). Figures are a year-1 estimate at your 24.0% rate — not tax advice; consult a CPA.
Schools (NCES district)
- District
- Clio Area School District
- NCES district ID
- 2610110
- Math proficiency
- 27% ▼ -4.00%
- Reading proficiency
- 44% ▼ -7.00%
- Median HH income
- $51,368
- Composite
- 30.83/100
- National rank
- #6134
- State rank
- #269 of 540 in MI
Livability — Clio
- Score
- 69/100
- State rank
- #332
- US rank
- #8154
Category grades
Schools grade is shown separately in the Schools card above.
Census & demographics
- Census place
- Clio, MI
- Population (ZIP)
- 21,213
Population outlook (Genesee County) Hauer SSP2
- Today (2025)
- 381,312 people
- By 2030
- 362,731 · -4.9%
- By 2040
- 321,550 · -15.7%
- By 2050
- 279,212 · -26.8%
- By 2075
- 193,336 · -49.3%
- By 2100
- 128,118 · -66.4%
Race, ethnicity, and origin ACS 2023
- Neighborhood character
- Predominantly White (89%)
- Race & ethnicity
- White 89% Hispanic / Latino 4% Two or more races 3% Black 3%
- Common ancestry
- Romanian 8% Lithuanian 5% Italian 4%
- Foreign-born
- 2% · Canada
- Languages at home
- 96% English-only · Spanish 2% Other Indo-European 1%
Political lean MEDSL · Genesee
- 2024 margin
- Toss-up / Even · D 51.4% · R 47.2% · Other 1.4%
- 2008→2024 swing
- -28.3pp toward R · 2008: 32.5pp · 2024: 4.2pp
- All cycles
- 2024: D+4.2 2020: D+9.3 2016: D+9.5 2012: D+28.2 2008: D+32.5
Not yet ingested
- Civics
- —
Market trends
- HPI YoY
- ▼ -192.27%
- Current HPI
- 186.7816
- Rent YoY
- —
- Metro
- —
- State GDP YoY
- ▲ 1.37%
- F500 in state
- 28
Industry mix (Fortune 500 HQ in MI)
| Industry | F500 HQs | Revenue |
|---|---|---|
| Automotive Parts | 3 | $48B |
|
||
| Automotive | 2 | $372B |
|
||
| Chemicals | 1 | $45B |
|
||
| Automotive Retail | 1 | $29B |
|
||
| Healthcare / Medical Devices | 1 | $23B |
|
||
| Automotive Technology | 1 | $20B |
|
||
Price history
+11.2% since first listed44 events — show timeline
- 2026-03-16 Pending — MiRealSource-MiMLS
- 2026-03-16 Pending — REALCOMP
- 2026-02-27 Listed $99,999 REALCOMP
- 2026-02-27 Listed $99,999 MiRealSource-MiMLS
- 2024-04-08 Listing Removed — MiRealSource-MiMLS
- 2024-04-08 Listing Removed — REALCOMP
- 2024-03-28 Relisted — REALCOMP
- 2024-03-28 Relisted — MiRealSource-MiMLS
- 2024-03-27 Pending — REALCOMP
- 2024-03-27 Pending — MiRealSource-MiMLS
- 2024-02-26 Price Changed $109,000 MiRealSource-MiMLS
- 2024-02-26 Price Changed $109,000 REALCOMP
- 2024-01-19 Price Changed $120,000 MiRealSource-MiMLS
- 2024-01-18 Price Changed $120,000 REALCOMP
- 2024-01-11 Relisted — REALCOMP
- 2024-01-11 Relisted — MiRealSource-MiMLS
- 2024-01-07 Listing Removed — MiRealSource-MiMLS
- 2024-01-06 Listing Removed — REALCOMP
- 2023-12-06 Listed $149,900 MiRealSource-MiMLS
- 2023-12-06 Listed $149,900 REALCOMP
- 2014-03-06 Listing Removed — MiRealSource-MiMLS
- 2014-03-06 Listing Removed — REALCOMP
- 2013-12-18 Listing Removed — MiRealSource-MiMLS
- 2013-12-17 Listing Removed — REALCOMP
- 2013-11-13 Listed $34,549 MiRealSource-MiMLS
- 2013-11-13 Listed $34,549 REALCOMP
- 2013-11-05 Listing Removed — REALCOMP
- 2013-11-05 Listing Removed — MiRealSource-MiMLS
- 2013-10-14 Listed $40,000 REALCOMP
- 2013-10-14 Listed $40,000 MiRealSource-MiMLS
- 2013-07-22 Listed $45,500 REALCOMP
- 2013-07-22 Listed $45,500 MiRealSource-MiMLS
- 2011-02-09 Sold (MLS) $31,010 REALCOMP
- 2010-12-24 Listed $31,000 REALCOMP
- 2010-05-01 Listing Removed — MiRealSource-MiMLS
- 2010-05-01 Listing Removed — REALCOMP
- 2009-05-29 Listed $39,000 MiRealSource-MiMLS
- 2009-05-29 Listed $39,000 REALCOMP
- 2007-05-14 Sold (Public Records) $85,000 Public Records
- 2007-05-01 Sold (MLS) $85,000 REALCOMP
- 2007-05-01 Sold (MLS) $85,000 MiRealSource-MiMLS
- 2007-04-13 Listing Removed — MiRealSource-MiMLS
- 2006-09-27 Listed $89,900 REALCOMP
- 2006-09-27 Listed $89,900 MiRealSource-MiMLS
Property tax history
+5.6%/yrLatest (2025): $2,568 · +43.0% YoY. Source: county tax records.
Cash-flow waterfall
monthlySold comps — $/sqft
last 12 mo · ≤1 miLoading sold comps…