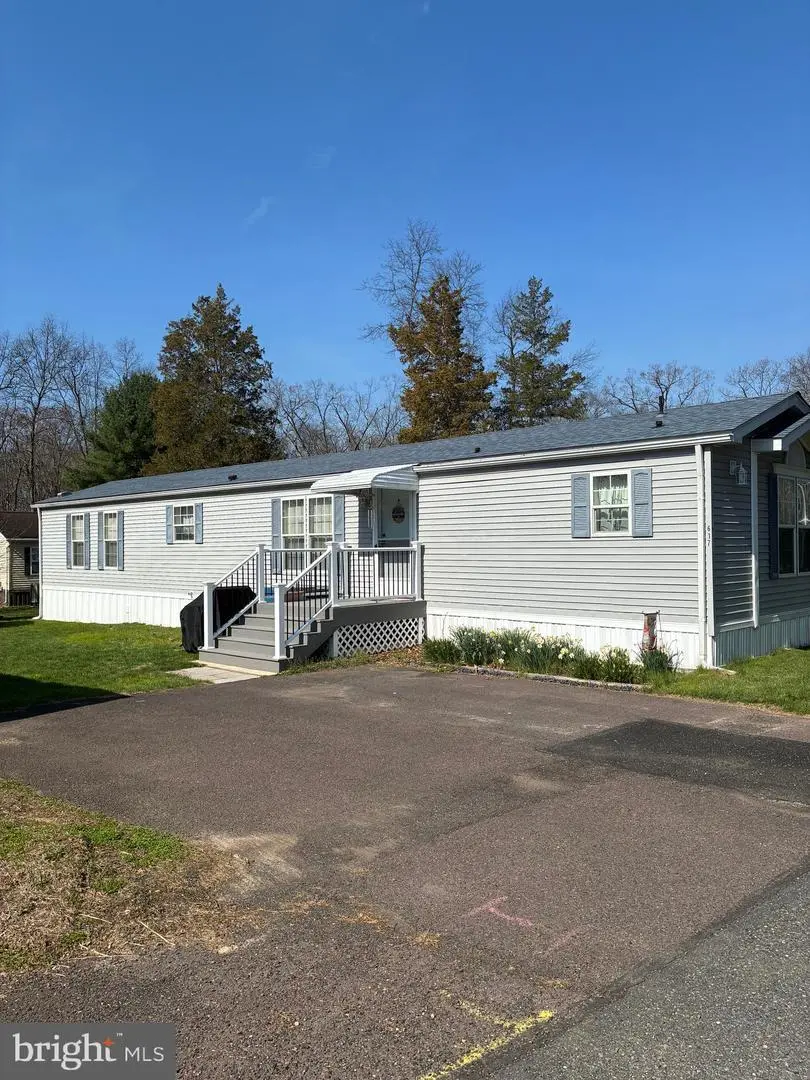
617 Willow Dr · Green Lane, PA
Flood risk 1/10 · Minimal
- FEMA flood zone
- X (unshaded)
- Chance of flooding over 30 yrs
- 0.0%
- Est. flood insurance / yr
- $507 – $1,088
Fire risk 3/10 · Minor
- Est. fire insurance / yr
- $511 – $949
Heat risk 5/10 · Moderate
- Hot days now (above 102°F)
- 7 days/yr
- Hot days in 30 yrs
- 15 days/yr
Wind risk 4/10 · Minor
- Chance of severe wind over 30 yrs
- 21.0%
Air-quality risk 2/10 · Minimal
- Unhealthy air days now
- 1 days/yr
- Unhealthy air days in 30 yrs
- 2 days/yr
Risk factors via First Street. Map © Google.
Why this score? — see what drove the B+ grade
The composite is a weighted blend of 9 inputs, each scored 0–100. Each bar is that input's sub-score; the figure is the points it added to the 100-point composite (weight × sub-score).
- Cash flow +30.0/30.0
- 1% rule +10.0/10.0
- DSCR +10.0/10.0
- Appreciation +7.6/10.0
- ARV discount +7.5/15.0
- Schools +4.2/10.0
- Livability +3.4/5.0
- Rent growth +2.5/5.0
- Condition / age +2.5/5.0
$74,900
🖨 Deal sheet 📄 Offer letter ✓ Due diligence
Listing remarks MLS
* * MOVE IN READY! This home is in excellent condition and ready for its new owner. Quick settlement possible! * *
Key facts
- New roof
- 2 parking spots
- Built 2004
Tags
Property features AI
Finance
- HOA & community: Land lease: $941 monthly; Property manager present; Located in Green Hill Mobile Home Park
Exterior
- Parking: Driveway parking (2 spaces); Total of 2 garage/parking spaces
- Utilities: Private sewer; Community water; Municipal trash service
- Home design: Manufactured home (Single wide); Model: Marlette; Land lease ownership; Property listed in excellent condition
- Construction: Vinyl siding
- Exterior features: Porch(es); Shed; Pets allowed on a case-by-case basis
Interior
- Kitchen: Eat-in kitchen with island
- Bedrooms: 2 bedrooms on the main level
- Flooring: Carpet
- Bathrooms: 2 full bathrooms (both on the main level)
- Heating & cooling: Central heating (electric); Central air conditioning (electric); Electric hot water
- Interior features: Soaking tub; Stall shower; Ceiling fan(s); Eat-in kitchen; Kitchen island
- Laundry & utility: No basement
Neighborhood map
What this means for you Summary
Snapshot
- This is a 2-bed/2.0-bath manufactured listed at $75k.
Deal economics
- At list price, monthly cash flow is $1k ($14k/yr) — positive.
- The deal already cash-flows at list — no discount required.
- Meets the 1% rule at list price ($2k rent vs $75k).
Location & tenants
- Location reads 67/100 on livability (#989 in PA) — a middle-class / working-renter tenant base. Strengths: cost of living A+, crime B; Watch: amenities F, commute F, employment F.
- Upper Perkiomen SD (suburban): math 39% / reading 55% proficiency, ranked #189 of 539 in PA (top 35%) — families likely to look elsewhere, expect single-tenant / working-renter base with shorter leases.
- Market conditions: 24 active listings in the ZIP; 1,936 units permitted in Montgomery County in 2024 (530 in 5+ unit buildings).
Forward outlook
- In year one you build about $4k of equity ($518 loan paydown + $4k appreciation (5.3% local appreciation)).
- Montgomery County population projected at +5% by 2050 — modest demand growth; plan on rents tracking national, not racing it.
- At projected returns (5.3% appreciation + 3.0% rent growth), your $21k cash investment doubles in ~2 years — after that, you're playing with house money.
- By year 8, paydown + projected appreciation supports a ~$34k cash-out refi (75% LTV) — recoverable capital for the next deal without selling this one.
Negotiation context
- Only 13 days on market — expect competitive offers; lowballing is unlikely to land.
- 3 sale attempts since 32y ago with the ask held roughly flat each time — persistent listings suggest the price (not the market) is what's stuck; bring a comps-based counter.
Risks & watch-outs
- Climate carrying-cost: extreme-heat days projected 7→15/yr by 2055 (HVAC capex compounding) — expect insurance premiums to compound above CPI over the hold.
Questions for the listing agent
- Is there a deadline driving the sale (1031 exchange, divorce, estate, relocation)? That informs how much negotiation room exists.
- What's the average days-on-market for RENTAL listings here right now (not sales)? A rising rental-DOM trend means longer vacancies and softer asking-rent achievability than the comps imply.
- What's the recent tenant-quality profile in this submarket — average credit score on applications, eviction rate, late-payment / NSF rate, and stable-employment percentage? A property-management company in the area should have these aggregated.
- How much new for-sale + rental construction is in the pipeline within 1–3 miles? Heavy new supply typically softens prices + rents 12–24 months out; constrained supply supports both.
Investment metrics
- 1% rule
- 2.81% ✓
- Cap rate
- 24.42%
- Cash-on-cash
- 64.73%
- DSCR
- 3.88
- GRM
- 3.0
CMA / ARV
No comps found within radius.
Projected returns pro-forma
5.3% appreciation · 3.0% rent growth · sell at horizon
- IRR
- 71.7%
- Equity multiple
- 5.32×
- Total profit
- $90,619
- Equity at exit
- $43,793
- IRR
- 69.4%
- Equity multiple
- 11.07×
- Total profit
- $211,172
- Equity at exit
- $76,721
Cash invested: $20,972 (down + closing). Projections, not guarantees.
Landlord ↔ Tenant lean methodology
- Overall (STATE)
- 62 Landlord-Friendly
- State Pennsylvania
- 62 Landlord-Friendly · EVEN
- County
- — inherits STATE
- City
- — inherits STATE
ZIP-level market 18054
- Home prices YoY
- 1.9%
- Active inventory
- 24
- Price-to-rent
- 3.0×
Monthly cashflow live
- Estimated rent
- $2,105 medium interval (Pro) →
- Mortgage (P&I)
- −$393
- Tax from tax record
- −$108 /mo · $1,293/yr
- Insurance
- −$31
- HOA
- −$0
- Vacancy / Maint / Mgmt
- −$442
- Net cashflow
- $1,131
Break-even live
UW: 25.0% down · 7.5% · 30yr · 1.5% tax · 5.0% vac · 8.0% maint · 8.0% mgmt
Financing live
Cash to close
- Down payment
- $18,725
- Closing costs
- $2,247
- Reserves months
- —
- Total cash needed
- —
Loan-product check · same deal, 3 products live
Conventional
25% down · 7.5% · 30yr
- Down + closing
- —
- Monthly P&I
- —
- Monthly cashflow
- —
- DSCR
- —
- Eligible?
- —
Personal DTI + credit; lowest rate.
DSCR
20% down · 8.5% · 30yr
- Down + closing
- —
- Monthly P&I
- —
- Monthly cashflow
- —
- DSCR
- —
- Eligible?
- —
No personal income docs; deal must DSCR.
Hard money
10% down · 12.0% · 12mo
- Down + closing
- —
- Monthly P&I
- —
- Monthly cashflow
- —
- DSCR
- —
- Eligible?
- —
Short-term bridge; refi at stabilization.
Listing history 8 events
-
2026-04-24historical Active Under Contract
-
2026-04-11$74,900 Active
-
2023-11-13soldstatus $69,900 Closed 118-char remark
Show marketing remark (118 chars)
* * MOVE IN READY! This home is in excellent condition and ready for its new owner. Quick settlement possible! * *
-
2023-10-11status Pending 118-char remark
Show marketing remark (118 chars)
* * MOVE IN READY! This home is in excellent condition and ready for its new owner. Quick settlement possible! * *
-
2023-10-10$69,900 Active 118-char remark
Show marketing remark (118 chars)
* * MOVE IN READY! This home is in excellent condition and ready for its new owner. Quick settlement possible! * *
-
2023-10-09historical $69,900 118-char remark
Show marketing remark (118 chars)
* * MOVE IN READY! This home is in excellent condition and ready for its new owner. Quick settlement possible! * *
-
1995-05-03soldstatus $14,000 105-char remark
Show marketing remark (105 chars)
Spartan Mobile Located In The Country $240/Mo Incl Water Sewer & Trash On Rented Land Ready To Sell
-
1994-08-01$14,000 105-char remark
Show marketing remark (105 chars)
Spartan Mobile Located In The Country $240/Mo Incl Water Sewer & Trash On Rented Land Ready To Sell
ⓘ Source: listings_history table (triggers on properties + properties_extension) + one-shot
backfill from property_details.listing_events for pre-trigger history.
Tax reassessment forecast PA · Partial reset (capped growth)
- Current annual tax
- $1,293 · $108/mo
- Projected year-2 tax
- $1,293 · $108/mo
- Expected delta
- $0/yr ($0/mo · 0.0%)
ⓘ Screening estimate from a state-policy table — verify with the county assessor before closing.
Climate risk First Street
- Flood 1/10 Low FEMA zone X (unshaded) · 0% chance over 30 yrs
- Wildfire 3/10 Moderate
- Heat 5/10 Major 7 d/yr ≥102°F today · 15 d/yr by 30 yrs out
- Wind 4/10 Moderate 21% chance of damaging wind over 30 yrs
- Air quality 2/10 Low 1 unhealthy d/yr today · 2 by 30 yrs out
Nearby sold comps map
Loading sold comps map…
Walkable amenities ~0.75 mi
Loading nearby amenities…
Taxation est. · year 1
- Rental income
- $25,260
- − Mortgage interest
- −$4,196
- − Property taxes
- −$1,293
- − Insurance
- −$374
- − Repairs & maintenance
- −$2,021
- − Management
- −$2,021
- − Depreciation
- −$2,179
- Taxable income
- $13,177
- Est. tax owed @ 24.0%
- −$3,162
- After-tax cash flow
- $10,412/yr
For passive investors: Depreciation is non-cash, so a rental often shows a tax loss while cash-flowing — sheltering income. Rental losses are passive: they offset passive income freely, and up to $25,000/yr can offset ordinary (W-2) income if you actively participate and your MAGI is under $100k (phasing out to $0 by $150k); unused losses carry forward. On sale, claimed depreciation is recaptured at up to 25%, and gains may owe capital-gains tax (a 1031 exchange can defer both). Figures are a year-1 estimate at your 24.0% rate — not tax advice; consult a CPA.
Schools (NCES district)
- District
- Upper Perkiomen SD
- NCES district ID
- 4224540
- Math proficiency
- 39% ▼ -13.00%
- Reading proficiency
- 55% ▼ -12.00%
- Median HH income
- $68,322
- Composite
- 41.99/100
- National rank
- #3337
- State rank
- #189 of 539 in PA
Livability — Green Lane
- Score
- 67/100
- State rank
- #989
- US rank
- #10897
Category grades
Schools grade is shown separately in the Schools card above.
Census & demographics
- Population (ZIP)
- 4,714
Population outlook (Montgomery County) Hauer SSP2
- Today (2025)
- 856,074 people
- By 2030
- 870,887 · +1.7%
- By 2040
- 891,195 · +4.1%
- By 2050
- 896,417 · +4.7%
- By 2075
- 903,212 · +5.5%
- By 2100
- 843,240 · -1.5%
Race, ethnicity, and origin ACS 2023
- Neighborhood character
- Predominantly White (95%)
- Race & ethnicity
- White 95% Two or more races 3% Hispanic / Latino 2%
- Common ancestry
- Romanian 4% Lithuanian 3% Iranian 2%
- Foreign-born
- 5% · Canada, South Korea
- Languages at home
- 96% English-only · Arabic 2% Spanish 1%
Political lean MEDSL · Montgomery
- 2024 margin
- Strong D (+22.8) · D 60.9% · R 38.1% · Other 1.1%
- 2008→2024 swing
- +2.0pp toward D · 2008: 20.8pp · 2024: 22.8pp
- All cycles
- 2024: D+22.8 2020: D+26.3 2016: D+21.1 2012: D+14.3 2008: D+20.8
Not yet ingested
- Civics
- —
Market trends
- HPI YoY
- ▲ 5.30%
- Current HPI
- 289.0447
- Rent YoY
- —
- Metro
- —
- State GDP YoY
- ▲ 1.68%
- F500 in state
- 34
Industry mix (Fortune 500 HQ in PA)
| Industry | F500 HQs | Revenue |
|---|---|---|
| Healthcare | 2 | $309B |
|
||
| Insurance | 2 | $27B |
|
||
| Telecommunications / Media | 1 | $124B |
|
||
| Industrial Distribution | 1 | $22B |
|
||
| Financial Services | 1 | $20B |
|
||
| Chemicals / Materials | 1 | $18B |
|
||
Price history
+435.0% since first listed8 events — show timeline
- 2026-04-24 Contingent — BRIGHT MLS
- 2026-04-11 Listed $74,900 BRIGHT MLS
- 2023-11-13 Sold (MLS) $69,900 BRIGHT MLS
- 2023-10-11 Pending — BRIGHT MLS
- 2023-10-10 Listed $69,900 BRIGHT MLS
- 2023-10-09 Coming Soon $69,900 BRIGHT MLS
- 1995-05-03 Sold (MLS) $14,000 BRIGHT MLS
- 1994-08-01 Listed $14,000 BRIGHT MLS
Property tax history
+2.0%/yrLatest (2026): $1,293 · +2.4% YoY. Source: county tax records.
Cash-flow waterfall
monthlySold comps — $/sqft
last 12 mo · ≤1 miLoading sold comps…