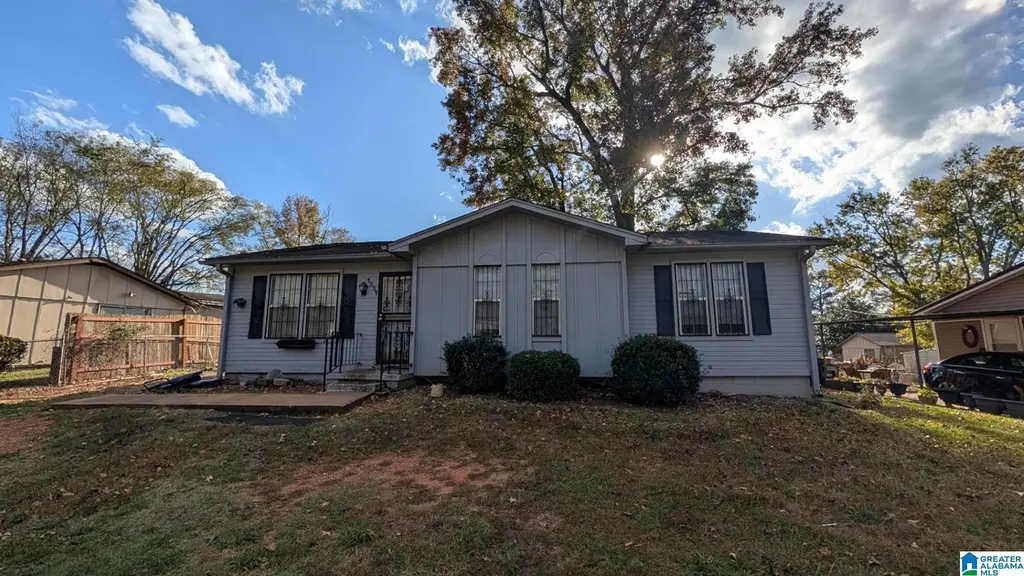
1331 Longbrook Dr · Bessemer, AL
Flood risk 1/10 · Minimal
- FEMA flood zone
- X (unshaded)
- Chance of flooding over 30 yrs
- 0.0%
- Est. flood insurance / yr
- $507 – $1,088
Fire risk 3/10 · Minor
- Est. fire insurance / yr
- $916 – $1,700
Heat risk 6/10 · Moderate
- Hot days now (above 108°F)
- 7 days/yr
- Hot days in 30 yrs
- 19 days/yr
Wind risk 6/10 · Moderate
- Chance of severe wind over 30 yrs
- 35.0%
Air-quality risk 3/10 · Minor
- Unhealthy air days now
- 2 days/yr
- Unhealthy air days in 30 yrs
- 5 days/yr
Risk factors via First Street. Map © Google.
Why this score? — see what drove the B- grade
The composite is a weighted blend of 9 inputs, each scored 0–100. Each bar is that input's sub-score; the figure is the points it added to the 100-point composite (weight × sub-score).
- Cash flow +30.0/30.0
- ARV discount +10.7/15.0
- DSCR +10.0/10.0
- 1% rule +8.5/10.0
- Livability +3.0/5.0
- Condition / age +2.5/5.0
- Rent growth +1.7/5.0
- Schools +0.8/10.0
- Appreciation +0.0/10.0
$79,900
🖨 Deal sheet 📄 Offer letter ✓ Due diligence
Listing remarks MLS
Utilities temporarily disconnected, house winterized for safety. Utilities WILL be connected prior to inspection, no issues with plumbing, electrical, HVAC, or roof. Wonderfully quiet neighborhood with well kept houses. Good purchase opportunity for investor, house needs some TLC and renovations but structurally sound.
Key facts
- 8,276 sq ft lot
- Built 1981
- Listed 129 days
Neighborhood map
What this means for you Summary
Snapshot
- This is a 3-bed/2.0-bath single-family listed at $80k.
Deal economics
- At list price, monthly cash flow is $352 ($4k/yr) — positive.
- The deal already cash-flows at list — no discount required.
- Meets the 1% rule at list price ($1k rent vs $80k).
- Recommended offer: $70k (12.0% below list) — sets the bar for market timing.
- Cap rate 11.6% vs local median 5.9% in Bessemer — top-decile yield for the area; either an underpriced asset or a hidden risk that comps aren't pricing in. Stress-test before assuming the spread holds.
Location & tenants
- Location reads 59/100 on livability (#331 in AL) — a working-class tenant base; expect higher turnover. Strengths: commute A+, cost of living A+, housing A; Watch: schools D-, crime F, amenities F.
- Bessemer City (suburban): math 3% / reading 19% proficiency, ranked #120 of 129 in AL (top 93%) — low school quality limits family demand, transient renter base, plan for 1-2y turnover; 87% free/reduced lunch — lower-income household profile, screen leases tightly.
- Market conditions: Rents falling (-3.1%/yr); 115 active listings in the ZIP; 29 comparable units currently listed for rent nearby; rentals at typical pace (median 24d on market — plan ~3-4 weeks tenant-placement turnaround); lower-income renter base — watch delinquency; 2,114 units permitted in Jefferson County in 2024 (556 in 5+ unit buildings).
- This rent runs 37% of the median local income ($35k/yr) — at the standard rent-burdened threshold; future hikes will face affordability resistance.
Forward outlook
- Local home prices are declining (-3.0%/yr); year-one equity from $552 of loan paydown is wiped out by about $2k of value loss. Plan a longer hold.
- Jefferson County population projected to shrink 4% by 2050 — rents likely to lag national; underwrite the cash flow, not the appreciation.
- At projected returns (-3.0% appreciation + 0.0% rent growth), your $22k cash investment doubles in ~9 years — after that, you're playing with house money.
Negotiation context
- It's been on market 129 days — a 12% lower offer ($70k) is reasonable based on typical stale-listing flexibility.
- Current owner paid $56k; 43% above their basis — modest negotiation headroom, anchor on the comps not their cost.
Risks & watch-outs
- Climate carrying-cost: major wind risk, 35% chance of damaging wind over 30y; extreme-heat days projected 7→19/yr by 2055 (HVAC capex compounding) — expect insurance premiums to compound above CPI over the hold.
Questions for the listing agent
- It's been on market 129 days. Have you received any prior offers? Is the seller open to a 12% concession, seller financing, or rate buy-down credit?
- Why hasn't it sold? Are there any deal-killer items the seller is aware of (foundation, flood, title, zoning, code violations)?
- Is there a deadline driving the sale (1031 exchange, divorce, estate, relocation)? That informs how much negotiation room exists.
- Schools are D-rated, which usually means shorter tenancies and higher turnover. Who's the typical renter profile here, and what's been the actual vacancy rate?
- Crime grade is F in this area — have there been break-ins, vandalism, or insurance claims at this property in the last 3 years? What carrier currently insures it and at what premium?
- What's the average days-on-market for RENTAL listings here right now (not sales)? A rising rental-DOM trend means longer vacancies and softer asking-rent achievability than the comps imply.
- What's the recent tenant-quality profile in this submarket — average credit score on applications, eviction rate, late-payment / NSF rate, and stable-employment percentage? A property-management company in the area should have these aggregated.
- How much new for-sale + rental construction is in the pipeline within 1–3 miles? Heavy new supply typically softens prices + rents 12–24 months out; constrained supply supports both.
Investment metrics
- 1% rule
- 1.35% ✓
- Cap rate
- 11.58%
- Cash-on-cash
- 18.89%
- DSCR
- 1.84
- GRM
- 6.2
CMA / ARV
- ARV (median comp)
- $86,091
- List price
- $79,900
- Delta
- -7.19%
- Verdict
- FAIR
- Comps
- 20 within 1.0 mi
Show comp detail 8 sales within ~0.75 mi
| Address | Dist | Beds/Ba | Sqft | Sold | Price | $/sf | Match |
|---|---|---|---|---|---|---|---|
| 426 11th St S | 0.21mi | 2/1.0 (-1) | 1,120 (+4%) | 5mo | $40,000 | $36 | 71 |
| 1009 Avenue G | 0.36mi | 4/1.5 (+1) | 1,108 (+3%) | 6mo | $100,000 | $90 | 67 |
| 1615 Dartmouth Ave | 0.30mi | 3/1.0 | 1,186 (+10%) | 4mo | $47,500 | $40 | 62 |
| 223 9th St S | 0.42mi | 2/1.0 (-1) | 1,117 (+3%) | 11mo | $95,000 | $85 | 56 |
| 802 Clarendon Ave | 0.47mi | 2/2.0 (-1) | 1,214 (+12%) | 5mo | $106,000 | $87 | 48 |
| 1008 Avenue H | 0.41mi | 3/2.0 | 1,215 (+12%) | 16mo | $85,000 | $70 | 47 |
| 600 Mcadory Ave | 0.73mi | 3/2.0 | 1,014 (-6%) | 16mo | $55,000 | $54 | 42 |
| 912 Avenue I | 0.47mi | 2/1.0 (-1) | 926 (-14%) | 13mo | $25,500 | $28 | 34 |
Match score weights: distance 35% · size 25% · config 20% · recency 20%. Top-matched comps best support the ARV.
Projected returns pro-forma
-3.0% appreciation · 0.0% rent growth · sell at horizon
- IRR
- 7.4%
- Equity multiple
- 1.28×
- Total profit
- $6,295
- Equity at exit
- $11,913
- IRR
- 14.1%
- Equity multiple
- 1.99×
- Total profit
- $22,049
- Equity at exit
- $6,908
Cash invested: $22,372 (down + closing). Projections, not guarantees.
Landlord ↔ Tenant lean methodology
- Overall (STATE)
- 90 Strongly Landlord-Friendly
- State Alabama
- 90 Strongly Landlord-Friendly · R+15
- County
- — inherits STATE
- City
- — inherits STATE
ZIP-level market 35020
- Home prices YoY
- -24.2%
- Rents YoY
- -3.1%
- Active inventory
- 115
- Price-to-rent
- 6.2×
Monthly cashflow live
- Estimated rent
- $1,082 high interval (Pro) →
- Mortgage (P&I)
- −$419
- Tax from tax record
- −$50 /mo · $605/yr
- Insurance
- −$33
- HOA
- −$0
- Vacancy / Maint / Mgmt
- −$227
- Net cashflow
- $352
Break-even live
UW: 25.0% down · 7.5% · 30yr · 1.5% tax · 5.0% vac · 8.0% maint · 8.0% mgmt
Financing live
Cash to close
- Down payment
- $19,975
- Closing costs
- $2,397
- Reserves months
- —
- Total cash needed
- —
Loan-product check · same deal, 3 products live
Conventional
25% down · 7.5% · 30yr
- Down + closing
- —
- Monthly P&I
- —
- Monthly cashflow
- —
- DSCR
- —
- Eligible?
- —
Personal DTI + credit; lowest rate.
DSCR
20% down · 8.5% · 30yr
- Down + closing
- —
- Monthly P&I
- —
- Monthly cashflow
- —
- DSCR
- —
- Eligible?
- —
No personal income docs; deal must DSCR.
Hard money
10% down · 12.0% · 12mo
- Down + closing
- —
- Monthly P&I
- —
- Monthly cashflow
- —
- DSCR
- —
- Eligible?
- —
Short-term bridge; refi at stabilization.
Rent comps 29 comps
| Address | Beds | Baths | Sqft | Rent | $/sqft | DOM | Units | Dist |
|---|---|---|---|---|---|---|---|---|
| 931 Dartmouth Ave Bessemer, AL | 3.0 | 1.0 | 984 | $925 | $0.94 | 44d | 1 | 0.29mi |
| 1622 Fairfax Ave Bessemer, AL | 2.0 | 2.0 | 1104 | $995 | $0.90 | 2d | 1 | 0.36mi |
| 1600 Holbrook Ave Bessemer, AL | 3.0 | 1.0 | 885 | $999 | $1.13 | 2d | 1 | 0.41mi |
| 208 9th Ct S Bessemer, AL | 2.0 | 1.0 | 784 | $650 | $0.83 | 24d | 1 | 0.42mi |
| 810 Fairfax Ave Bessemer, AL | 3.0 | 1.0 | 1042 | $1,050 | $1.01 | 24d | 1 | 0.43mi |
| 808 Fairfax Ave Bessemer, AL | 3.0 | 1.0 | 1042 | $1,050 | $1.01 | 24d | 1 | 0.43mi |
| 420 19th St S Bessemer, AL | 2.0 | 1.0 | 910 | $850 | $0.93 | 44d | 1 | 0.53mi |
| 1830 Exeter Ave Bessemer, AL | 2.0 | 1.0 | 913 | $850 | $0.93 | 44d | 1 | 0.53mi |
| 419 19th St S Bessemer, AL | 3.0 | 2.0 | 1200 | $1,050 | $0.88 | 12d | 1 | 0.56mi |
| 622 Jefferson Ave Bessemer, AL | 2.0 | 1.0 | 800 | $850 | $1.06 | 21d | 1 | 0.59mi |
| 622 Jefferson Ave Unit 622 Bessemer, AL | 2.0 | 1.0 | 800 | $850 | $1.06 | 3d | 1 | 0.59mi |
| 1307 3rd Ave N Bessemer, AL | 4.0 | 1.0 | 960 | $1,200 | $1.25 | 44d | 1 | 0.60mi |
| 704 Avenue I Bessemer, AL | 3.0 | 1.0 | 1232 | $1,200 | $0.97 | 24d | 1 | 0.62mi |
| 1909 Holbrook Ave Bessemer, AL | 2.0 | 1.0 | 1064 | $930 | $0.87 | 44d | 1 | 0.66mi |
| 806 4th Ave N Bessemer, AL | 3.0 | 1.0 | 1092 | $1,050 | $0.96 | 24d | 1 | 0.84mi |
| 830 5th Ave N Bessemer, AL | 3.0 | 1.0 | 1072 | $1,000 | $0.93 | 44d | 1 | 0.86mi |
| 300 Norwood Ave Bessemer, AL | 3.0 | 1.0 | 966 | $1,000 | $1.04 | 24d | 1 | 1.00mi |
| 300 Norwood Ave Bessemer, AL | 3.0 | 1.0 | 966 | $900 | $0.93 | 12d | 1 | 1.00mi |
| 719 16th St N Bessemer, AL | 3.0 | 1.5 | 1085 | $1,075 | $0.99 | 24d | 1 | 1.04mi |
| 236 Clifton St Bessemer, AL | 3.0 | 1.0 | 1450 | $1,100 | $0.76 | 44d | 1 | 1.06mi |
| 817 15th St N Bessemer, AL | 3.0 | 2.0 | 1116 | $1,125 | $1.01 | 3d | 1 | 1.10mi |
| 18 Center St Bessemer, AL | 3.0 | 1.0 | 1418 | $1,100 | $0.78 | 44d | 1 | 1.11mi |
| 10 Center St Bessemer, AL | 3.0 | 1.0 | 1152 | $1,000 | $0.87 | 44d | 1 | 1.13mi |
| 1015 11th St N Bessemer, AL | 2.0 | 1.0 | 876 | $975 | $1.11 | 12d | 1 | 1.27mi |
| 410 W Lake Dr Bessemer, AL | 2.0 | 1.0 | 780 | $875 | $1.12 | 10d | 1 | 1.28mi |
| 510 W Lake Dr Bessemer, AL | 3.0 | 1.0 | 950 | $1,025 | $1.08 | 16d | 1 | 1.29mi |
| 531 W Lake Dr Bessemer, AL | 3.0 | 1.0 | 1014 | $1,200 | $1.18 | 3d | 1 | 1.29mi |
| 512 W Lake Dr Bessemer, AL | 3.0 | 1.0 | 944 | $1,125 | $1.19 | 12d | 1 | 1.29mi |
| 63 Bluebell St Bessemer, AL | 4.0 | 2.0 | 1232 | $1,399 | $1.14 | 16d | 1 | 1.30mi |
Listing history 19 events
-
2026-06-18days on market $79,900 Active 129 DOM
-
2026-06-17days on market $79,900 Active 128 DOM
-
2026-06-16days on market $79,900 Active 127 DOM
-
2026-06-15days on market $79,900 Active 126 DOM
-
2026-06-13days on market $79,900 Active 124 DOM
-
2026-06-10days on market $79,900 Active 121 DOM
-
2026-06-09days on market $79,900 Active 120 DOM
-
2026-06-08days on market $79,900 Active 119 DOM
-
2026-06-07days on market $79,900 Active 118 DOM
-
2026-06-05days on market $79,900 Active 115 DOM
-
2026-06-03days on market $79,900 Active 114 DOM
-
2026-06-02days on market $79,900 Active 113 DOM
-
2026-06-01pricedays on market $79,900 Active 112 DOM
-
2026-05-31days on market $89,900 Active 111 DOM
-
2026-03-27price $89,900 320-char remark
Show marketing remark (320 chars)
Utilities temporarily disconnected, house winterized for safety. Utilities WILL be connected prior to inspection, no issues with plumbing, electrical, HVAC, or roof. Wonderfully quiet neighborhood with well kept houses. Good purchase opportunity for investor, house needs some TLC and renovations but structurally sound.
-
2026-02-09$99,900 Active 320-char remark
Show marketing remark (320 chars)
Utilities temporarily disconnected, house winterized for safety. Utilities WILL be connected prior to inspection, no issues with plumbing, electrical, HVAC, or roof. Wonderfully quiet neighborhood with well kept houses. Good purchase opportunity for investor, house needs some TLC and renovations but structurally sound.
-
1999-12-06soldstatus $56,000
-
1989-09-21soldstatus $41,190
-
1981-08-01soldstatus $38,200
ⓘ Source: listings_history table (triggers on properties + properties_extension) + one-shot
backfill from property_details.listing_events for pre-trigger history.
Tax reassessment forecast AL · Resets to sale price
- Current annual tax
- $605 · $50/mo
- Projected year-2 tax
- $605 · $50/mo
- Expected delta
- $0/yr ($0/mo · 0.0%)
ⓘ Screening estimate from a state-policy table — verify with the county assessor before closing.
Climate risk First Street
- Flood 1/10 Low FEMA zone X (unshaded) · 0% chance over 30 yrs
- Wildfire 3/10 Moderate
- Heat 6/10 Major 7 d/yr ≥108°F today · 19 d/yr by 30 yrs out
- Wind 6/10 Major 35% chance of damaging wind over 30 yrs
- Air quality 3/10 Moderate 2 unhealthy d/yr today · 5 by 30 yrs out
Nearby sold comps map
Loading sold comps map…
Walkable amenities ~0.75 mi
Loading nearby amenities…
Taxation est. · year 1
- Rental income
- $12,984
- − Mortgage interest
- −$4,476
- − Property taxes
- −$605
- − Insurance
- −$400
- − Repairs & maintenance
- −$1,039
- − Management
- −$1,039
- − Depreciation
- −$2,324
- Taxable income
- $3,103
- Est. tax owed @ 24.0%
- −$745
- After-tax cash flow
- $3,481/yr
For passive investors: Depreciation is non-cash, so a rental often shows a tax loss while cash-flowing — sheltering income. Rental losses are passive: they offset passive income freely, and up to $25,000/yr can offset ordinary (W-2) income if you actively participate and your MAGI is under $100k (phasing out to $0 by $150k); unused losses carry forward. On sale, claimed depreciation is recaptured at up to 25%, and gains may owe capital-gains tax (a 1031 exchange can defer both). Figures are a year-1 estimate at your 24.0% rate — not tax advice; consult a CPA.
Schools (NCES district)
- District
- Bessemer City
- NCES district ID
- 0100330
- Math proficiency
- 3% ▼ -18.00%
- Reading proficiency
- 19% ▼ -3.00%
- Median HH income
- $29,721
- Composite
- 8.45/100
- National rank
- #9905
- State rank
- #120 of 129 in AL
Livability — Bessemer
- Score
- 59/100
- State rank
- #331
- US rank
- #20078
Category grades
Schools grade is shown separately in the Schools card above.
Census & demographics
- Census place
- Bessemer, AL
- County
- Jefferson County · 527,445 people
- City population
- 48,018
- Metro
- Birmingham-Hoover, AL
- Population (ZIP)
- 24,892
- Household income
- $35,362
- Rent vs Own
- Severe rent burden
- 1001.0
Population outlook (Jefferson County) Hauer SSP2
- Today (2025)
- 669,185 people
- By 2030
- 669,694 · +0.1%
- By 2040
- 661,388 · -1.2%
- By 2050
- 643,086 · -3.9%
- By 2075
- 577,267 · -13.7%
- By 2100
- 474,758 · -29.1%
Race, ethnicity, and origin ACS 2023
- Neighborhood character
- Predominantly Black (74%)
- Race & ethnicity
- Black 74% Hispanic / Latino 13% White 11% Two or more races 6%
- Hispanic origin (detail)
- Mexican 10%
- Foreign-born
- 5% · Canada
- Languages at home
- 89% English-only · Spanish 11%
Political lean MEDSL · Jefferson
- 2024 margin
- D (+10.4) · D 54.6% · R 44.2% · Other 1.2%
- 2008→2024 swing
- +5.4pp toward D · 2008: 5.1pp · 2024: 10.4pp
- All cycles
- 2024: D+10.4 2020: D+13.2 2016: D+7.2 2012: D+6.0 2008: D+5.1
Not yet ingested
- Civics
- —
Market trends
- HPI YoY
- ▼ -57.54%
- Current HPI
- 179.7702
- Rent YoY
- ▼ -3.12%
- Metro
- Birmingham-Hoover, AL
- State GDP YoY
- ▲ 2.94%
- F500 in state
- 4
Industry mix (Fortune 500 HQ in AL)
| Industry | F500 HQs | Revenue |
|---|---|---|
| Financial Services | 1 | $8B |
|
||
| Healthcare | 1 | $5B |
|
||
Price history
+135.3% since first listed5 events — show timeline
- 2026-03-27 Price Changed $89,900 Greater Alabama MLS
- 2026-02-09 Listed $99,900 Greater Alabama MLS
- 1999-12-06 Sold (Public Records) $56,000 Public Records
- 1989-09-21 Sold (Public Records) $41,190 Public Records
- 1981-08-01 Sold (Public Records) $38,200 Public Records
Property tax history
+4.5%/yrLatest (2025): $605 · +0.0% YoY. Source: county tax records.
Cash-flow waterfall
monthlySold comps — $/sqft
last 12 mo · ≤1 miLoading sold comps…