 🏗️ New Construction
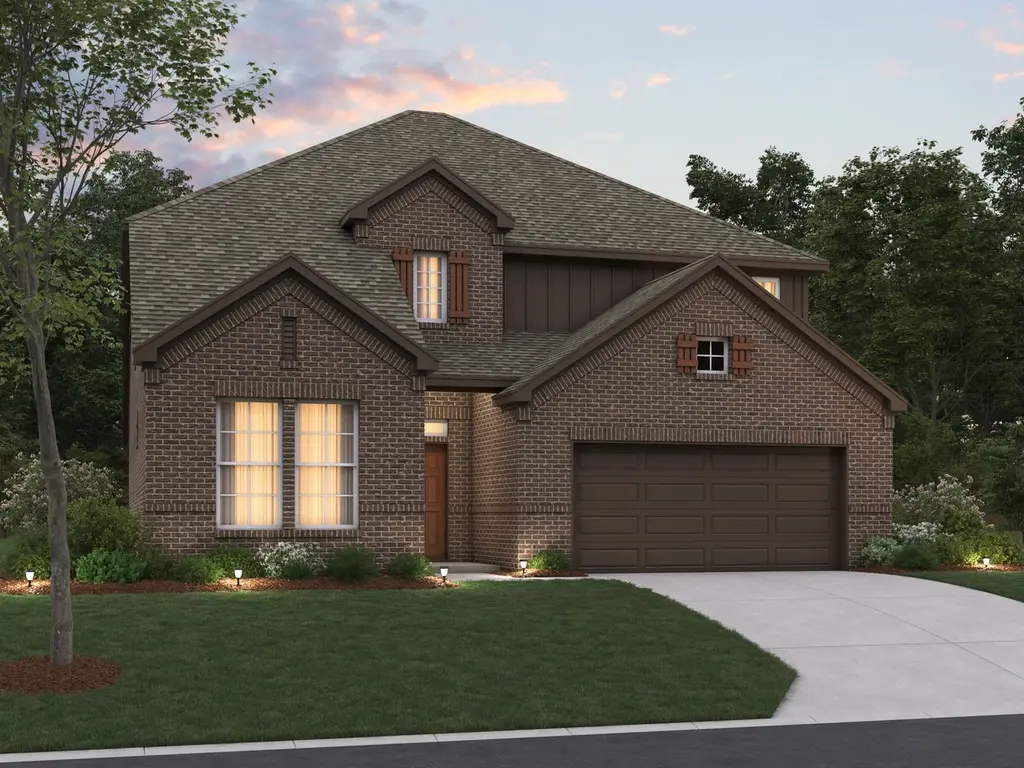
Addison Plan · Fort Worth, TX
Flood risk 1/10 · Minimal
- FEMA flood zone
- X (unshaded)
- Chance of flooding over 30 yrs
- 0.0%
- Est. flood insurance / yr
- $507 – $1,088
Fire risk 3/10 · Minor
- Est. fire insurance / yr
- $1,222 – $2,270
Heat risk 7/10 · Major
- Hot days now (above 109°F)
- 7 days/yr
- Hot days in 30 yrs
- 22 days/yr
Wind risk 6/10 · Moderate
- Chance of severe wind over 30 yrs
- 27.0%
Air-quality risk 3/10 · Minor
- Unhealthy air days now
- 3 days/yr
- Unhealthy air days in 30 yrs
- 4 days/yr
Risk factors via First Street. Map © Google.
Why this score? — see what drove the F grade
The composite is a weighted blend of 9 inputs, each scored 0–100. Each bar is that input's sub-score; the figure is the points it added to the 100-point composite (weight × sub-score).
- ARV discount +7.5/15.0
- Schools +4.6/10.0
- Livability +4.0/5.0
- Cash flow +3.6/30.0
- Rent growth +2.8/5.0
- Condition / age +2.5/5.0
- 1% rule +0.0/10.0
- DSCR +0.0/10.0
- Appreciation +0.0/10.0
$439,990
🖨 Deal sheet 📄 Offer letter ✓ Due diligence
Listing remarks MLS
Step into this brand new Addison floorplan. This layout delivers all of the must-haves you're looking for in a spacious 2 story home design such as tall ceilings, exceptional natural light, plenty of storage space, a large upstairs game room, and dozens of options to personalize your new home. Continue inside to explore everything this Addison plan has to offer.
Key facts
- 2 garage spots
- Listed 79 days
Neighborhood map
What this means for you Summary
Snapshot
- This is a 4-bed/3.0-bath single-family listed at $440k.
Deal economics
- At list price, monthly cash flow is $-2k ($-22k/yr) — negative.
- To cash-flow at today's rent, offer at most $358k (18.7% below list).
- To meet the 1% rule (rent ≥ 1% of price), the offer needs to be $313k (28.9% below list).
- Recommended offer: $313k (28.9% below list) — sets the bar for 1% rule.
- Cap rate 2.7% vs local median 3.9% in Fort Worth — below-typical yield; the buyer is paying a premium for something (appreciation thesis, condition, location) that the cap rate doesn't capture.
Location & tenants
- Location reads 80/100 on livability (#49 in TX, #1,954 nationally) — a professional / high-income tenant draw. Strengths: amenities A+, cost of living A+, housing A+; Watch: schools D+, crime F.
- Northwest ISD (rural): math 48% / reading 52% proficiency, ranked #120 of 826 in TX (top 14%) — acceptable for families but not a draw, mixed tenant base, ~2y average lease.
- Market conditions: Rents rising (+1.1%/yr); 1083 active listings in the ZIP; 13 comparable units currently listed for rent nearby; rentals at typical pace (median 17d on market — plan ~3-4 weeks tenant-placement turnaround); high-income renter base; 18,938 units permitted in Tarrant County in 2024 (8,336 in 5+ unit buildings).
Forward outlook
- Local home prices are declining (-3.0%/yr); year-one equity from $4k of loan paydown is wiped out by about $19k of value loss. Plan a longer hold.
- Tarrant County population projected at +41% by 2050 — long-run rental-demand tailwind backs the buy-and-hold thesis.
Negotiation context
- It's been on market 79 days — a 6% lower offer ($414k) is reasonable based on typical stale-listing flexibility.
Risks & watch-outs
- Climate carrying-cost: major wind risk, 27% chance of damaging wind over 30y; extreme-heat days projected 7→22/yr by 2055 (HVAC capex compounding) — expect insurance premiums to compound above CPI over the hold.
Questions for the listing agent
- What do current leases actually rent for vs. the listed asking? Can we see a recent rent roll and the last 12 months of T-12 income?
- It's been on market 79 days. Have you received any prior offers? Is the seller open to a 29% concession, seller financing, or rate buy-down credit?
- Why hasn't it sold? Are there any deal-killer items the seller is aware of (foundation, flood, title, zoning, code violations)?
- Is there a deadline driving the sale (1031 exchange, divorce, estate, relocation)? That informs how much negotiation room exists.
- Schools are D-rated, which usually means shorter tenancies and higher turnover. Who's the typical renter profile here, and what's been the actual vacancy rate?
- Crime grade is F in this area — have there been break-ins, vandalism, or insurance claims at this property in the last 3 years? What carrier currently insures it and at what premium?
- The area grade is low — what's the realistic commute time and amenity access for the typical tenant pool here? Any planned neighborhood developments (good or bad) we should know about?
- What's the average days-on-market for RENTAL listings here right now (not sales)? A rising rental-DOM trend means longer vacancies and softer asking-rent achievability than the comps imply.
- What's the recent tenant-quality profile in this submarket — average credit score on applications, eviction rate, late-payment / NSF rate, and stable-employment percentage? A property-management company in the area should have these aggregated.
- How much new for-sale + rental construction is in the pipeline within 1–3 miles? Heavy new supply typically softens prices + rents 12–24 months out; constrained supply supports both.
Investment metrics
- 1% rule
- 0.50% ✗
- Cap rate
- 2.73%
- Cash-on-cash
- -12.73%
- DSCR
- 0.43
- GRM
- 16.7
CMA / ARV
- ARV (median comp)
- $627,352
- List price
- $439,990
- Delta
- -29.87%
- Verdict
- UNDERPRICED
- Comps
- 20 within 1.0 mi
Show comp detail 10 sales within ~0.75 mi
| Address | Dist | Beds/Ba | Sqft | Sold | Price | $/sf | Match |
|---|---|---|---|---|---|---|---|
| 308 Lonesome Star Trl | 0.52mi | 4/2.5 | 2,812 (-2%) | 0mo | $697,770 | $248 | 71 |
| 225 Lonesome Star Trl | 0.59mi | 4/3.5 | 2,701 (-6%) | 2mo | $585,500 | $217 | 60 |
| 549 Westwood Way Dr | 0.62mi | 4/3.0 | 2,994 (+5%) | 7mo | $650,000 | $217 | 58 |
| 573 Long Meadow Dr | 0.65mi | 4/2.5 | 2,903 (+2%) | 13mo | $625,000 | $215 | 55 |
| 516 Singing Quail Trl | 0.49mi | 4/2.5 | 2,519 (-12%) | 3mo | $675,000 | $268 | 53 |
| 408 Lonesome Star Trl | 0.43mi | 3/4.0 (-1) | 2,965 (+4%) | 22mo | $689,000 | $232 | 47 |
| 717 Lonesome Prairie Trl | 0.63mi | 4/3.0 | 3,217 (+12%) | 6mo | $785,000 | $244 | 45 |
| 116 Lonesome Trl | 0.62mi | 4/2.0 | 2,594 (-9%) | 10mo | $515,000 | $199 | 43 |
| 513 Long Meadow Dr | 0.70mi | 3/2.5 (-1) | 3,062 (+7%) | 8mo | $500,000 | $163 | 42 |
| 495 Long Meadow Dr | 0.73mi | 4/3.0 | 3,048 (+7%) | 16mo | $525,000 | $172 | 41 |
Match score weights: distance 35% · size 25% · config 20% · recency 20%. Top-matched comps best support the ARV.
Projected returns pro-forma
-3.0% appreciation · 1.08% rent growth · sell at horizon
- IRR
- -42.0%
- Equity multiple
- -0.29×
- Total profit
- $-226,190
- Equity at exit
- $93,540
- IRR
- -84.8%
- Equity multiple
- -1.12×
- Total profit
- $-372,972
- Equity at exit
- $54,242
Cash invested: $175,659 (down + closing). Projections, not guarantees.
Landlord ↔ Tenant lean methodology
- Overall (STATE)
- 87 Strongly Landlord-Friendly
- State Texas
- 87 Strongly Landlord-Friendly · R+5
- County
- — inherits STATE
- City
- — inherits STATE
ZIP-level market 76052
- Home prices YoY
- -25.0%
- Rents YoY
- 1.1%
- Active inventory
- 1083
- Price-to-rent
- 11.7×
Monthly cashflow live
- Estimated rent
- $3,130 high interval (Pro) →
- Mortgage (P&I)
- −$3,290
- Tax est. 1.5%
- −$784 /mo · $9,410/yr
- Insurance
- −$261
- HOA
- −$0
- Vacancy / Maint / Mgmt
- −$657
- Net cashflow
- $-1,863
Break-even live
UW: 25.0% down · 7.5% · 30yr · 1.5% tax · 5.0% vac · 8.0% maint · 8.0% mgmt
Financing live
Cash to close
- Down payment
- $156,838
- Closing costs
- $18,821
- Reserves months
- —
- Total cash needed
- —
Loan-product check · same deal, 3 products live
Conventional
25% down · 7.5% · 30yr
- Down + closing
- —
- Monthly P&I
- —
- Monthly cashflow
- —
- DSCR
- —
- Eligible?
- —
Personal DTI + credit; lowest rate.
DSCR
20% down · 8.5% · 30yr
- Down + closing
- —
- Monthly P&I
- —
- Monthly cashflow
- —
- DSCR
- —
- Eligible?
- —
No personal income docs; deal must DSCR.
Hard money
10% down · 12.0% · 12mo
- Down + closing
- —
- Monthly P&I
- —
- Monthly cashflow
- —
- DSCR
- —
- Eligible?
- —
Short-term bridge; refi at stabilization.
Rent comps 13 comps
| Address | Beds | Baths | Sqft | Rent | $/sqft | DOM | Units | Dist |
|---|---|---|---|---|---|---|---|---|
| 11536 Harp Ln Haslet, TX | 4.0 | 2.0 | 1932 | $2,800 | $1.45 | 3d | 1 | 0.77mi |
| 11540 Twining Branch Cir Haslet, TX | 5.0 | 4.0 | 3327 | $3,250 | $0.98 | 20d | 1 | 0.78mi |
| 11540 Twining Branch Cir Haslet, TX | 5.0 | 4.0 | 3327 | $3,250 | $0.98 | 43d | 1 | 0.78mi |
| 937 Crest Breeze Dr Haslet, TX | 4.0 | 3.5 | 3500 | $3,061 | $0.87 | 24d | 1 | 0.86mi |
| 482 Prairie View Dr Haslet, TX | 4.0 | 3.0 | 2229 | $3,095 | $1.39 | 12d | 1 | 0.93mi |
| 201 Roundstone Rd Haslet, TX | 5.0 | 3.0 | 2779 | $3,750 | $1.35 | 19d | 1 | 0.94mi |
| 11332 Gold Canyon Dr Haslet, TX | 4.0 | 2.0 | 1995 | $2,195 | $1.10 | 16d | 1 | 0.98mi |
| 252 Drumcliffe Dr Haslet, TX | 4.0 | 2.0 | 1931 | $2,595 | $1.34 | 7d | 1 | 1.00mi |
| 209 Irish Moss Dr Haslet, TX | 4.0 | 2.0 | 2173 | $2,450 | $1.13 | 1d | 1 | 1.02mi |
| 1104 Pinnacle Ridge Rd Haslet, TX | 5.0 | 4.0 | 3655 | $3,250 | $0.89 | 43d | 1 | 1.07mi |
| 1064 Agape Dr Haslet, TX | 5.0 | 3.5 | 3261 | $3,800 | $1.17 | 24d | 1 | 1.11mi |
| 12424 Brunal Dr Fort Worth, TX | 1.0–4.0 | 1.0–3.5 | 1295 | $3,271 | $2.53 | 1d | 165 | 1.34mi |
| 10813 Middleglen Rd Haslet, TX | 4.0 | 2.5 | 2350 | $2,395 | $1.02 | 2d | 1 | 1.41mi |
Listing history 14 events
-
2026-06-18days on market $439,990 Active 79 DOM
-
2026-06-17days on market $439,990 Active 78 DOM
-
2026-06-16days on market $439,990 Active 77 DOM
-
2026-06-15days on market $439,990 Active 76 DOM
-
2026-06-13days on market $439,990 Active 74 DOM
-
2026-06-09days on market $439,990 Active 70 DOM
-
2026-06-08days on market $439,990 Active 69 DOM
-
2026-06-07days on market $439,990 Active 68 DOM
-
2026-06-04days on market $439,990 Active 65 DOM
-
2026-06-03days on market $439,990 Active 64 DOM
-
2026-06-02days on market $439,990 Active 63 DOM
-
2026-06-01days on market $439,990 Active 62 DOM
-
2026-05-31days on market $439,990 Active 61 DOM
-
2026-03-31$439,990 Active 364-char remark
Show marketing remark (364 chars)
Step into this brand new Addison floorplan. This layout delivers all of the must-haves you're looking for in a spacious 2 story home design such as tall ceilings, exceptional natural light, plenty of storage space, a large upstairs game room, and dozens of options to personalize your new home. Continue inside to explore everything this Addison plan has to offer.
ⓘ Source: listings_history table (triggers on properties + properties_extension) + one-shot
backfill from property_details.listing_events for pre-trigger history.
Climate risk First Street
- Flood 1/10 Low FEMA zone X (unshaded) · 0% chance over 30 yrs
- Wildfire 3/10 Moderate
- Heat 7/10 Severe 7 d/yr ≥109°F today · 22 d/yr by 30 yrs out
- Wind 6/10 Major 27% chance of damaging wind over 30 yrs
- Air quality 3/10 Moderate 3 unhealthy d/yr today · 4 by 30 yrs out
Nearby sold comps map
Loading sold comps map…
Walkable amenities ~0.75 mi
Loading nearby amenities…
Taxation est. · year 1
- Rental income
- $37,559
- − Mortgage interest
- −$35,141
- − Property taxes
- −$9,410
- − Insurance
- −$3,137
- − Repairs & maintenance
- −$3,005
- − Management
- −$3,005
- − Depreciation
- −$18,250
- Taxable loss
- −$34,389
- Est. tax savings @ 24.0%
- +$8,253
- After-tax cash flow
- $-14,101/yr
For passive investors: Depreciation is non-cash, so a rental often shows a tax loss while cash-flowing — sheltering income. Rental losses are passive: they offset passive income freely, and up to $25,000/yr can offset ordinary (W-2) income if you actively participate and your MAGI is under $100k (phasing out to $0 by $150k); unused losses carry forward. On sale, claimed depreciation is recaptured at up to 25%, and gains may owe capital-gains tax (a 1031 exchange can defer both). Figures are a year-1 estimate at your 24.0% rate — not tax advice; consult a CPA.
Schools (NCES district)
- District
- Northwest ISD
- NCES district ID
- 4833180
- Math proficiency
- 48% ▼ -15.00%
- Reading proficiency
- 52% ▼ -8.00%
- Median HH income
- $85,315
- Composite
- 46.15/100
- National rank
- #2504
- State rank
- #120 of 826 in TX
Livability — Fort Worth
- Score
- 80/100
- State rank
- #49
- US rank
- #1954
Category grades
Schools grade is shown separately in the Schools card above.
Census & demographics
- Census place
- Fort Worth, TX
- County
- Tarrant County · 2,033,669 people
- City population
- 911,619
- Metro
- Dallas-Fort Worth-Arlington, TX
- Population (ZIP)
- 34,249
- Household income
- $143,555
- Rent vs Own
- Severe rent burden
- 358.0
Population outlook (Tarrant County) Hauer SSP2
- Today (2025)
- 2,380,417 people
- By 2030
- 2,578,900 · +8.3%
- By 2040
- 2,974,995 · +25.0%
- By 2050
- 3,350,489 · +40.8%
- By 2075
- 4,216,909 · +77.2%
- By 2100
- 4,741,527 · +99.2%
Race, ethnicity, and origin ACS 2023
- Neighborhood character
- Predominantly White (66%)
- Race & ethnicity
- White 66% Hispanic / Latino 14% Two or more races 13% Black 11% Asian 4%
- Hispanic origin (detail)
- Mexican 7% Puerto Rican 2%
- Common ancestry
- Lithuanian 7% Slovak 4% Romanian 1%
- Foreign-born
- 7% · Canada, Vietnam
- Languages at home
- 88% English-only · Spanish 6% Vietnamese 2% Other Indo-European 1%
Political lean MEDSL · Tarrant
- 2024 margin
- Lean R (+5.1) · D 46.7% · R 51.9% · Other 1.4%
- 2008→2024 swing
- +6.6pp toward D · 2008: -11.7pp · 2024: -5.1pp
- All cycles
- 2024: R+5.1 2020: D+0.2 2016: R+8.7 2012: R+15.7 2008: R+11.7
Not yet ingested
- Civics
- —
Market trends
- HPI YoY
- ▼ -78.77%
- Current HPI
- 235.7417
- Rent YoY
- ▲ 1.08%
- Metro
- Dallas-Fort Worth-Arlington, TX
- State GDP YoY
- ▲ 3.95%
- F500 in state
- 110
Industry mix (Fortune 500 HQ in TX)
| Industry | F500 HQs | Revenue |
|---|---|---|
| Energy | 16 | $1,198B |
|
||
| Technology | 5 | $198B |
|
||
| Engineering / Construction | 4 | $72B |
|
||
| Energy Services | 3 | $60B |
|
||
| Utilities | 3 | $41B |
|
||
| Healthcare | 2 | $330B |
|
||
Price history
1 event — show timeline
- 2026-03-31 Listed $439,990 Zillow
Cash-flow waterfall
monthlySold comps — $/sqft
last 12 mo · ≤1 miLoading sold comps…