77 South St · Port Byron, NY
Flood risk 6/10 · Moderate
- FEMA flood zone
- X (unshaded)
- Chance of flooding over 30 yrs
- 0.74%
- Est. flood insurance / yr
- $473 – $860
Fire risk 3/10 · Minor
- Est. fire insurance / yr
- $691 – $1,283
Heat risk 2/10 · Minimal
- Hot days now (above 96°F)
- 7 days/yr
- Hot days in 30 yrs
- 15 days/yr
Wind risk 1/10 · Minimal
- Chance of severe wind over 30 yrs
- 1.0%
Air-quality risk 2/10 · Minimal
- Unhealthy air days now
- 1 days/yr
- Unhealthy air days in 30 yrs
- 1 days/yr
Risk factors via First Street. Map © Google.
Why this score? — see what drove the C+ grade
The composite is a weighted blend of 9 inputs, each scored 0–100. Each bar is that input's sub-score; the figure is the points it added to the 100-point composite (weight × sub-score).
- Cash flow +16.1/30.0
- ARV discount +15.0/15.0
- Appreciation +9.5/10.0
- DSCR +5.0/10.0
- 1% rule +4.4/10.0
- Schools +3.6/10.0
- Livability +3.2/5.0
- Rent growth +2.5/5.0
- Condition / age +2.2/5.0
$98,900
🖨 Deal sheet (PDF) 📄 Offer letter ✓ Due diligence
Listing remarks MLS
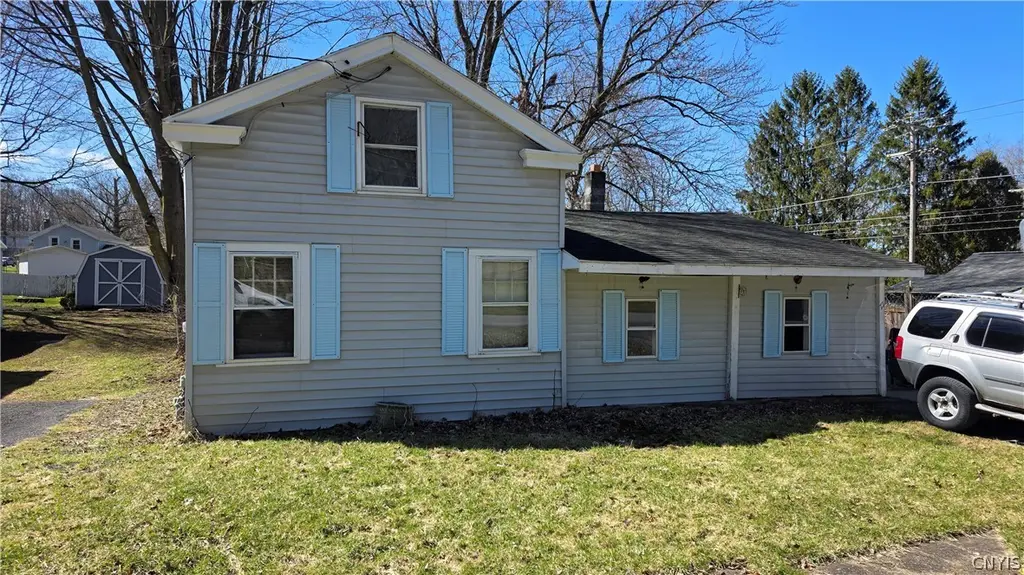
Charming village home with tons of potential! This 2-bedroom property offers the possibility of a 3rd bedroom, giving you flexibility to grow or create the perfect home office. Featuring a convenient first-floor laundry and a functional layout, this home is ready for your personal touch. With a little TLC, it can truly shine. This is a great opportunity to build equity and make it your own!
Key facts
- 6,447 sq ft lot
- Built 1920
- Listed 86 days
Neighborhood map
What this means for you Summary
Snapshot
- This is a 2-bed/1.0-bath single-family listed at $99k. Condition is rated fair.
Deal economics
- At list price, monthly cash flow is $50 ($602/yr) — positive.
- The deal already cash-flows at list — no discount required.
- To meet the 1% rule (rent ≥ 1% of price), the offer needs to be $93k (6.1% below list).
- Recommended offer: $93k (6.1% below list) — sets the bar for 1% rule.
Location & tenants
- Location reads 64/100 on livability (#778 in NY) — a middle-class / working-renter tenant base. Strengths: cost of living A+, housing A+, crime A-; Watch: employment D+, amenities F, commute F.
- Port Byron Central School District (rural): math 36% / reading 48% proficiency, ranked #490 of 590 in NY (top 83%) — families likely to look elsewhere, expect single-tenant / working-renter base with shorter leases.
- Zoned schools: A A Gates Elementary School (math 27% / reading 42%, grade F, #1,577 of 2,108 statewide, top 77%, 413 students, 0% FRL); Port Byron Senior High School (math 47% / reading 57%, grade D+, #946 of 1,100 statewide, top 88%, 355 students, 92% FRL) — zoned schools average 46% FRL vs 30% district-wide (16 pts higher); higher-poverty schools than district average — tighter screening recommended.
- Market conditions: 10 active listings in the ZIP; 161 units permitted in Cayuga County in 2024 (65 in 5+ unit buildings).
Forward outlook
- In year one you build about $10k of equity ($684 loan paydown + $9k appreciation (8.9% local appreciation)).
- Cayuga County population projected at -18% by 2050 — secular population decline; favor cash flow + early exit over multi-decade hold.
- At projected returns (8.9% appreciation + 3.0% rent growth), your $28k cash investment doubles in ~3 years — after that, you're playing with house money.
- By year 4, paydown + projected appreciation supports a ~$33k cash-out refi (75% LTV) — recoverable capital for the next deal without selling this one.
Negotiation context
- It's been on market 87 days — a 6% lower offer ($93k) is reasonable based on typical stale-listing flexibility.
Risks & watch-outs
- Watch-outs: built in 1920 — expect roof / HVAC / electrical / plumbing capex.
- Climate carrying-cost: major flood risk — expect insurance premiums to compound above CPI over the hold.
Questions for the listing agent
- It's been on market 87 days. Have you received any prior offers? Is the seller open to a 6% concession, seller financing, or rate buy-down credit?
- Have any recent inspections been done? Can we get a copy of the seller's disclosures and any deferred-maintenance estimates?
- Built in 1920 — when were the roof, HVAC, electrical panel, plumbing, and water heater last replaced?
- Why hasn't it sold? Are there any deal-killer items the seller is aware of (foundation, flood, title, zoning, code violations)?
- Is there a deadline driving the sale (1031 exchange, divorce, estate, relocation)? That informs how much negotiation room exists.
- Schools are D-rated, which usually means shorter tenancies and higher turnover. Who's the typical renter profile here, and what's been the actual vacancy rate?
- What's the average days-on-market for RENTAL listings here right now (not sales)? A rising rental-DOM trend means longer vacancies and softer asking-rent achievability than the comps imply.
- What's the recent tenant-quality profile in this submarket — average credit score on applications, eviction rate, late-payment / NSF rate, and stable-employment percentage? A property-management company in the area should have these aggregated.
- How much new for-sale + rental construction is in the pipeline within 1–3 miles? Heavy new supply typically softens prices + rents 12–24 months out; constrained supply supports both.
Investment metrics
- 1% rule
- 0.94% ✗
- Cap rate
- 6.90%
- Cash-on-cash
- 2.17%
- DSCR
- 1.10
- GRM
- 8.9
CMA / ARV
- ARV (median comp)
- $166,390
- List price
- $98,900
- Delta
- -40.56%
- Verdict
- UNDERPRICED
- Comps
- 4 within 1.0 mi
Show comp detail 1 sale within ~0.75 mi
| Address | Dist | Beds/Ba | Sqft | Sold | Price | $/sf | Match |
|---|---|---|---|---|---|---|---|
| 9-11 First Hill St | 0.70mi | 2/1.0 | 720 (-11%) | 10mo | $122,500 | $170 | 41 |
Match score weights: distance 35% · size 25% · config 20% · recency 20%. Top-matched comps best support the ARV.
Projected returns pro-forma
8.95% appreciation · 3.0% rent growth · sell at horizon
- IRR
- 23.7%
- Equity multiple
- 2.81×
- Total profit
- $50,062
- Equity at exit
- $81,642
- IRR
- 21.3%
- Equity multiple
- 6.18×
- Total profit
- $143,534
- Equity at exit
- $168,689
Cash invested: $27,692 (down + closing). Projections, not guarantees.
Landlord ↔ Tenant lean methodology
- Overall (STATE)
- 15 Strongly Tenant-Friendly
- State New York
- 15 Strongly Tenant-Friendly · D+10
- County
- — inherits STATE
- City
- — inherits STATE
ZIP-level market 13140
- Home prices YoY
- 2.7%
- Active inventory
- 10
- Price-to-rent
- 8.9×
Monthly cashflow live
- Estimated rent
- $929 medium interval (Pro) →
- Mortgage (P&I)
- −$519
- Tax est. 1.5%
- −$124 /mo · $1,484/yr
- Insurance
- −$41
- HOA
- −$0
- Vacancy / Maint / Mgmt
- −$195
- Net cashflow
- $50
Break-even live
Sensitivity live
| Price | -10% $118 | -5% $84 | +0% $50 | +5% $16 | +10% $-18 |
|---|---|---|---|---|---|
| Rent | -10% $-23 | -5% $13 | +0% $50 | +5% $87 | +10% $123 |
| Rate | -1.0pp $100 | -0.5pp $75 | base $50 | +0.5pp $24 | +1.0pp $-2 |
UW: 25.0% down · 7.5% · 30yr · 1.5% tax · 5.0% vac · 8.0% maint · 8.0% mgmt
Financing live
Cash to close
- Down payment
- $24,725
- Closing costs
- $2,967
- Reserves months
- —
- Total cash needed
- —
Loan-product check · same deal, 3 products live
Conventional
25% down · 7.5% · 30yr
- Down + closing
- —
- Monthly P&I
- —
- Monthly cashflow
- —
- DSCR
- —
- Eligible?
- —
Personal DTI + credit; lowest rate.
DSCR
20% down · 8.5% · 30yr
- Down + closing
- —
- Monthly P&I
- —
- Monthly cashflow
- —
- DSCR
- —
- Eligible?
- —
No personal income docs; deal must DSCR.
Hard money
10% down · 12.0% · 12mo
- Down + closing
- —
- Monthly P&I
- —
- Monthly cashflow
- —
- DSCR
- —
- Eligible?
- —
Short-term bridge; refi at stabilization.
Listing history 21 events
-
2026-06-22days on market $98,900 Active 87 DOM
-
2026-06-21days on market $98,900 Active 86 DOM
-
2026-06-19days on market $98,900 Active 84 DOM
-
2026-06-18days on market $98,900 Active 83 DOM
-
2026-06-17days on market $98,900 Active 82 DOM
-
2026-06-16days on market $98,900 Active 81 DOM
-
2026-06-15days on market $98,900 Active 80 DOM
-
2026-06-14days on market $98,900 Active 78 DOM
-
2026-06-12days on market $98,900 Active 77 DOM
-
2026-06-09days on market $98,900 Active 74 DOM
-
2026-06-08days on market $98,900 Active 73 DOM
-
2026-06-07days on market $98,900 Active 72 DOM
-
2026-06-05days on market $98,900 Active 69 DOM
-
2026-06-03days on market $98,900 Active 68 DOM
-
2026-06-02days on market $98,900 Active 67 DOM
-
2026-06-01days on market $98,900 Active 66 DOM
-
2026-05-31days on market $98,900 Active 65 DOM
-
2026-05-30days on market $98,900 Active 64 DOM
-
2026-05-14price $98,900 393-char remark
Show marketing remark (393 chars)
Charming village home with tons of potential! This 2-bedroom property offers the possibility of a 3rd bedroom, giving you flexibility to grow or create the perfect home office. Featuring a convenient first-floor laundry and a functional layout, this home is ready for your personal touch. With a little TLC, it can truly shine. This is a great opportunity to build equity and make it your own!
-
2026-04-13price $99,900 393-char remark
Show marketing remark (393 chars)
Charming village home with tons of potential! This 2-bedroom property offers the possibility of a 3rd bedroom, giving you flexibility to grow or create the perfect home office. Featuring a convenient first-floor laundry and a functional layout, this home is ready for your personal touch. With a little TLC, it can truly shine. This is a great opportunity to build equity and make it your own!
-
2026-03-27$109,900 Active 393-char remark
Show marketing remark (393 chars)
Charming village home with tons of potential! This 2-bedroom property offers the possibility of a 3rd bedroom, giving you flexibility to grow or create the perfect home office. Featuring a convenient first-floor laundry and a functional layout, this home is ready for your personal touch. With a little TLC, it can truly shine. This is a great opportunity to build equity and make it your own!
ⓘ Source: listings_history table (triggers on properties + properties_extension) + one-shot
backfill from property_details.listing_events for pre-trigger history.
Climate risk First Street
- Flood 6/10 Major FEMA zone X (unshaded) · 74% chance over 30 yrs
- Wildfire 3/10 Moderate
- Heat 2/10 Low 7 d/yr ≥96°F today · 15 d/yr by 30 yrs out
- Wind 1/10 Low 100% chance of damaging wind over 30 yrs
- Air quality 2/10 Low 1 unhealthy d/yr today · 1 by 30 yrs out
Nearby sold comps map
Loading sold comps map…
Walkable amenities ~0.75 mi
Loading nearby amenities…
Taxation est. · year 1
- Rental income
- $11,143
- − Mortgage interest
- −$5,540
- − Property taxes
- −$1,484
- − Insurance
- −$494
- − Repairs & maintenance
- −$891
- − Management
- −$891
- − Depreciation
- −$2,877
- Taxable loss
- −$1,035
- Est. tax savings @ 24.0%
- +$248
- After-tax cash flow
- $850/yr
For passive investors: Depreciation is non-cash, so a rental often shows a tax loss while cash-flowing — sheltering income. Rental losses are passive: they offset passive income freely, and up to $25,000/yr can offset ordinary (W-2) income if you actively participate and your MAGI is under $100k (phasing out to $0 by $150k); unused losses carry forward. On sale, claimed depreciation is recaptured at up to 25%, and gains may owe capital-gains tax (a 1031 exchange can defer both). Figures are a year-1 estimate at your 24.0% rate — not tax advice; consult a CPA.
Condition & rehab AI · 2 photos
This single-family home requires moderate repairs and maintenance, including painting and landscaping, to improve its curb appeal and resale/rental value.
Repairs flagged
- Minor Paint — Light blue siding with some discoloration
- Minor Landscaping — Appears maintained but not recently landscaped
Value-add opportunities
- Both Paint the exterior — Improves curb appeal and resale value
- Both Landscaping — Enhances curb appeal and rental value
Renovation cost estimate screening
| Repair item | Severity | Est. cost |
|---|---|---|
| Paint · Light blue siding with some discoloration | Minor | $500–3,000 |
| Landscaping · Appears maintained but not recently landscaped | Minor | $500–3,000 |
| Total estimated repair cost · 2 items | $1,000–6,000 |
Value-add ROI direction
- Both Paint the exterior — Improves curb appeal and resale value ↑
- Both Landscaping — Enhances curb appeal and rental value ↑
ⓘ Cost ranges are severity-bucket heuristics (US national rule-of-thumb). Get contractor quotes + a written scope before underwriting a rehab budget.
Schools (NCES district)
- District
- Port Byron Central School District
- NCES district ID
- 3623430
- Math proficiency
- 36% ▼ -7.00%
- Reading proficiency
- 48% ▲ 10.00%
- Median HH income
- $52,293
- Composite
- 36.33/100
- National rank
- #4690
- State rank
- #490 of 590 in NY
Livability — Port Byron
- Score
- 64/100
- State rank
- #778
- US rank
- #14820
Category grades
Schools grade is shown separately in the Schools card above.
Census & demographics
- Census place
- Port Byron, NY
- Population (ZIP)
- 4,192
Population outlook (Cayuga County) Hauer SSP2
- Today (2025)
- 74,820 people
- By 2030
- 72,402 · -3.2%
- By 2040
- 66,917 · -10.6%
- By 2050
- 61,007 · -18.5%
- By 2075
- 48,047 · -35.8%
- By 2100
- 34,512 · -53.9%
Race, ethnicity, and origin ACS 2023
- Neighborhood character
- Predominantly White (93%)
- Race & ethnicity
- White 93% Two or more races 4% Hispanic / Latino 3%
- Common ancestry
- Romanian 6% Iranian 3% Lithuanian 2%
- Foreign-born
- 1% · Canada
- Languages at home
- 98% English-only · German/W. Germanic 1% Spanish 1%
Political lean MEDSL · Cayuga
- 2024 margin
- R (+13.0) · D 43.5% · R 56.5%
- 2008→2024 swing
- -21.5pp toward R · 2008: 8.5pp · 2024: -13.0pp
- All cycles
- 2024: R+13.0 2020: R+9.2 2016: R+13.2 2012: D+10.8 2008: D+8.5
Not yet ingested
- Civics
- —
Market trends
- HPI YoY
- ▲ 8.95%
- Current HPI
- 340.1023
- Rent YoY
- —
- Metro
- —
- State GDP YoY
- ▲ 2.60%
- F500 in state
- 92
Industry mix (Fortune 500 HQ in NY)
| Industry | F500 HQs | Revenue |
|---|---|---|
| Financial Services | 10 | $950B |
|
||
| Consumer Goods | 9 | $162B |
|
||
| Insurance | 4 | $225B |
|
||
| Telecommunications | 2 | $144B |
|
||
| Pharmaceuticals | 2 | $112B |
|
||
| Media / Entertainment | 2 | $69B |
|
||
Price history
-10.0% since first listed3 events — show timeline
- 2026-05-14 Price Changed $98,900 CNYIS
- 2026-04-13 Price Changed $99,900 CNYIS
- 2026-03-27 Listed $109,900 CNYIS
Cash-flow waterfall
monthlySold comps — $/sqft
last 12 mo · ≤1 miLoading sold comps…