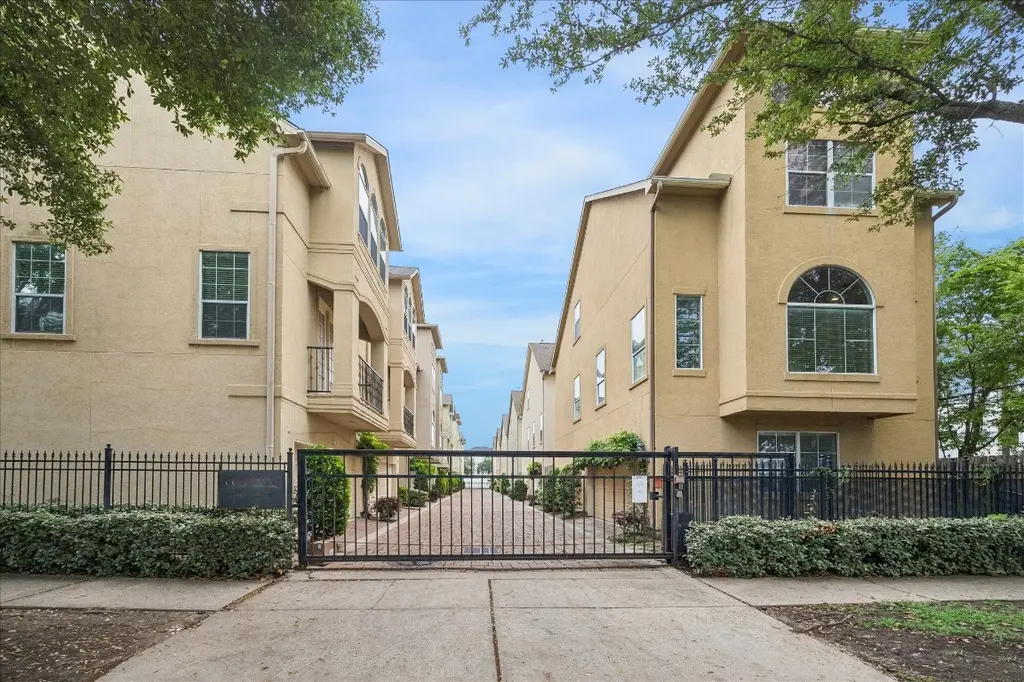
1602 Colorado St · Houston, TX
Flood risk 1/10 · Minimal
- FEMA flood zone
- X (unshaded)
- Chance of flooding over 30 yrs
- 0.0%
- Est. flood insurance / yr
- $507 – $1,088
Fire risk 1/10 · Minimal
- Est. fire insurance / yr
- $1,222 – $2,270
Heat risk 9/10 · Severe
- Hot days now (above 109°F)
- 7 days/yr
- Hot days in 30 yrs
- 24 days/yr
Wind risk 9/10 · Severe
- Chance of severe wind over 30 yrs
- 99.0%
Air-quality risk 3/10 · Minor
- Unhealthy air days now
- 2 days/yr
- Unhealthy air days in 30 yrs
- 3 days/yr
Risk factors via First Street. Map © Google.
Why this score? — see what drove the C grade
The composite is a weighted blend of 9 inputs, each scored 0–100. Each bar is that input's sub-score; the figure is the points it added to the 100-point composite (weight × sub-score).
- Cash flow +19.3/30.0
- ARV discount +15.0/15.0
- 1% rule +6.6/10.0
- DSCR +6.1/10.0
- Livability +3.7/5.0
- Schools +2.7/10.0
- Condition / age +2.5/5.0
- Rent growth +2.3/5.0
- Appreciation +0.0/10.0
$329,000
🖨 Deal sheet 📄 Offer letter ✓ Due diligence
Listing remarks
Enjoy Exceptional Value and Urban Living with Private Backyard In An Exclusive Inner-Loop Gated Community! Stunning 3-story home w/ stylish interiors has ample space for comfortable daily living & easy entertaining. Floor plan offers 1st-floor guest suite w/ walk-in closet & ensuite bathroom. Primary suite on the 3rd floor features a soaring vaulted ceiling, space for study/sitting area, 2 walk-in closets & a spa-like ensuite. Light-filled living & dining areas w/ rich hardwood flooring & neutral paint open to the kitchen w/ convenient bar seating, granite countertops, SS appliances & a large pantry. Location is perfect! Stroll to Café Brussels for
Key facts
- Private backyard
- Primary suite
- Spa-like ensuite
Tags
Neighborhood map
What this means for you Summary
Snapshot
- This is a 2-bed/2.0-bath townhouse listed at $329k.
Deal economics
- At list price, monthly cash flow is $364 ($4k/yr) — positive.
- The deal already cash-flows at list — no discount required.
- Meets the 1% rule at list price ($4k rent vs $329k).
- Recommended offer: $324k (1.5% below list) — sets the bar for market timing.
- Cap rate 7.6% vs local median 3.2% in Houston — top-decile yield for the area; either an underpriced asset or a hidden risk that comps aren't pricing in. Stress-test before assuming the spread holds.
Location & tenants
- Location reads 74/100 on livability (#184 in TX, #4,771 nationally) — a middle-class / working-renter tenant base. Strengths: amenities A+, cost of living A+, housing A+; Watch: crime F.
- Houston ISD (urban): math 27% / reading 35% proficiency, ranked #593 of 826 in TX (top 72%) — families likely to look elsewhere, expect single-tenant / working-renter base with shorter leases; 71% free/reduced lunch — lower-income household profile, screen leases tightly.
- Zoned schools: Hogg Middle (math 44% / reading 48%, grade D+, #462 of 1,662 statewide, top 28%, 1,120 students, 52% FRL); Heights H S (math 27% / reading 57%, grade F, #730 of 1,632 statewide, top 47%, 2,476 students, 65% FRL).
- Zoned-school proficiency averages 44% at this address vs 31% district-wide (+13 pts) — the actual schools serving this property are materially stronger than the Houston ISD average implies; a family-tenant draw the district grade alone would hide.
- Market conditions: Rents soft (-0.8%/yr); 646 active listings in the ZIP; 40 comparable units currently listed for rent nearby; rentals leasing fast (median 11d on market — plan ~1-2 weeks tenant-placement turnaround); high-income renter base; 29,883 units permitted in Harris County in 2024 (8,621 in 5+ unit buildings).
- This rent runs 31% of the median local income ($145k/yr) — at the standard rent-burdened threshold; future hikes will face affordability resistance.
Forward outlook
- Local home prices are declining (-3.0%/yr); year-one equity from $2k of loan paydown is wiped out by about $10k of value loss. Plan a longer hold.
- Harris County population projected at +47% by 2050 — long-run rental-demand tailwind backs the buy-and-hold thesis.
Negotiation context
- It's been on market 18 days — a 2% lower offer ($324k) is reasonable based on typical stale-listing flexibility.
- 20 sale attempts since 18y ago with the ask held roughly flat each time — persistent listings suggest the price (not the market) is what's stuck; bring a comps-based counter.
Risks & watch-outs
- Climate carrying-cost: severe wind risk, 99% chance of damaging wind over 30y; extreme-heat days projected 7→24/yr by 2055 (HVAC capex compounding) — expect insurance premiums to compound above CPI over the hold.
Questions for the listing agent
- What does the HOA fee cover, when was the last increase, and are there any pending special assessments or reserve-fund shortfalls?
- Is there a deadline driving the sale (1031 exchange, divorce, estate, relocation)? That informs how much negotiation room exists.
- Schools are D-rated, which usually means shorter tenancies and higher turnover. Who's the typical renter profile here, and what's been the actual vacancy rate?
- Crime grade is F in this area — have there been break-ins, vandalism, or insurance claims at this property in the last 3 years? What carrier currently insures it and at what premium?
- What's the average days-on-market for RENTAL listings here right now (not sales)? A rising rental-DOM trend means longer vacancies and softer asking-rent achievability than the comps imply.
- What's the recent tenant-quality profile in this submarket — average credit score on applications, eviction rate, late-payment / NSF rate, and stable-employment percentage? A property-management company in the area should have these aggregated.
- How much new for-sale + rental construction is in the pipeline within 1–3 miles? Heavy new supply typically softens prices + rents 12–24 months out; constrained supply supports both.
Investment metrics
- 1% rule
- 1.16% ✓
- Cap rate
- 7.62%
- Cash-on-cash
- 4.74%
- DSCR
- 1.21
- GRM
- 7.2
CMA / ARV
- ARV (on-the-fly)
- $396,030
- Comps found
- 12
Show comp detail 12 sales within ~0.75 mi
| Address | Dist | Beds/Ba | Sqft | Sold | Price | $/sf | Match |
|---|---|---|---|---|---|---|---|
| 1917 Summer St | 0.19mi | 3/3.0 (+1) | 1,768 (-4%) | 5mo | $465,000 | $263 | 71 |
| 1901 Summer St | 0.16mi | 3/3.5 (+1) | 1,874 (+2%) | 12mo | $455,000 | $243 | 69 |
| 1823 Dart St | 0.23mi | 3/3.5 (+1) | 1,888 (+2%) | 11mo | $379,900 | $201 | 65 |
| 1923 Shearn St | 0.23mi | 3/3.5 (+1) | 1,964 (+7%) | 8mo | $425,000 | $216 | 60 |
| 939 Colorado St #20 | 0.35mi | 3/3.0 (+1) | 2,000 (+9%) | 1mo | $365,000 | $183 | 60 |
| 102 Quitman St #201 | 0.60mi | 2/2.0 | 1,696 (-8%) | 2mo | $364,900 | $215 | 57 |
| 1304 Dart St Unit E | 0.29mi | 3/3.0 (+1) | 2,088 (+13%) | 3mo | $400,000 | $192 | 53 |
| 939 Colorado St #13 | 0.36mi | 3/3.0 (+1) | 2,088 (+13%) | 3mo | $424,900 | $203 | 50 |
| 1404 Spring St | 0.27mi | 3/3.5 (+1) | 2,024 (+10%) | 13mo | $450,000 | $222 | 49 |
| 1704 Alamo St Unit A | 0.30mi | 3/3.5 (+1) | 2,084 (+13%) | 8mo | $464,000 | $223 | 47 |
| 1205 Summer St Unit C | 0.31mi | 3/3.5 (+1) | 2,088 (+13%) | 7mo | $420,000 | $201 | 46 |
| 1205 Summer St Unit A | 0.31mi | 3/3.5 (+1) | 2,088 (+13%) | 8mo | $399,990 | $192 | 45 |
Match score weights: distance 35% · size 25% · config 20% · recency 20%. Top-matched comps best support the ARV.
Projected returns pro-forma
-3.0% appreciation · 0.0% rent growth · sell at horizon
- IRR
- -12.8%
- Equity multiple
- 0.56×
- Total profit
- $-40,990
- Equity at exit
- $49,055
- IRR
- -10.0%
- Equity multiple
- 0.48×
- Total profit
- $-47,755
- Equity at exit
- $28,446
Cash invested: $92,120 (down + closing). Projections, not guarantees.
Landlord ↔ Tenant lean methodology
- Overall (STATE)
- 87 Strongly Landlord-Friendly
- State Texas
- 87 Strongly Landlord-Friendly · R+5
- County
- — inherits STATE
- City
- — inherits STATE
ZIP-level market 77007
- Rents YoY
- -0.8%
- Active inventory
- 646
- Price-to-rent
- 7.2×
Monthly cashflow live
- Estimated rent
- $3,802 high interval (Pro) →
- Mortgage (P&I)
- −$1,725
- Tax from tax record
- −$558 /mo · $6,696/yr
- Insurance
- −$137
- HOA
- −$219
- Vacancy / Maint / Mgmt
- −$798
- Net cashflow
- $364
Break-even live
UW: 25.0% down · 7.5% · 30yr · 1.5% tax · 5.0% vac · 8.0% maint · 8.0% mgmt
Financing live
Cash to close
- Down payment
- $82,250
- Closing costs
- $9,870
- Reserves months
- —
- Total cash needed
- —
Loan-product check · same deal, 3 products live
Conventional
25% down · 7.5% · 30yr
- Down + closing
- —
- Monthly P&I
- —
- Monthly cashflow
- —
- DSCR
- —
- Eligible?
- —
Personal DTI + credit; lowest rate.
DSCR
20% down · 8.5% · 30yr
- Down + closing
- —
- Monthly P&I
- —
- Monthly cashflow
- —
- DSCR
- —
- Eligible?
- —
No personal income docs; deal must DSCR.
Hard money
10% down · 12.0% · 12mo
- Down + closing
- —
- Monthly P&I
- —
- Monthly cashflow
- —
- DSCR
- —
- Eligible?
- —
Short-term bridge; refi at stabilization.
Rent comps 40 comps
| Address | Beds | Baths | Sqft | Rent | $/sqft | DOM | Units | Dist |
|---|---|---|---|---|---|---|---|---|
| 1512 Crockett St Unit A Houston, TX | 2.0 | 2.5 | 1808 | $2,800 | $1.55 | 43d | 1 | 0.19mi |
| 1510 Crockett St Houston, TX | 2.0 | 3.0 | 1912 | $2,800 | $1.46 | 43d | 1 | 0.19mi |
| 2018 Crockett St Unit 1029793P Houston, TX | 3.0 | 3.5 | 2507 | $6,482 | $2.59 | 5d | 1 | 0.27mi |
| 2018 Crockett St Unit 2018 Houston, TX | 3.0 | 3.5 | 2514 | $8,000 | $3.18 | 43d | 1 | 0.27mi |
| 2114 Sabine St Houston, TX | 3.0 | 4.0 | 2020 | $3,200 | $1.58 | 43d | 1 | 0.30mi |
| 2114 Sabine St Unit 1257735P Houston, TX | 3.0 | 3.5 | 2594 | $6,588 | $2.54 | 43d | 1 | 0.30mi |
| 2121 Edwards St Houston, TX | 2.0 | 1.0–2.0 | 879 | $2,880 | $3.27 | 3d | 25 | 0.31mi |
| 2305 Summer St Houston, TX | 2.0 | 1.0–2.0 | 842 | $3,046 | $3.62 | 1d | 11 | 0.36mi |
| 2000 Taylor St Houston, TX | 2.0 | 1.0–2.0 | 916 | $3,082 | $3.36 | 2d | 33 | 0.40mi |
| 1520 Oliver St Houston, TX | 2.0 | 1.0–2.0 | 926 | $2,865 | $3.09 | 2d | 45 | 0.64mi |
| 825 Usener St Houston, TX | 2.0 | 1.0–2.0 | 1050 | $2,925 | $2.79 | 2d | 27 | 0.68mi |
| 150 Sabine St Houston, TX | 1.0–2.0 | 1.0–2.0 | 1187 | $2,882 | $2.43 | 3d | 15 | 0.68mi |
| 410 James St Houston, TX | 3.0 | 2.0 | 1602 | $6,750 | $4.21 | 43d | 1 | 0.78mi |
| 410 James St Unit 1031793P Houston, TX | 3.0 | 2.0 | 1593 | $7,554 | $4.74 | 16d | 1 | 0.78mi |
| 207 Carl St Houston, TX | 2.0 | 2.0 | 1230 | $2,250 | $1.83 | 43d | 1 | 0.81mi |
| 1625 N Main St Houston, TX | 3.0 | 1.0–3.0 | 994 | $2,007 | $2.02 | 3d | 42 | 0.86mi |
| 3010 S Heights Hollow Ln Houston, TX | 2.0 | 2.0 | 1442 | $2,400 | $1.66 | 43d | 1 | 0.94mi |
| 414 Milam St Unit 422 Houston, TX | 2.0 | 2.0 | 1585 | $3,833 | $2.42 | 7d | 1 | 0.95mi |
| 414 Milam St Unit 2187 Houston, TX | 2.0 | 2.0 | 1585 | $3,857 | $2.43 | 3d | 1 | 0.95mi |
| 414 Milam St Unit 3165 Houston, TX | 3.0 | 2.0 | 2421 | $8,959 | $3.70 | 3d | 1 | 0.95mi |
| 414 Milam St Unit 2162 Houston, TX | 2.0 | 2.0 | 1585 | $3,833 | $2.42 | 5d | 1 | 0.95mi |
| 414 Milam St Unit 447 Houston, TX | 3.0 | 2.0 | 2421 | $8,973 | $3.71 | 43d | 1 | 0.95mi |
| 414 Milam St Unit 447 Houston, TX | 3.0 | 2.0 | 2421 | $8,991 | $3.71 | 11d | 1 | 0.95mi |
| 414 Milam St Unit 2148 Houston, TX | 2.0 | 2.0 | 1585 | $3,825 | $2.41 | 3d | 1 | 0.95mi |
| 414 Milam St Unit 2165 Houston, TX | 2.0 | 2.0 | 1585 | $3,868 | $2.44 | 5d | 1 | 0.95mi |
| 414 Milam St Unit 510 Houston, TX | 3.0 | 2.0 | 2421 | $9,230 | $3.81 | 14d | 1 | 0.95mi |
| 414 Milam St Unit 437 Houston, TX | 2.0 | 2.0 | 1585 | $3,857 | $2.43 | 11d | 1 | 0.95mi |
| 414 Milam St Houston, TX | 2.0 | 2.5 | 1585 | $3,845 | $2.43 | 22d | 1 | 0.96mi |
| 414 Milam St Ph 2-4602 Houston, TX | 2.0 | 2.0 | 2158 | $8,990 | $4.17 | 43d | 1 | 0.96mi |
| 414 Milam St Unit B1-2003 Houston, TX | 2.0 | 2.0 | 1585 | $4,513 | $2.85 | 43d | 1 | 0.96mi |
| 3003 Summer St Houston, TX | 1.0–2.0 | 1.0–2.0 | 1008 | $3,216 | $3.19 | 3d | 36 | 0.98mi |
| 616 Memorial Heights Dr Houston, TX | 1.0–2.0 | 1.0–2.0 | 1070 | $2,249 | $2.10 | 1d | 46 | 0.99mi |
| 2403 Everett St Unit A Houston, TX | 3.0 | 3.5 | 2093 | $2,800 | $1.34 | 43d | 1 | 1.03mi |
| 1011 Studemont St Unit 2534 Houston, TX | 2.0 | 2.0 | 1324 | $1,998 | $1.51 | 43d | 1 | 1.03mi |
| 1011 Studemont St Unit 358 Houston, TX | 2.0 | 2.0 | 1364 | $2,102 | $1.54 | 43d | 1 | 1.03mi |
| 3030 Summer St Houston, TX | 1.0–2.0 | 1.0–2.0 | 911 | $2,394 | $2.63 | 2d | 35 | 1.04mi |
| 707 Saulnier St Unit 2174 Houston, TX | 2.0 | 2.0 | 1243 | $2,392 | $1.92 | 11d | 1 | 1.04mi |
| 707 Saulnier St Unit 422 Houston, TX | 2.0 | 2.0 | 1243 | $2,368 | $1.91 | 7d | 1 | 1.04mi |
| 707 Saulnier St Unit 2162 Houston, TX | 2.0 | 2.0 | 1243 | $2,368 | $1.91 | 5d | 1 | 1.04mi |
| 707 Saulnier St Unit 2187 Houston, TX | 2.0 | 2.0 | 1243 | $2,360 | $1.90 | 3d | 1 | 1.04mi |
HOA detail
- Monthly dues
- $219 · $2,628/yr
- Likely covers
- security
Listing history 50 events
-
2026-05-04status Pending
-
2026-04-24status Pending
-
2026-04-15$329,000 Active
-
2026-04-06historical
-
2026-02-25price $319,995
-
2026-01-28$339,995 Active
-
2026-01-26historical $2,450
-
2026-01-26historical
-
2026-01-01$2,450
-
2025-12-25historical $2,450
-
2025-12-10$2,450
-
2025-12-09$344,995 Active
-
2025-11-17historical $2,450
-
2025-10-23$2,450
-
2025-10-22historical $2,450
-
2025-09-26$2,450
-
2025-09-25historical $2,500
-
2025-09-09$2,500
-
2025-09-08historical $2,545
-
2025-09-04$2,545
-
2025-09-04historical $2,545
-
2025-08-20$2,545
-
2025-08-20historical $2,600
-
2025-07-26$2,600
-
2025-07-26historical $2,600
-
2025-07-08$2,600
-
2025-07-08historical $2,600
-
2025-07-05$2,600
-
2019-01-22soldstatus
-
2019-01-18soldstatus Sold
-
2018-12-23status Pending
-
2018-12-12status Option Pending
-
2018-10-31price $299,900
-
2018-10-18price $309,900
-
2018-09-27$319,900 Active
-
2014-06-02soldstatus
-
2014-05-30soldstatus Sold
-
2014-05-12status Pending
-
2014-05-01status Option Pending
-
2014-04-16$289,000 Active
-
2014-04-16historical
-
2014-03-18status Active
-
2014-03-10status Option Pending
-
2014-03-05$290,000 Active
-
2010-06-01historical
-
2009-04-16$229,900
-
2009-04-15historical
-
2009-02-10$180,000
-
2008-10-11historical
-
2008-09-08$249,900
ⓘ Source: listings_history table (triggers on properties + properties_extension) + one-shot
backfill from property_details.listing_events for pre-trigger history.
Tax reassessment forecast TX · Resets to sale price
- Current annual tax
- $6,696 · $558/mo
- Projected year-2 tax
- $6,696 · $558/mo
- Expected delta
- $0/yr ($0/mo · 0.0%)
ⓘ Screening estimate from a state-policy table — verify with the county assessor before closing.
Climate risk First Street
- Flood 1/10 Low FEMA zone X (unshaded) · 0% chance over 30 yrs
- Wildfire 1/10 Low
- Heat 9/10 Extreme 7 d/yr ≥109°F today · 24 d/yr by 30 yrs out
- Wind 9/10 Extreme 99% chance of damaging wind over 30 yrs
- Air quality 3/10 Moderate 2 unhealthy d/yr today · 3 by 30 yrs out
Nearby sold comps map
Loading sold comps map…
Walkable amenities ~0.75 mi
Loading nearby amenities…
Taxation est. · year 1
- Rental income
- $45,620
- − Mortgage interest
- −$18,429
- − Property taxes
- −$6,696
- − Insurance
- −$1,645
- − Repairs & maintenance
- −$3,650
- − Management
- −$3,650
- − HOA
- −$2,628
- − Depreciation
- −$9,571
- Taxable loss
- −$648
- Est. tax savings @ 24.0%
- +$155
- After-tax cash flow
- $4,523/yr
For passive investors: Depreciation is non-cash, so a rental often shows a tax loss while cash-flowing — sheltering income. Rental losses are passive: they offset passive income freely, and up to $25,000/yr can offset ordinary (W-2) income if you actively participate and your MAGI is under $100k (phasing out to $0 by $150k); unused losses carry forward. On sale, claimed depreciation is recaptured at up to 25%, and gains may owe capital-gains tax (a 1031 exchange can defer both). Figures are a year-1 estimate at your 24.0% rate — not tax advice; consult a CPA.
Schools (NCES district)
- District
- Houston ISD
- NCES district ID
- 4823640
- Math proficiency
- 27% ▼ -18.00%
- Reading proficiency
- 35% ▼ -6.00%
- Median HH income
- $46,054
- Composite
- 26.63/100
- National rank
- #7173
- State rank
- #593 of 826 in TX
Livability — Houston
- Score
- 74/100
- State rank
- #184
- US rank
- #4771
Category grades
Schools grade is shown separately in the Schools card above.
Census & demographics
- Census place
- Houston, TX
- County
- Harris County · 4,702,590 people
- City population
- 3,226,434
- Metro
- Houston-The Woodlands-Sugar Land, TX
- Population (ZIP)
- 47,808
- Household income
- $144,911
- Rent vs Own
- Severe rent burden
- 1812.0
Population outlook (Harris County) Hauer SSP2
- Today (2025)
- 5,571,493 people
- By 2030
- 6,089,821 · +9.3%
- By 2040
- 7,142,806 · +28.2%
- By 2050
- 8,185,864 · +46.9%
- By 2075
- 10,574,329 · +89.8%
- By 2100
- 12,109,958 · +117.4%
Race, ethnicity, and origin ACS 2023
- Neighborhood character
- Diverse neighborhood (Simpson 0.63)
- Race & ethnicity
- White 57% Hispanic / Latino 17% Two or more races 13% Asian 11% Black 9%
- Hispanic origin (detail)
- Mexican 12%
- Common ancestry
- Slovak 3% Romanian 3% Italian 3%
- Foreign-born
- 19% · Canada, China, South Korea
- Languages at home
- 75% English-only · Spanish 12% Other Indo-European 4% Chinese 2%
Political lean MEDSL · Harris
- 2024 margin
- Lean D (+5.5) · D 52.0% · R 46.4% · Other 1.6%
- 2008→2024 swing
- +3.9pp toward D · 2008: 1.6pp · 2024: 5.5pp
- All cycles
- 2024: D+5.5 2020: D+13.3 2016: D+12.4 2012: D+0.1 2008: D+1.6
Not yet ingested
- Civics
- —
Market trends
- HPI YoY
- ▼ -219.42%
- Current HPI
- 159.8157
- Rent YoY
- ▼ -0.83%
- Metro
- Houston-The Woodlands-Sugar Land, TX
- State GDP YoY
- ▲ 3.95%
- F500 in state
- 110
Industry mix (Fortune 500 HQ in TX)
| Industry | F500 HQs | Revenue |
|---|---|---|
| Energy | 16 | $1,198B |
|
||
| Technology | 5 | $198B |
|
||
| Engineering / Construction | 4 | $72B |
|
||
| Energy Services | 3 | $60B |
|
||
| Utilities | 3 | $41B |
|
||
| Healthcare | 2 | $330B |
|
||
Price history
+31.7% since first listed50 events — show timeline
- 2026-05-04 Pending — HARMLS
- 2026-04-24 Pending — HARMLS
- 2026-04-15 Listed $329,000 HARMLS
- 2026-04-06 Listing Removed — HARMLS
- 2026-02-25 Price Changed $319,995 HARMLS
- 2026-01-28 Listed $339,995 HARMLS
- 2026-01-26 Rental Removed $2,450 HARMLS
- 2026-01-26 Listing Removed — HARMLS
- 2026-01-01 Listed for Rent $2,450 HARMLS
- 2025-12-25 Rental Removed $2,450 HARMLS
- 2025-12-10 Listed for Rent $2,450 HARMLS
- 2025-12-09 Listed $344,995 HARMLS
- 2025-11-17 Rental Removed $2,450 HARMLS
- 2025-10-23 Listed for Rent $2,450 HARMLS
- 2025-10-22 Rental Removed $2,450 HARMLS
- 2025-09-26 Listed for Rent $2,450 HARMLS
- 2025-09-25 Rental Removed $2,500 HARMLS
- 2025-09-09 Listed for Rent $2,500 HARMLS
- 2025-09-08 Rental Removed $2,545 HARMLS
- 2025-09-04 Listed for Rent $2,545 HARMLS
- 2025-09-04 Rental Removed $2,545 HARMLS
- 2025-08-20 Listed for Rent $2,545 HARMLS
- 2025-08-20 Rental Removed $2,600 HARMLS
- 2025-07-26 Listed for Rent $2,600 HARMLS
- 2025-07-26 Rental Removed $2,600 HARMLS
- 2025-07-08 Listed for Rent $2,600 HARMLS
- 2025-07-08 Rental Removed $2,600 APPFOLIO
- 2025-07-05 Listed for Rent $2,600 APPFOLIO
- 2019-01-22 Sold (Public Records) — Public Records
- 2019-01-18 Sold (MLS) — HARMLS
- 2018-12-23 Pending — HARMLS
- 2018-12-12 Pending — HARMLS
- 2018-10-31 Price Changed $299,900 HARMLS
- 2018-10-18 Price Changed $309,900 HARMLS
- 2018-09-27 Listed $319,900 HARMLS
- 2014-06-02 Sold (Public Records) — Public Records
- 2014-05-30 Sold (MLS) — HARMLS
- 2014-05-12 Pending — HARMLS
- 2014-05-01 Pending — HARMLS
- 2014-04-16 Listed $289,000 HARMLS
- 2014-04-16 Listing Removed — HARMLS
- 2014-03-18 Relisted — HARMLS
- 2014-03-10 Pending — HARMLS
- 2014-03-05 Listed $290,000 HARMLS
- 2010-06-01 Listing Removed — HARMLS
- 2009-04-16 Listed $229,900 HARMLS
- 2009-04-15 Listing Removed — HARMLS
- 2009-02-10 Listed $180,000 HARMLS
- 2008-10-11 Listing Removed — HARMLS
- 2008-09-08 Listed $249,900 HARMLS
Property tax history
+1.1%/yrLatest (2025): $6,696 · -6.6% YoY. Source: county tax records.
Cash-flow waterfall
monthlySold comps — $/sqft
last 12 mo · ≤1 miLoading sold comps…