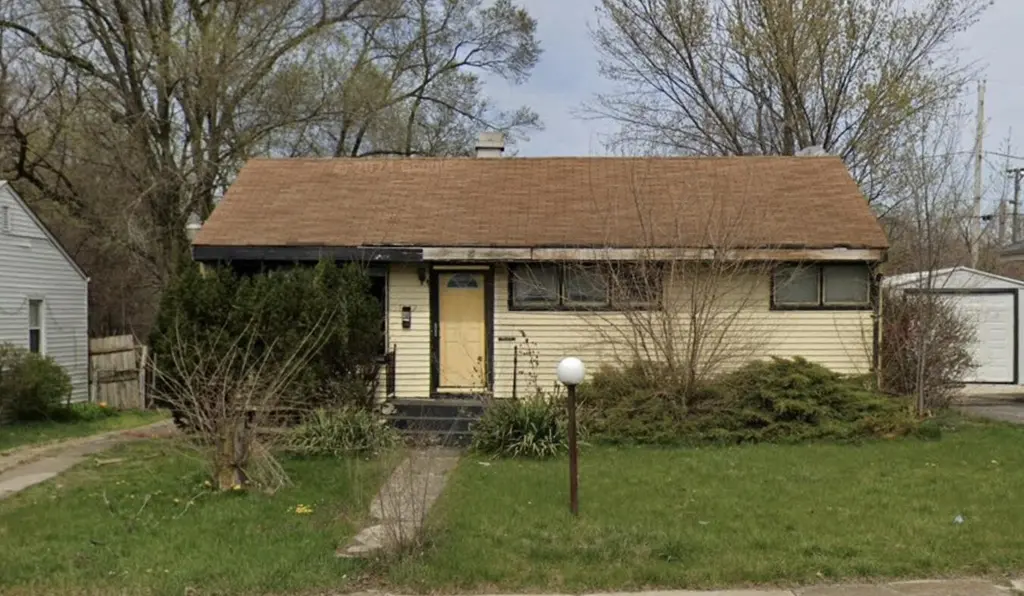
1273 New Jersey St · Gary, IN
Flood risk 1/10 · Minimal
- FEMA flood zone
- X (unshaded)
- Chance of flooding over 30 yrs
- 0.0%
- Est. flood insurance / yr
- $473 – $860
Fire risk 8/10 · Major
- Est. fire insurance / yr
- $717 – $1,331
Heat risk 3/10 · Minor
- Hot days now (above 103°F)
- 7 days/yr
- Hot days in 30 yrs
- 15 days/yr
Wind risk 2/10 · Minimal
- Chance of severe wind over 30 yrs
- 0.0%
Air-quality risk 4/10 · Minor
- Unhealthy air days now
- 6 days/yr
- Unhealthy air days in 30 yrs
- 7 days/yr
Risk factors via First Street. Map © Google.
Why this score? — see what drove the B grade
The composite is a weighted blend of 9 inputs, each scored 0–100. Each bar is that input's sub-score; the figure is the points it added to the 100-point composite (weight × sub-score).
- Cash flow +30.0/30.0
- ARV discount +15.0/15.0
- 1% rule +10.0/10.0
- DSCR +10.0/10.0
- Livability +3.7/5.0
- Rent growth +2.5/5.0
- Condition / age +2.5/5.0
- Schools +0.5/10.0
- Appreciation +0.0/10.0
$69,000
🖨 Deal sheet 📄 Offer letter ✓ Due diligence
Listing remarks
Opportunity awaits with this 3-bedroom, 1-bath ranch featuring a full basement and solid bones with a 2 car garage, making it the perfect project for investors, flippers, or buyers looking to build sweat equity. This home is ready for a complete renovation and offers a functional layout with plenty of potential to transform it into a desirable residence. Situated in a convenient location close to major expressways, commuting is a breeze while still being just a short distance from the beautiful shores of Lake Michigan. Whether you're looking for your next fix-and-flip, rental property, or renovation project, this property offers the foundation needed to bring your vision to life. Don't miss
Key facts
- Full basement
- 2 car garage
- 7,840 sq ft lot
Tags
Property features AI
Finance
- Other: Occupant: Owner; Listing marked not auction
- Financial info: Tax information available (not included per instructions)
- HOA & community: No HOA information provided
Exterior
- Parking: 2-car garage
- Security: No security features specified
- Utilities: Public water; Public sewer
- Home design: Single-story home (one level); Built in 1954; Property described as fixer
- Construction: Year built 1954; No construction material, roof, or foundation information provided
- Exterior features: Neighborhood view; Full unfinished basement with storage space
Interior
- Kitchen: No appliances specified
- Bedrooms: Primary bedroom; Bedroom 2; Bedroom 3
- Flooring: No flooring information provided
- Bathrooms: 1 full bathroom
- Heating & cooling: Central heating; No cooling
- Interior features: No specified interior features
- Laundry & utility: No laundry or utility appliances specified
Neighborhood map
What this means for you Summary
Snapshot
- This is a 3-bed/2.0-bath single-family listed at $69k.
Deal economics
- At list price, monthly cash flow is $666 ($8k/yr) — positive.
- The deal already cash-flows at list — no discount required.
- Meets the 1% rule at list price ($1k rent vs $69k).
- Cap rate 17.9% vs local median 9.1% in Gary — top-decile yield for the area; either an underpriced asset or a hidden risk that comps aren't pricing in. Stress-test before assuming the spread holds.
Location & tenants
- Location reads 73/100 on livability (#105 in IN) — a middle-class / working-renter tenant base. Strengths: commute A+, cost of living A+, housing A+; Watch: schools F, crime F, employment F.
- Gary Community School Corporation (urban): math 3% / reading 11% proficiency, ranked #299 of 301 in IN (top 99%) — low school quality limits family demand, transient renter base, plan for 1-2y turnover; 80% free/reduced lunch — lower-income household profile, screen leases tightly.
- Market conditions: 88 active listings in the ZIP; 5 comparable units currently listed for rent nearby; rentals leasing fast (median 2d on market — plan ~1-2 weeks tenant-placement turnaround); 1,642 units permitted in Lake County in 2024 (14 in 5+ unit buildings).
- This rent runs 38% of the median local income ($46k/yr) — at the standard rent-burdened threshold; future hikes will face affordability resistance.
Forward outlook
- Local home prices are declining (-3.0%/yr); year-one equity from $477 of loan paydown is wiped out by about $2k of value loss. Plan a longer hold.
- Lake County population projected to shrink 7% by 2050 — rents likely to lag national; underwrite the cash flow, not the appreciation.
- At projected returns (-3.0% appreciation + 3.0% rent growth), your $19k cash investment doubles in ~3 years — after that, you're playing with house money.
Negotiation context
- Only 1 days on market — expect competitive offers; lowballing is unlikely to land.
- 8 sale attempts since 26y ago with the ask held roughly flat each time — persistent listings suggest the price (not the market) is what's stuck; bring a comps-based counter.
Risks & watch-outs
- Watch-outs: built in 1954 — expect roof / HVAC / electrical / plumbing capex.
- Climate carrying-cost: severe wildfire risk — expect insurance premiums to compound above CPI over the hold.
Questions for the listing agent
- Built in 1954 — when were the roof, HVAC, electrical panel, plumbing, and water heater last replaced?
- Is there a deadline driving the sale (1031 exchange, divorce, estate, relocation)? That informs how much negotiation room exists.
- Schools are F-rated, which usually means shorter tenancies and higher turnover. Who's the typical renter profile here, and what's been the actual vacancy rate?
- Crime grade is F in this area — have there been break-ins, vandalism, or insurance claims at this property in the last 3 years? What carrier currently insures it and at what premium?
- What's the average days-on-market for RENTAL listings here right now (not sales)? A rising rental-DOM trend means longer vacancies and softer asking-rent achievability than the comps imply.
- What's the recent tenant-quality profile in this submarket — average credit score on applications, eviction rate, late-payment / NSF rate, and stable-employment percentage? A property-management company in the area should have these aggregated.
- How much new for-sale + rental construction is in the pipeline within 1–3 miles? Heavy new supply typically softens prices + rents 12–24 months out; constrained supply supports both.
Investment metrics
- 1% rule
- 2.14% ✓
- Cap rate
- 17.88%
- Cash-on-cash
- 41.36%
- DSCR
- 2.84
- GRM
- 3.9
CMA / ARV
- ARV (on-the-fly)
- $124,057
- Comps found
- 12
Show comp detail 12 sales within ~0.75 mi
| Address | Dist | Beds/Ba | Sqft | Sold | Price | $/sf | Match |
|---|---|---|---|---|---|---|---|
| 1151 Benton St | 0.24mi | 3/2.0 | 936 (-1%) | 3mo | $150,000 | $160 | 84 |
| 4409 E 11th Ave | 0.16mi | 3/1.0 | 944 (-0%) | 6mo | $125,000 | $132 | 83 |
| 3932 E 14th Ave | 0.22mi | 3/2.0 | 960 (+1%) | 10mo | $100,000 | $104 | 80 |
| 3937 E 13th Ave | 0.20mi | 3/1.0 | 884 (-7%) | 8mo | $119,900 | $136 | 69 |
| 1017 Utah St | 0.34mi | 3/1.0 | 912 (-4%) | 7mo | $60,000 | $66 | 68 |
| 1118 Dearborn Cir | 0.39mi | 3/1.0 | 1,008 (+6%) | 9mo | $122,000 | $121 | 59 |
| 1119 Cass St | 0.31mi | 3/1.0 | 1,066 (+13%) | 4mo | $80,000 | $75 | 57 |
| 1047 Decatur St | 0.44mi | 3/1.0 | 850 (-10%) | 2mo | $65,500 | $77 | 56 |
| 5425 E 13th Pl | 0.69mi | 3/1.0 | 936 (-1%) | 8mo | $122,500 | $131 | 56 |
| 1134 Dekalb St | 0.51mi | 3/1.0 | 884 (-7%) | 8mo | $148,000 | $167 | 55 |
| 1121 Dekalb St | 0.54mi | 3/1.0 | 1,060 (+12%) | 3mo | $127,500 | $120 | 49 |
| 5232 E 13th Ave | 0.55mi | 3/1.0 | 850 (-10%) | 10mo | $123,500 | $145 | 44 |
Match score weights: distance 35% · size 25% · config 20% · recency 20%. Top-matched comps best support the ARV.
Projected returns pro-forma
-3.0% appreciation · 3.0% rent growth · sell at horizon
- IRR
- 38.0%
- Equity multiple
- 2.62×
- Total profit
- $31,271
- Equity at exit
- $10,288
- IRR
- 44.5%
- Equity multiple
- 5.24×
- Total profit
- $81,994
- Equity at exit
- $5,966
Cash invested: $19,320 (down + closing). Projections, not guarantees.
Landlord ↔ Tenant lean methodology
- Overall (STATE)
- 90 Strongly Landlord-Friendly
- State Indiana
- 90 Strongly Landlord-Friendly · R+11
- County
- — inherits STATE
- City
- — inherits STATE
ZIP-level market 46403
- Home prices YoY
- -27.3%
- Active inventory
- 88
- Price-to-rent
- 3.9×
Monthly cashflow live
- Estimated rent
- $1,475 high interval (Pro) →
- Mortgage (P&I)
- −$362
- Tax from tax record
- −$109 /mo · $1,304/yr
- Insurance
- −$29
- HOA
- −$0
- Vacancy / Maint / Mgmt
- −$310
- Net cashflow
- $666
Break-even live
UW: 25.0% down · 7.5% · 30yr · 1.5% tax · 5.0% vac · 8.0% maint · 8.0% mgmt
Financing live
Cash to close
- Down payment
- $17,250
- Closing costs
- $2,070
- Reserves months
- —
- Total cash needed
- —
Loan-product check · same deal, 3 products live
Conventional
25% down · 7.5% · 30yr
- Down + closing
- —
- Monthly P&I
- —
- Monthly cashflow
- —
- DSCR
- —
- Eligible?
- —
Personal DTI + credit; lowest rate.
DSCR
20% down · 8.5% · 30yr
- Down + closing
- —
- Monthly P&I
- —
- Monthly cashflow
- —
- DSCR
- —
- Eligible?
- —
No personal income docs; deal must DSCR.
Hard money
10% down · 12.0% · 12mo
- Down + closing
- —
- Monthly P&I
- —
- Monthly cashflow
- —
- DSCR
- —
- Eligible?
- —
Short-term bridge; refi at stabilization.
Rent comps 5 comps
| Address | Beds | Baths | Sqft | Rent | $/sqft | DOM | Units | Dist |
|---|---|---|---|---|---|---|---|---|
| 1118 Benton St Gary, IN | 3.0 | 1.0 | 936 | $1,245 | $1.33 | 1d | 1 | 0.23mi |
| 1252-54 Idaho St Gary, IN | 3.0 | 1.0 | 900 | $2,200 | $2.44 | 1d | 1 | 0.48mi |
| 1041 DeKalb St Gary, IN | 3.0 | 1.0 | 1006 | $1,250 | $1.24 | 43d | 1 | 0.54mi |
| 2908 Central Dr Gary, IN | 3.0 | 1.0 | 884 | $1,525 | $1.73 | 1d | 1 | 1.19mi |
| 430 S Grand Blvd Gary, IN | 2.0 | 1.0 | 830 | $865 | $1.04 | 1d | 1 | 1.43mi |
Listing history 2 events
-
2026-06-18remarks 699-char remark
-
2026-06-18$69,000 Active 1 DOM
ⓘ Source: listings_history table (triggers on properties + properties_extension) + one-shot
backfill from property_details.listing_events for pre-trigger history.
Tax reassessment forecast IN · Partial reset (capped growth)
- Current annual tax
- $1,304 · $109/mo
- Projected year-2 tax
- $1,304 · $109/mo
- Expected delta
- $0/yr ($0/mo · 0.0%)
ⓘ Screening estimate from a state-policy table — verify with the county assessor before closing.
Climate risk First Street
- Flood 1/10 Low FEMA zone X (unshaded) · 0% chance over 30 yrs
- Wildfire 8/10 Severe
- Heat 3/10 Moderate 7 d/yr ≥103°F today · 15 d/yr by 30 yrs out
- Wind 2/10 Low 0% chance of damaging wind over 30 yrs
- Air quality 4/10 Moderate 6 unhealthy d/yr today · 7 by 30 yrs out
Nearby sold comps map
Loading sold comps map…
Walkable amenities ~0.75 mi
Loading nearby amenities…
Taxation est. · year 1
- Rental income
- $17,700
- − Mortgage interest
- −$3,865
- − Property taxes
- −$1,304
- − Insurance
- −$345
- − Repairs & maintenance
- −$1,416
- − Management
- −$1,416
- − Depreciation
- −$2,007
- Taxable income
- $7,346
- Est. tax owed @ 24.0%
- −$1,763
- After-tax cash flow
- $6,229/yr
For passive investors: Depreciation is non-cash, so a rental often shows a tax loss while cash-flowing — sheltering income. Rental losses are passive: they offset passive income freely, and up to $25,000/yr can offset ordinary (W-2) income if you actively participate and your MAGI is under $100k (phasing out to $0 by $150k); unused losses carry forward. On sale, claimed depreciation is recaptured at up to 25%, and gains may owe capital-gains tax (a 1031 exchange can defer both). Figures are a year-1 estimate at your 24.0% rate — not tax advice; consult a CPA.
Schools (NCES district)
- District
- Gary Community School Corporation
- NCES district ID
- 1803870
- Math proficiency
- 3% ▼ -10.00%
- Reading proficiency
- 11% ▼ -6.00%
- Median HH income
- $27,739
- Composite
- 4.98/100
- National rank
- #10039
- State rank
- #299 of 301 in IN
Livability — Gary
- Score
- 73/100
- State rank
- #105
- US rank
- #5592
Category grades
Schools grade is shown separately in the Schools card above.
Census & demographics
- Census place
- Gary, IN
- County
- Lake County · 422,878 people
- City population
- 63,701
- Metro
- Chicago-Naperville-Elgin, IL-IN-WI
- Population (ZIP)
- 10,929
- Household income
- $45,991
- Rent vs Own
- Severe rent burden
- 656.0
Population outlook (Lake County) Hauer SSP2
- Today (2025)
- 484,026 people
- By 2030
- 478,091 · -1.2%
- By 2040
- 462,974 · -4.3%
- By 2050
- 449,894 · -7.1%
- By 2075
- 436,169 · -9.9%
- By 2100
- 426,607 · -11.9%
Race, ethnicity, and origin ACS 2023
- Neighborhood character
- Predominantly Black (71%)
- Race & ethnicity
- Black 71% White 18% Hispanic / Latino 9% Two or more races 4%
- Hispanic origin (detail)
- Mexican 5% Puerto Rican 4%
- Common ancestry
- Romanian 2% Hispanic 1% Iranian 1%
- Foreign-born
- 3% · Canada
- Languages at home
- 96% English-only · Spanish 2%
Political lean MEDSL · Lake
- 2024 margin
- Lean D (+5.6) · D 52.1% · R 46.5% · Other 1.5%
- 2008→2024 swing
- -28.6pp toward R · 2008: 34.3pp · 2024: 5.6pp
- All cycles
- 2024: D+5.6 2020: D+15.1 2016: D+20.6 2012: D+31.0 2008: D+34.3
Not yet ingested
- Civics
- —
Market trends
- HPI YoY
- ▼ -110.41%
- Current HPI
- 294.0935
- Rent YoY
- —
- Metro
- Chicago-Naperville-Elgin, IL-IN-WI
- State GDP YoY
- ▲ 2.90%
- F500 in state
- 18
Industry mix (Fortune 500 HQ in IN)
| Industry | F500 HQs | Revenue |
|---|---|---|
| Industrial Machinery | 2 | $37B |
|
||
| Healthcare | 1 | $177B |
|
||
| Pharmaceuticals | 1 | $45B |
|
||
| Metals / Steel | 1 | $18B |
|
||
| Agriculture | 1 | $17B |
|
||
| Packaging | 1 | $12B |
|
||
Price history
+392.9% since first listed13 events — show timeline
- 2026-06-17 Listed $69,000 NIRA MLS as Distributed by MLS Grid
- 2013-04-01 Listing Removed — NIRA MLS as Distributed by MLS Grid
- 2012-09-19 Listed $29,900 NIRA MLS as Distributed by MLS Grid
- 2011-02-24 Listing Removed — NIRA MLS as Distributed by MLS Grid
- 2010-08-23 Listed $40,000 NIRA MLS as Distributed by MLS Grid
- 2008-12-19 Listing Removed — NIRA MLS as Distributed by MLS Grid
- 2008-02-19 Listed $32,000 NIRA MLS as Distributed by MLS Grid
- 2007-06-01 Listing Removed — NIRA MLS as Distributed by MLS Grid
- 2006-11-17 Listed $65,000 NIRA MLS as Distributed by MLS Grid
- 2005-01-27 Listed $27,400 NIRA MLS as Distributed by MLS Grid
- 2000-12-21 Listed $14,000 NIRA MLS as Distributed by MLS Grid
- 2000-09-22 Listing Removed — NIRA MLS as Distributed by MLS Grid
- 2000-09-22 Listed $14,000 NIRA MLS as Distributed by MLS Grid
Property tax history
-7.3%/yrLatest (2024): $1,304 · +4.1% YoY. Source: county tax records.
Cash-flow waterfall
monthlySold comps — $/sqft
last 12 mo · ≤1 miLoading sold comps…