 🏷️ Likely Rental
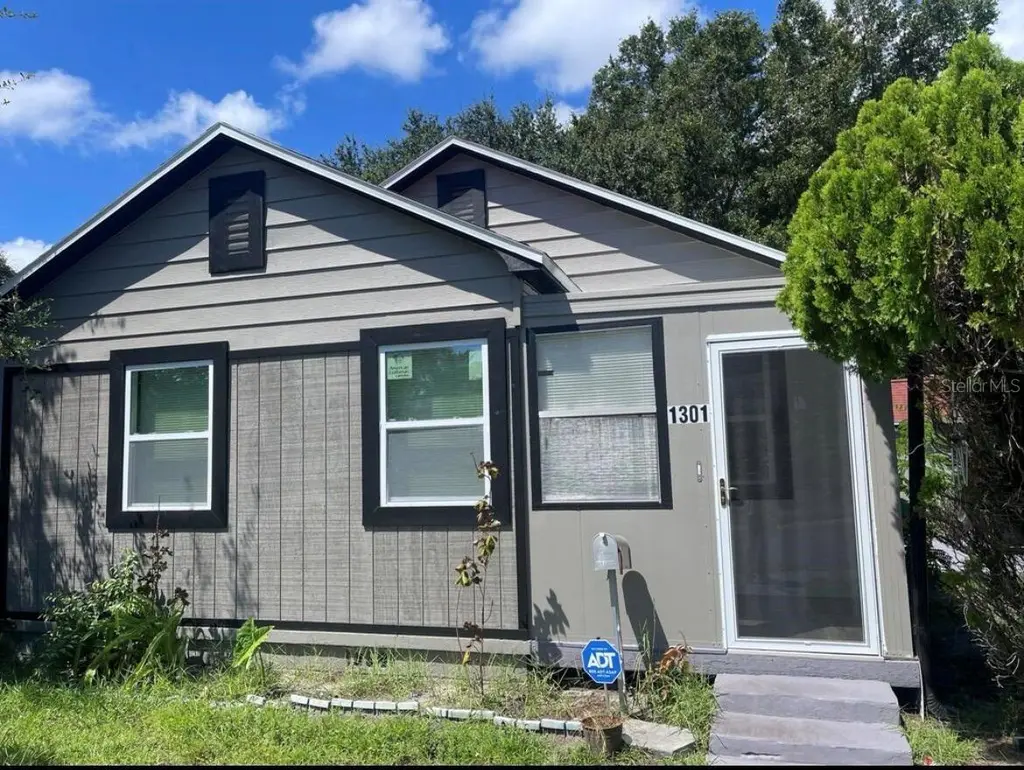
1301 Prescott St S · St. Petersburg, FL
Flood risk 1/10 · Minimal
- FEMA flood zone
- X (unshaded)
- Chance of flooding over 30 yrs
- 0.0%
- Est. flood insurance / yr
- $507 – $1,088
Fire risk 1/10 · Minimal
- Est. fire insurance / yr
- $947 – $1,759
Heat risk 10/10 · Severe
- Hot days now (above 106°F)
- 7 days/yr
- Hot days in 30 yrs
- 27 days/yr
Wind risk 10/10 · Severe
- Chance of severe wind over 30 yrs
- 99.0%
Air-quality risk 4/10 · Minor
- Unhealthy air days now
- 4 days/yr
- Unhealthy air days in 30 yrs
- 4 days/yr
Risk factors via First Street. Map © Google.
Why this score? — see what drove the C- grade
The composite is a weighted blend of 9 inputs, each scored 0–100. Each bar is that input's sub-score; the figure is the points it added to the 100-point composite (weight × sub-score).
- Cash flow +17.1/30.0
- ARV discount +15.0/15.0
- DSCR +5.3/10.0
- 1% rule +5.2/10.0
- Schools +4.3/10.0
- Livability +2.5/5.0
- Condition / age +2.5/5.0
- Rent growth +2.3/5.0
- Appreciation +0.0/10.0
$215,000
🖨 Deal sheet 📄 Offer letter ✓ Due diligence
Listing remarks
Under contract-accepting backup offers. Welcome to this great potential duplex, property introduces some great rental opportunity, this property has 2 units first unit is 2 bed/1 bath , the other unit is 1 bed /1 bath the 2 bed / 1 bath unit is fully renovated ready for a tenant the other 1 bed /1 bath unit is gutted ready to be renovated property and have a tenant in there. 2/1 unit rent can go up to $2000 per month and the 1/1 can go up to $1700 depending on the finishes. House hackers and landlords don't miss this one out!
Key facts
- 5,288 sq ft lot
- Garage
- Built 1936
Property features AI
Finance
- Other: Property identified as Residential Income — Duplex; Total living area reported as 1,391 square feet
- Financial info: Annual net income reported as $0.00
Exterior
- Parking: 1-car garage
- Utilities: Private water source; Other sewer; Other utilities
- Home design: Residential income property (Duplex); Single building on property
- Construction: Other construction materials; Other roof; Other foundation details; Built on 0.12-acre lot
- Exterior features: Other exterior features; Road surface: Other
Interior
- Heating & cooling: Other heating; Other cooling
- Interior features: Other interior features
- Laundry & utility: Other laundry features
Neighborhood map
What this means for you Summary
Snapshot
- This is a ?-bed/2.0-bath single-family listed at $215k.
Deal economics
- At list price, monthly cash flow is $149 ($2k/yr) — positive.
- The deal already cash-flows at list — no discount required.
- Meets the 1% rule at list price ($2k rent vs $215k).
- Recommended offer: $212k (1.5% below list) — sets the bar for market timing.
- Cap rate 7.1% vs local median 2.6% in St. Petersburg — top-decile yield for the area; either an underpriced asset or a hidden risk that comps aren't pricing in. Stress-test before assuming the spread holds.
Location & tenants
- Location reads: area grade C — affects rentability + tenant quality, not the cash-flow math above.
- Pinellas (suburban): math 51% / reading 51% proficiency, ranked #31 of 73 in FL (top 42%) — acceptable for families but not a draw, mixed tenant base, ~2y average lease.
- Market conditions: Rents soft (-0.8%/yr); 204 active listings in the ZIP; 40 comparable units currently listed for rent nearby; rentals leasing fast (median 4d on market — plan ~1-2 weeks tenant-placement turnaround); 2,676 units permitted in Pinellas County in 2024 (1,422 in 5+ unit buildings).
- This rent runs 43% of the median local income ($60k/yr) — at the standard rent-burdened threshold; future hikes will face affordability resistance.
Forward outlook
- Local home prices are declining (-3.0%/yr); year-one equity from $1k of loan paydown is wiped out by about $6k of value loss. Plan a longer hold.
- Pinellas County population projected at +14% by 2050 — modest demand growth; plan on rents tracking national, not racing it.
Negotiation context
- It's been on market 19 days — a 2% lower offer ($212k) is reasonable based on typical stale-listing flexibility.
- 2 sale attempts since 2y ago; this cycle's ask has dropped $20k (8%) from the opening price — seller is motivated, your offer sets the floor, not the list.
Risks & watch-outs
- Watch-outs: built in 1936 — expect roof / HVAC / electrical / plumbing capex.
- Climate carrying-cost: severe wind risk, 99% chance of damaging wind over 30y; extreme-heat days projected 7→27/yr by 2055 (HVAC capex compounding) — expect insurance premiums to compound above CPI over the hold.
Questions for the listing agent
- Built in 1936 — when were the roof, HVAC, electrical panel, plumbing, and water heater last replaced?
- Is there a deadline driving the sale (1031 exchange, divorce, estate, relocation)? That informs how much negotiation room exists.
- What's the average days-on-market for RENTAL listings here right now (not sales)? A rising rental-DOM trend means longer vacancies and softer asking-rent achievability than the comps imply.
- What's the recent tenant-quality profile in this submarket — average credit score on applications, eviction rate, late-payment / NSF rate, and stable-employment percentage? A property-management company in the area should have these aggregated.
- How much new for-sale + rental construction is in the pipeline within 1–3 miles? Heavy new supply typically softens prices + rents 12–24 months out; constrained supply supports both.
Investment metrics
- 1% rule
- 1.02% ✓
- Cap rate
- 7.12%
- Cash-on-cash
- 2.97%
- DSCR
- 1.13
- GRM
- 8.2
CMA / ARV
- ARV (on-the-fly)
- $326,885
- Comps found
- 12
Show comp detail 12 sales within ~0.75 mi
| Address | Dist | Beds/Ba | Sqft | Sold | Price | $/sf | Match |
|---|---|---|---|---|---|---|---|
| 1307 12th Ave S | 0.21mi | 4/2.0 | 1,349 (-3%) | 4mo | $240,000 | $178 | 82 |
| 1333 Melrose Ave S | 0.17mi | 3/2.0 | 1,320 (-5%) | 5mo | $300,000 | $227 | 79 |
| 1717 Preston St S | 0.30mi | 3/2.0 | 1,421 (+2%) | 11mo | $345,000 | $243 | 73 |
| 1126 Melrose Ave S | 0.35mi | 3/2.0 | 1,293 (-7%) | 0mo | $375,000 | $290 | 72 |
| 1618 20th Ave S | 0.54mi | 3/1.0 | 1,378 (-1%) | 3mo | $120,000 | $87 | 67 |
| 1962 15th Ave S | 0.28mi | 3/1.0 | 1,245 (-10%) | 3mo | $122,000 | $98 | 63 |
| 2230 Melrose Ave S | 0.49mi | 3/2.0 | 1,466 (+5%) | 11mo | $345,000 | $235 | 59 |
| 1000 13th Ave S | 0.44mi | 3/2.0 | 1,200 (-14%) | 2mo | $215,000 | $179 | 55 |
| 1067 15th Ave S | 0.44mi | 2/1.0 | 1,470 (+6%) | 13mo | $300,000 | $204 | 55 |
| 2032 22nd Ave S | 0.74mi | 4/2.0 | 1,391 (0%) | 14mo | $369,900 | $266 | 54 |
| 1225 9th Ave S | 0.38mi | 3/2.0 | 1,200 (-14%) | 14mo | $370,000 | $308 | 48 |
| 1511 22nd Ave S | 0.64mi | 3/2.0 | 1,518 (+9%) | 13mo | $398,000 | $262 | 44 |
Match score weights: distance 35% · size 25% · config 20% · recency 20%. Top-matched comps best support the ARV.
Projected returns pro-forma
-3.0% appreciation · 0.0% rent growth · sell at horizon
- IRR
- -15.2%
- Equity multiple
- 0.47×
- Total profit
- $-31,680
- Equity at exit
- $32,057
- IRR
- -13.2%
- Equity multiple
- 0.34×
- Total profit
- $-39,810
- Equity at exit
- $18,589
Cash invested: $60,200 (down + closing). Projections, not guarantees.
Landlord ↔ Tenant lean methodology
- Overall (STATE)
- 87 Strongly Landlord-Friendly
- State Florida
- 87 Strongly Landlord-Friendly · R+3
- County
- — inherits STATE
- City
- — inherits STATE
ZIP-level market 33712
- Rents YoY
- -0.8%
- Active inventory
- 204
- Price-to-rent
- 8.2×
Monthly cashflow live
- Estimated rent
- $2,191 high interval (Pro) →
- Mortgage (P&I)
- −$1,127
- Tax from tax record
- −$365 /mo · $4,379/yr
- Insurance
- −$90
- HOA
- −$0
- Vacancy / Maint / Mgmt
- −$460
- Net cashflow
- $149
Break-even live
UW: 25.0% down · 7.5% · 30yr · 1.5% tax · 5.0% vac · 8.0% maint · 8.0% mgmt
Financing live
Cash to close
- Down payment
- $53,750
- Closing costs
- $6,450
- Reserves months
- —
- Total cash needed
- —
Loan-product check · same deal, 3 products live
Conventional
25% down · 7.5% · 30yr
- Down + closing
- —
- Monthly P&I
- —
- Monthly cashflow
- —
- DSCR
- —
- Eligible?
- —
Personal DTI + credit; lowest rate.
DSCR
20% down · 8.5% · 30yr
- Down + closing
- —
- Monthly P&I
- —
- Monthly cashflow
- —
- DSCR
- —
- Eligible?
- —
No personal income docs; deal must DSCR.
Hard money
10% down · 12.0% · 12mo
- Down + closing
- —
- Monthly P&I
- —
- Monthly cashflow
- —
- DSCR
- —
- Eligible?
- —
Short-term bridge; refi at stabilization.
Rent comps 40 comps
| Address | Beds | Baths | Sqft | Rent | $/sqft | DOM | Units | Dist |
|---|---|---|---|---|---|---|---|---|
| 1349 15th St S Saint Petersburg, FL | 3.0 | 2.0 | 1702 | $2,700 | $1.59 | 24d | 1 | 0.13mi |
| 1427 15th St S Saint Petersburg, FL | 3.0 | 1.0 | 1030 | $2,095 | $2.03 | 4d | 1 | 0.17mi |
| 1465 15th St S Saint Petersburg, FL | 3.0 | 1.5 | 1405 | $2,400 | $1.71 | 4d | 1 | 0.20mi |
| 1920 14th Ave S Saint Petersburg, FL | 3.0 | 2.0 | 1073 | $1,865 | $1.74 | 24d | 1 | 0.24mi |
| 1650 Prescott St S Saint Petersburg, FL | 3.0 | 1.0 | 960 | $2,100 | $2.19 | 4d | 1 | 0.27mi |
| 2028 14th Ave S Unit A St. Petersburg, FL | 2.0 | 2.0 | 1000 | $1,920 | $1.92 | 24d | 1 | 0.29mi |
| 2020 14th Ave S Unit A St. Petersburg, FL | 2.0 | 2.0 | 1000 | $1,920 | $1.92 | 7d | 1 | 0.29mi |
| 1218 13th Ave S Saint Petersburg, FL | 3.0 | 2.0 | 1356 | $2,594 | $1.91 | 4d | 1 | 0.30mi |
| 1760 Queen St S Saint Petersburg, FL | 3.0 | 1.0 | 1004 | $2,000 | $1.99 | 4d | 1 | 0.36mi |
| 1763 Preston St S Saint Petersburg, FL | 3.0 | 1.0 | 1158 | $2,350 | $2.03 | 24d | 1 | 0.37mi |
| 1701 14th St S Unit A St. Petersburg, FL | 2.0 | 1.0 | 1100 | $1,950 | $1.77 | 24d | 1 | 0.40mi |
| 1715 14th St S St. Petersburg, FL | 2.0 | 1.0 | 1000 | $1,850 | $1.85 | 24d | 1 | 0.41mi |
| 1035 15th Ave S Saint Petersburg, FL | 2.0 | 1.0 | 1412 | $1,900 | $1.35 | 4d | 1 | 0.49mi |
| 1847 19th St S Saint Petersburg, FL | 3.0 | 2.0 | 1203 | $2,295 | $1.91 | 4d | 1 | 0.51mi |
| 985 8th Ave S Unit S St. Petersburg, FL | 3.0 | 1.0 | 1061 | $2,700 | $2.54 | 2d | 1 | 0.56mi |
| 1121 Dr Martin Luther King Jr St S Saint Petersburg, FL | 3.0 | 2.0 | 1200 | $2,275 | $1.90 | 4d | 1 | 0.56mi |
| 1828 20th Ave S Saint Petersburg, FL | 3.0 | 1.0 | 1015 | $1,650 | $1.63 | 24d | 1 | 0.57mi |
| 888 14th Ave S St Petersburg, FL | 2.0 | 1.0 | 1084 | $1,825 | $1.68 | 3d | 1 | 0.61mi |
| 1137 Highland St S Saint Petersburg, FL | 3.0 | 2.0 | 1400 | $2,600 | $1.86 | 1d | 1 | 0.63mi |
| 2033 20th St S Saint Petersburg, FL | 3.0 | 1.0 | 1752 | $1,775 | $1.01 | 4d | 1 | 0.63mi |
| 944 18th Ave S Unit A St. Petersburg, FL | 3.0 | 1.0 | 1013 | $2,100 | $2.07 | 17d | 1 | 0.67mi |
| 2010 22nd St S Saint Petersburg, FL | 3.0 | 1.0 | 1036 | $1,695 | $1.64 | 4d | 1 | 0.67mi |
| 1700 3rd Ave S Unit 2 St. Petersburg, FL | 3.0 | 2.0 | 1400 | $4,068 | $2.91 | 24d | 1 | 0.72mi |
| 1724 3rd Ave S Unit 2 St. Petersburg, FL | 2.0 | 2.0 | 1084 | $3,343 | $3.08 | 24d | 1 | 0.72mi |
| 771 14th Ave S Saint Petersburg, FL | 3.0 | 2.0 | 1184 | $2,850 | $2.41 | 3d | 1 | 0.73mi |
| 1919 Doctor Martin Luther King Junior St S Unit 1/2 St. Petersburg, FL | 3.0 | 1.0 | 892 | $2,200 | $2.47 | 1d | 1 | 0.76mi |
| 1919 Doctor Martin Luther King Junior St S Unit 1/2 St. Petersburg, FL | 3.0 | 1.0 | 892 | $2,580 | $2.89 | 19d | 1 | 0.76mi |
| 201 17th St S Saint Petersburg, FL | 1.0–3.0 | 1.0–2.0 | 1073 | $3,438 | $3.20 | 2d | 20 | 0.76mi |
| 930 20th Ave S St. Petersburg, FL | 3.0 | 1.0 | 1190 | $1,995 | $1.68 | 12d | 1 | 0.76mi |
| 2244 21st Ave S Saint Petersburg, FL | 3.0 | 1.0 | 1229 | $2,250 | $1.83 | 4d | 1 | 0.77mi |
| 151 7th St S Saint Petersburg, FL | 2.0 | 1.0–2.0 | 904 | $4,595 | $5.08 | 2d | 19 | 0.81mi |
| 966 22nd Ave S Unit 109 St. Petersburg, FL | 2.0 | 2.0 | 900 | $1,795 | $1.99 | 7d | 1 | 0.84mi |
| 2505 18th St S Saint Petersburg, FL | 3.0 | 2.0 | 1198 | $2,350 | $1.96 | 3d | 1 | 0.85mi |
| 1560 Central Ave Saint Petersburg, FL | 2.0 | 1.0–2.0 | 870 | $3,349 | $3.85 | 1d | 17 | 0.88mi |
| 711 18th Ave S Unit 2 St. Petersburg, FL | 2.0 | 1.0 | 896 | $1,295 | $1.45 | 2d | 1 | 0.90mi |
| 560 26th St S Saint Petersburg, FL | 3.0 | 1.0 | 979 | $2,407 | $2.46 | 24d | 1 | 0.90mi |
| 2728 14th Ave S St. Petersburg, FL | 3.0 | 2.0 | 1257 | $2,100 | $1.67 | 7d | 1 | 0.91mi |
| 675 17th Ave S Unit 1 St. Petersburg, FL | 2.0 | 1.0 | 1000 | $1,950 | $1.95 | 24d | 1 | 0.91mi |
| 1661 Central Ave St. Petersburg, FL | 2.0 | 1.0–2.0 | 804 | $3,242 | $4.03 | 1d | 15 | 0.93mi |
| 1701 Central Ave Saint Petersburg, FL | 2.0 | 1.0–2.0 | 837 | $3,640 | $4.35 | 1d | 19 | 0.94mi |
Listing history 8 events
-
2026-06-15days on market $215,000 Active 19 DOM
-
2026-06-13statusdays on market $215,000 Active 17 DOM
-
2026-05-11status Pending
-
2026-05-07price $215,000
-
2026-05-01price $225,000
-
2026-04-27$234,900 Active
-
2024-10-23historical $1,750
-
2024-08-29$1,750
ⓘ Source: listings_history table (triggers on properties + properties_extension) + one-shot
backfill from property_details.listing_events for pre-trigger history.
Tax reassessment forecast FL · Resets to sale price
- Current annual tax
- $4,379 · $365/mo
- Projected year-2 tax
- $4,379 · $365/mo
- Expected delta
- $0/yr ($0/mo · 0.0%)
ⓘ Screening estimate from a state-policy table — verify with the county assessor before closing.
Climate risk First Street
- Flood 1/10 Low FEMA zone X (unshaded) · 0% chance over 30 yrs
- Wildfire 1/10 Low
- Heat 10/10 Extreme 7 d/yr ≥106°F today · 27 d/yr by 30 yrs out
- Wind 10/10 Extreme 99% chance of damaging wind over 30 yrs
- Air quality 4/10 Moderate 4 unhealthy d/yr today · 4 by 30 yrs out
Nearby sold comps map
Loading sold comps map…
Walkable amenities ~0.75 mi
Loading nearby amenities…
Taxation est. · year 1
- Rental income
- $26,293
- − Mortgage interest
- −$12,043
- − Property taxes
- −$4,379
- − Insurance
- −$1,075
- − Repairs & maintenance
- −$2,103
- − Management
- −$2,103
- − Depreciation
- −$6,255
- Taxable loss
- −$1,666
- Est. tax savings @ 24.0%
- +$400
- After-tax cash flow
- $2,187/yr
For passive investors: Depreciation is non-cash, so a rental often shows a tax loss while cash-flowing — sheltering income. Rental losses are passive: they offset passive income freely, and up to $25,000/yr can offset ordinary (W-2) income if you actively participate and your MAGI is under $100k (phasing out to $0 by $150k); unused losses carry forward. On sale, claimed depreciation is recaptured at up to 25%, and gains may owe capital-gains tax (a 1031 exchange can defer both). Figures are a year-1 estimate at your 24.0% rate — not tax advice; consult a CPA.
Schools (NCES district)
- District
- Pinellas
- NCES district ID
- 1201560
- Math proficiency
- 51% ▼ -5.00%
- Reading proficiency
- 51% ▼ -3.00%
- Median HH income
- $46,270
- Composite
- 43.27/100
- National rank
- #3046
- State rank
- #31 of 73 in FL
Livability — St. Petersburg
No livability data for this city. (Only ~50 U.S. cities are tracked.)
Census & demographics
- Census place
- St. Petersburg, FL
- County
- Pinellas County · 939,478 people
- City population
- 249,151
- Metro
- Tampa-St. Petersburg-Clearwater, FL
- Population (ZIP)
- 27,142
- Household income
- $60,450
- Rent vs Own
- Severe rent burden
- 1928.0
Population outlook (Pinellas County) Hauer SSP2
- Today (2025)
- 1,027,532 people
- By 2030
- 1,063,586 · +3.5%
- By 2040
- 1,125,020 · +9.5%
- By 2050
- 1,168,637 · +13.7%
- By 2075
- 1,265,188 · +23.1%
- By 2100
- 1,260,357 · +22.7%
Race, ethnicity, and origin ACS 2023
- Neighborhood character
- Predominantly Black (68%)
- Race & ethnicity
- Black 68% White 23% Two or more races 6% Hispanic / Latino 4%
- Common ancestry
- Lithuanian 1% Slovak 1% Estonian 1%
- Foreign-born
- 7% · Canada, Jamaica
- Languages at home
- 92% English-only · French/Haitian/Cajun 3% Spanish 3% Other Indo-European 1%
Political lean MEDSL · Pinellas
- 2024 margin
- Lean R (+5.2) · D 46.9% · R 52.1%
- 2008→2024 swing
- -13.5pp toward R · 2008: 8.3pp · 2024: -5.2pp
- All cycles
- 2024: R+5.2 2020: D+0.2 2016: R+1.1 2012: D+5.6 2008: D+8.3
Not yet ingested
- Civics
- —
Market trends
- HPI YoY
- ▼ -275.45%
- Current HPI
- 412.7251
- Rent YoY
- ▼ -0.77%
- Metro
- Tampa-St. Petersburg-Clearwater, FL
- State GDP YoY
- ▲ 3.28%
- F500 in state
- 36
Industry mix (Fortune 500 HQ in FL)
| Industry | F500 HQs | Revenue |
|---|---|---|
| Industrial Technology | 2 | $29B |
|
||
| Insurance | 2 | $17B |
|
||
| Retail | 1 | $60B |
|
||
| Technology Distribution | 1 | $58B |
|
||
| Homebuilding | 1 | $35B |
|
||
| Technology Manufacturing | 1 | $35B |
|
||
Price history
+12185.7% since first listed6 events — show timeline
- 2026-05-11 Pending — Stellar MLS as Distributed by MLS Grid
- 2026-05-07 Price Changed $215,000 Stellar MLS as Distributed by MLS Grid
- 2026-05-01 Price Changed $225,000 Stellar MLS as Distributed by MLS Grid
- 2026-04-27 Listed $234,900 Stellar MLS as Distributed by MLS Grid
- 2024-10-23 Rental Removed $1,750 TURBOTENANT
- 2024-08-29 Listed for Rent $1,750 TURBOTENANT
Property tax history
+16.5%/yrLatest (2025): $4,379 · +110.0% YoY. Source: county tax records.
Cash-flow waterfall
monthlySold comps — $/sqft
last 12 mo · ≤1 miLoading sold comps…