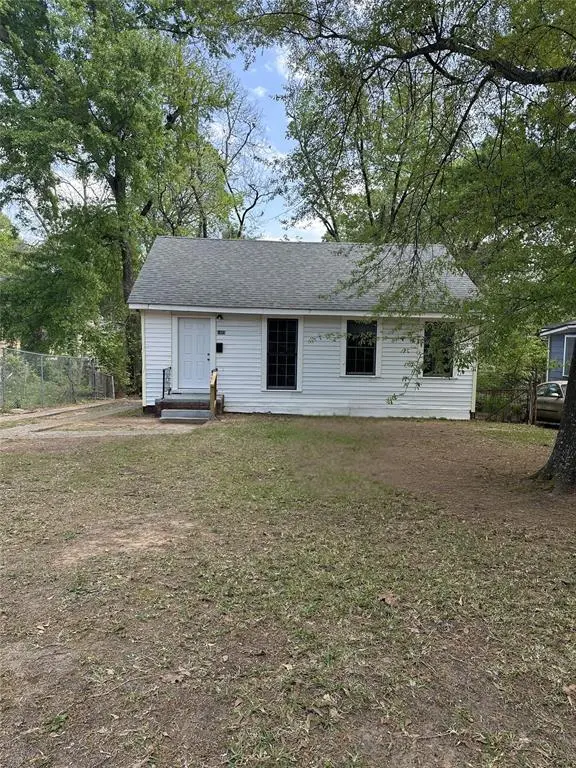
1809 Jenkins Ave · Shreveport, LA
Flood risk 1/10 · Minimal
- FEMA flood zone
- X (unshaded)
- Chance of flooding over 30 yrs
- 0.0%
- Est. flood insurance / yr
- $507 – $1,088
Fire risk 1/10 · Minimal
- Est. fire insurance / yr
- $1,269 – $2,357
Heat risk 7/10 · Major
- Hot days now (above 110°F)
- 7 days/yr
- Hot days in 30 yrs
- 21 days/yr
Wind risk 6/10 · Moderate
- Chance of severe wind over 30 yrs
- 66.0%
Air-quality risk 2/10 · Minimal
- Unhealthy air days now
- 1 days/yr
- Unhealthy air days in 30 yrs
- 2 days/yr
Risk factors via First Street. Map © Google.
Why this score? — see what drove the B grade
The composite is a weighted blend of 9 inputs, each scored 0–100. Each bar is that input's sub-score; the figure is the points it added to the 100-point composite (weight × sub-score).
- Cash flow +30.0/30.0
- DSCR +10.0/10.0
- 1% rule +8.0/10.0
- ARV discount +7.5/15.0
- Appreciation +4.8/10.0
- Livability +3.0/5.0
- Rent growth +2.5/5.0
- Condition / age +2.5/5.0
- Schools +2.2/10.0
$60,000
🖨 Deal sheet (PDF) 📄 Offer letter ✓ Due diligence
Listing remarks
Great investment opportunity with immediate income! This 2 bedroom, 1 bathroom home is currently tenant occupied on a month to month lease at $750 per month. This property features a 2.5 year old roof, central heat and air, and a gas hot water heater for added peace of mind. Inside, you'll find wood flooring and an inviting eat in kitchen with tile countertops along with a gas range and refrigerator. A solid, low maintenance rental with dependable cash floor and strong investment potential. Do not disturb tenant.
Key facts
- Gas hot water heater
- Wood flooring
- 2.5 year old roof
Tags
Property features AI
Finance
- Other: Property type: Residential - Single Family Residence; Lot size less than 0.5 acre (approx. 0.155 acres)
- Financial info: Accepts cash, fixed and other financing; Second mortgage: none
- HOA & community: No homeowners association
Exterior
- Parking: Driveway; Attached 1-car garage
- Security: Smoke detector(s)
- Utilities: City water; City sewer; Not in a municipal utility district
- Home design: Single family residence; One story; Residential property; Year built 1955; Not attached to another property; Subdivision: Oak Grove Sub
- Construction: Siding exterior; Composition roof; Pillar/post/pier foundation
- Exterior features: Covered porch(es)
Interior
- Kitchen: Gas range; Refrigerator; Eat-in layout
- Bedrooms: Primary bedroom on main level; Second bedroom on main level
- Flooring: Wood flooring
- Bathrooms: One full bathroom with garden tub, medicine cabinet and built-in cabinets
- Heating & cooling: Central heating (natural gas); Central air conditioning
- Interior features: Eat-in kitchen; Built-in cabinets; Tile counters; One living area; One dining area; Room count: 6
- Laundry & utility: Laundry located in kitchen; Other laundry area
Neighborhood map
What this means for you Summary
Snapshot
- This is a 2-bed/1.0-bath single-family listed at $60k.
Deal economics
- At list price, monthly cash flow is $246 ($3k/yr) — positive.
- The deal already cash-flows at list — no discount required.
- Meets the 1% rule at list price ($781 rent vs $60k).
- Recommended offer: $59k (1.5% below list) — sets the bar for market timing.
- Cap rate 11.2% vs local median 5.7% in Shreveport — top-decile yield for the area; either an underpriced asset or a hidden risk that comps aren't pricing in. Stress-test before assuming the spread holds.
Location & tenants
- Location reads 59/100 on livability (#270 in LA) — a working-class tenant base; expect higher turnover. Strengths: cost of living A+, housing A; Watch: crime F, amenities F, commute F.
- Caddo Parish (urban): math 21% / reading 32% proficiency, ranked #53 of 98 in LA (top 54%) — low school quality limits family demand, transient renter base, plan for 1-2y turnover; 64% free/reduced lunch — lower-income household profile, screen leases tightly.
- Zoned schools: Creswell Elementary School (math 17% / reading 12%, grade F, #516 of 646 statewide, top 82%, 250 students, 81% FRL); Caddo Parish Middle Magnet School (math 79% / reading 93%, grade A+, #1 of 218 statewide, top 0%, 1,003 students, 23% FRL); C.E. Byrd High School (math 44% / reading 55%, grade D, #37 of 265 statewide, top 14%, 1,526 students, 43% FRL).
- Zoned-school proficiency averages 50% at this address vs 26% district-wide (+24 pts) — the actual schools serving this property are materially stronger than the Caddo Parish average implies; a family-tenant draw the district grade alone would hide.
- Market conditions: 62 active listings in the ZIP; 40 comparable units currently listed for rent nearby; rentals at typical pace (median 23d on market — plan ~3-4 weeks tenant-placement turnaround); lower-income renter base — watch delinquency; 221 units permitted in Caddo Parish in 2024 (0 in 5+ unit buildings).
Forward outlook
- In year one you build about $234 of equity ($415 loan paydown + $-181 appreciation (-0.3% local appreciation)).
- Caddo County population projected at -15% by 2050 — secular population decline; favor cash flow + early exit over multi-decade hold.
- At projected returns (-0.3% appreciation + 3.0% rent growth), your $17k cash investment doubles in ~5 years — after that, you're playing with house money.
Negotiation context
- It's been on market 21 days — a 2% lower offer ($59k) is reasonable based on typical stale-listing flexibility.
- Current owner paid $42k; 43% above their basis — modest negotiation headroom, anchor on the comps not their cost.
Risks & watch-outs
- Watch-outs: built in 1955 — expect roof / HVAC / electrical / plumbing capex.
- Climate carrying-cost: major wind risk, 66% chance of damaging wind over 30y; extreme-heat days projected 7→21/yr by 2055 (HVAC capex compounding) — expect insurance premiums to compound above CPI over the hold.
Questions for the listing agent
- Built in 1955 — when were the roof, HVAC, electrical panel, plumbing, and water heater last replaced?
- Is there a deadline driving the sale (1031 exchange, divorce, estate, relocation)? That informs how much negotiation room exists.
- Schools are D-rated, which usually means shorter tenancies and higher turnover. Who's the typical renter profile here, and what's been the actual vacancy rate?
- Crime grade is F in this area — have there been break-ins, vandalism, or insurance claims at this property in the last 3 years? What carrier currently insures it and at what premium?
- What's the average days-on-market for RENTAL listings here right now (not sales)? A rising rental-DOM trend means longer vacancies and softer asking-rent achievability than the comps imply.
- What's the recent tenant-quality profile in this submarket — average credit score on applications, eviction rate, late-payment / NSF rate, and stable-employment percentage? A property-management company in the area should have these aggregated.
- How much new for-sale + rental construction is in the pipeline within 1–3 miles? Heavy new supply typically softens prices + rents 12–24 months out; constrained supply supports both.
Investment metrics
- 1% rule
- 1.30% ✓
- Cap rate
- 11.22%
- Cash-on-cash
- 17.58%
- DSCR
- 1.78
- GRM
- 6.4
CMA / ARV
- ARV (on-the-fly)
- $38,970
- Comps found
- 7
Show comp detail 7 sales within ~0.75 mi
| Address | Dist | Beds/Ba | Sqft | Sold | Price | $/sf | Match |
|---|---|---|---|---|---|---|---|
| 1821 Jenkins Ave | 0.03mi | 2/1.0 | 858 (-1%) | 11mo | $17,000 | $20 | 88 |
| 1836 Cook | 0.10mi | 2/1.0 | 853 (-2%) | 16mo | $25,000 | $29 | 79 |
| 267 E Lister St | 0.21mi | 2/1.0 | 772 (-11%) | 5mo | $39,900 | $52 | 68 |
| 2618 Roosevelt Ave | 0.59mi | 3/1.0 (+1) | 845 (-2%) | 1mo | $45,000 | $53 | 62 |
| 235 E Olive St | 0.12mi | 2/1.0 | 791 (-9%) | 22mo | $35,900 | $45 | 62 |
| 257 E Egan St | 0.33mi | 2/1.0 | 931 (+8%) | 13mo | $45,000 | $48 | 62 |
| 522 Coon | 0.54mi | 3/1.0 (+1) | 976 (+13%) | 22mo | $19,900 | $20 | 30 |
Match score weights: distance 35% · size 25% · config 20% · recency 20%. Top-matched comps best support the ARV.
Projected returns pro-forma
-0.3% appreciation · 3.0% rent growth · sell at horizon
- IRR
- 16.4%
- Equity multiple
- 1.78×
- Total profit
- $13,066
- Equity at exit
- $16,525
- IRR
- 21.3%
- Equity multiple
- 3.29×
- Total profit
- $38,436
- Equity at exit
- $19,161
Cash invested: $16,800 (down + closing). Projections, not guarantees.
Landlord ↔ Tenant lean methodology
- Overall (STATE)
- 90 Strongly Landlord-Friendly
- State Louisiana
- 90 Strongly Landlord-Friendly · R+12
- County
- — inherits STATE
- City
- — inherits STATE
ZIP-level market 71101
- Home prices YoY
- -0.4%
- Active inventory
- 62
- Price-to-rent
- 6.4×
Monthly cashflow live
- Estimated rent
- $781 high interval (Pro) →
- Mortgage (P&I)
- −$315
- Tax from tax record
- −$31 /mo · $370/yr
- Insurance
- −$25
- HOA
- −$0
- Lot rent
- −$0
- Vacancy / Maint / Mgmt
- −$164
- Net cashflow
- $246
Break-even live
Sensitivity live
| Price | -10% $280 | -5% $263 | +0% $246 | +5% $229 | +10% $212 |
|---|---|---|---|---|---|
| Rent | -10% $185 | -5% $215 | +0% $246 | +5% $277 | +10% $308 |
| Rate | -1.0pp $276 | -0.5pp $261 | base $246 | +0.5pp $231 | +1.0pp $215 |
UW: 25.0% down · 7.5% · 30yr · 1.5% tax · 5.0% vac · 8.0% maint · 8.0% mgmt
Financing live
Cash to close
- Down payment
- $15,000
- Closing costs
- $1,800
- Reserves months
- —
- Total cash needed
- —
Loan-product check · same deal, 3 products live
Conventional
25% down · 7.5% · 30yr
- Down + closing
- —
- Monthly P&I
- —
- Monthly cashflow
- —
- DSCR
- —
- Eligible?
- —
Personal DTI + credit; lowest rate.
DSCR
20% down · 8.5% · 30yr
- Down + closing
- —
- Monthly P&I
- —
- Monthly cashflow
- —
- DSCR
- —
- Eligible?
- —
No personal income docs; deal must DSCR.
Hard money
10% down · 12.0% · 12mo
- Down + closing
- —
- Monthly P&I
- —
- Monthly cashflow
- —
- DSCR
- —
- Eligible?
- —
Short-term bridge; refi at stabilization.
Rent comps 40 comps
| Address | Beds | Baths | Sqft | Rent | $/sqft | DOM | Units | Dist |
|---|---|---|---|---|---|---|---|---|
| 336 E Olive St Shreveport, LA | 2.0 | 1.0 | 600 | $595 | $0.99 | 46d | 1 | 0.13mi |
| 253 E Jordan St Unit 251 Shreveport, LA | 2.0 | 1.0 | 784 | $900 | $1.15 | 46d | 1 | 0.27mi |
| 139 Lister St Shreveport, LA | 1.0 | 1.0 | 650 | $600 | $0.92 | 16d | 1 | 0.37mi |
| 202 E College St Apt 2 Shreveport, LA | 1.0 | 1.0 | 800 | $600 | $0.75 | 46d | 1 | 0.43mi |
| 2317 Freewater St Shreveport, LA | 2.0 | 1.0 | 695 | $750 | $1.08 | 16d | 1 | 0.44mi |
| 114 Egan St Shreveport, LA | 1.0 | 1.0 | 800 | $550 | $0.69 | 46d | 1 | 0.45mi |
| 204 Boulevard St Shreveport, LA | 2.0 | 1.0 | 1028 | $1,195 | $1.16 | 46d | 1 | 0.47mi |
| 1225 Pecan St Unit B Shreveport, LA | 3.0 | 2.0 | 1070 | $900 | $0.84 | 23d | 1 | 0.50mi |
| 320 College St Unit A Shreveport, LA | 1.0 | 1.0 | 800 | $650 | $0.81 | 23d | 1 | 0.56mi |
| 2618 Roosevelt Ave Shreveport, LA | 3.0 | 1.0 | 845 | $1,000 | $1.18 | 23d | 1 | 0.59mi |
| 140 Wilkinson St Unit 140 Shreveport, LA | 2.0 | 1.0 | 1000 | $1,200 | $1.20 | 23d | 1 | 0.63mi |
| 1535 River Parkway Blvd Shreveport, LA | 1.0–3.0 | 1.0–2.0 | 928 | $1,740 | $1.88 | 16d | 10 | 0.71mi |
| 409 Egan St Shreveport, LA | 2.0 | 1.0 | 1000 | $725 | $0.72 | 46d | 1 | 0.72mi |
| 431 College St Shreveport, LA | 2.0 | 2.0 | 1100 | $850 | $0.77 | 16d | 1 | 0.72mi |
| 402 Egan St Unit Gilbert, 1320 Shreveport, LA | 2.0 | 1.0 | 600 | $565 | $0.94 | 23d | 1 | 0.72mi |
| 342 Prospect St Shreveport, LA | 1.0 | 1.0 | 800 | $650 | $0.81 | 23d | 1 | 0.73mi |
| 523 Wichita St Shreveport, LA | 1.0 | 1.0 | 800 | $650 | $0.81 | 23d | 1 | 0.78mi |
| 455 Egan St Shreveport, LA | 1.0 | 1.0 | 650 | $650 | $1.00 | 46d | 1 | 0.80mi |
| 533 Merrick St Unit C Shreveport, LA | 1.0 | 1.0 | 825 | $595 | $0.72 | 23d | 1 | 0.82mi |
| 818 E Washington St Shreveport, LA | 3.0 | 1.0 | 1100 | $1,300 | $1.18 | 23d | 1 | 0.86mi |
| 557 Merrick St Shreveport, LA | 1.0 | 1.0 | 950 | $725 | $0.76 | 46d | 1 | 0.87mi |
| 517 Stoner Ave Shreveport, LA | 2.0 | 1.0 | 1100 | $625 | $0.57 | 46d | 1 | 0.87mi |
| 546 Dalzell St Shreveport, LA | 2.0 | 1.0 | 1000 | $875 | $0.88 | 23d | 1 | 0.90mi |
| 1301 Coates Bluff Dr Shreveport, LA | 1.0–2.0 | 1.0–2.0 | 1004 | $2,300 | $2.29 | 16d | 11 | 0.95mi |
| 649 Merrick St Shreveport, LA | 1.0 | 1.0 | 700 | $650 | $0.93 | 16d | 1 | 0.98mi |
| 336 Atkins Ave Shreveport, LA | 2.0 | 1.0 | 912 | $900 | $0.99 | 46d | 1 | 1.07mi |
| 640 Kirby Pl Unit 640 Shreveport, LA | 1.0 | 1.0 | 850 | $600 | $0.71 | 23d | 1 | 1.14mi |
| 1844 Line Ave Unit 2 Shreveport, LA | 1.0 | 1.0 | 750 | $850 | $1.13 | 23d | 1 | 1.16mi |
| 1844 Line Ave Unit 2 Shreveport, LA | 1.0 | 1.0 | 750 | $850 | $1.13 | 46d | 1 | 1.16mi |
| 820 College St Apt 2 (Upstairs Front) Shreveport, LA | 1.0 | 1.0 | 750 | $575 | $0.77 | 16d | 1 | 1.18mi |
| 2903 Weyman St Shreveport, LA | 1.0–2.0 | 1.0 | 800 | $950 | $1.19 | 16d | 6 | 1.18mi |
| 654 Columbia St Shreveport, LA | 1.0 | 1.0 | 600 | $850 | $1.42 | 23d | 1 | 1.19mi |
| 819 Boulevard St Shreveport, LA | 2.0 | 1.0 | 900 | $800 | $0.89 | 23d | 1 | 1.20mi |
| 2201 Naples St Bossier City, LA | 2.0 | 1.0 | 759 | $775 | $1.02 | 46d | 1 | 1.28mi |
| 3307 Creswell Ave Shreveport, LA | 1.0 | 1.0 | 525 | $800 | $1.52 | 23d | 1 | 1.30mi |
| 3307 Creswell Ave Shreveport, LA | 1.0 | 1.0 | 700 | $850 | $1.21 | 46d | 1 | 1.30mi |
| 553 Gladstone Blvd Unit A Shreveport, LA | 1.0 | 1.0 | 850 | $700 | $0.82 | 46d | 1 | 1.34mi |
| 810 Rutherford St Unit A Shreveport, LA | 1.0 | 1.0 | 700 | $800 | $1.14 | 16d | 1 | 1.38mi |
| 1225 Delhi St Bossier City, LA | 3.0 | 1.0 | 1092 | $800 | $0.73 | 23d | 1 | 1.45mi |
| 1019 Sheridan Ave Unit C Shreveport, LA | 1.0 | 1.0 | 650 | $650 | $1.00 | 46d | 1 | 1.46mi |
Listing history 19 events
-
2026-06-16days on market $60,000 Active 21 DOM
-
2026-06-15days on market $60,000 Active 20 DOM
-
2026-06-14days on market $60,000 Active 18 DOM
-
2026-06-13days on market $60,000 Active 17 DOM
-
2026-06-10days on market $60,000 Active 15 DOM
-
2026-06-09days on market $60,000 Active 14 DOM
-
2026-06-08days on market $60,000 Active 13 DOM
-
2026-06-07days on market $60,000 Active 12 DOM
-
2026-06-05days on market $60,000 Active 9 DOM
-
2026-06-03days on market $60,000 Active 8 DOM
-
2026-06-02days on market $60,000 Active 7 DOM
-
2026-06-01days on market $60,000 Active 6 DOM
-
2026-05-31days on market $60,000 Active 5 DOM
-
2026-05-30days on market $60,000 Active 4 DOM
-
2026-05-26$60,000 Active
-
2011-03-07soldstatus $42,000
-
2006-12-13soldstatus
-
2005-06-10soldstatus
-
2000-10-12soldstatus
ⓘ Source: listings_history table (triggers on properties + properties_extension) + one-shot
backfill from property_details.listing_events for pre-trigger history.
Tax reassessment forecast LA · Resets to sale price
- Current annual tax
- $370 · $31/mo
- Projected year-2 tax
- $370 · $31/mo
- Expected delta
- $0/yr ($0/mo · 0.0%)
ⓘ Screening estimate from a state-policy table — verify with the county assessor before closing.
Climate risk First Street
- Flood 1/10 Low FEMA zone X (unshaded) · 0% chance over 30 yrs
- Wildfire 1/10 Low
- Heat 7/10 Severe 7 d/yr ≥110°F today · 21 d/yr by 30 yrs out
- Wind 6/10 Major 66% chance of damaging wind over 30 yrs
- Air quality 2/10 Low 1 unhealthy d/yr today · 2 by 30 yrs out
Nearby sold comps map
Loading sold comps map…
Walkable amenities ~0.75 mi
Loading nearby amenities…
Taxation est. · year 1
- Rental income
- $9,367
- − Mortgage interest
- −$3,361
- − Property taxes
- −$370
- − Insurance
- −$300
- − Repairs & maintenance
- −$749
- − Management
- −$749
- − Depreciation
- −$1,745
- Taxable income
- $2,092
- Est. tax owed @ 24.0%
- −$502
- After-tax cash flow
- $2,452/yr
For passive investors: Depreciation is non-cash, so a rental often shows a tax loss while cash-flowing — sheltering income. Rental losses are passive: they offset passive income freely, and up to $25,000/yr can offset ordinary (W-2) income if you actively participate and your MAGI is under $100k (phasing out to $0 by $150k); unused losses carry forward. On sale, claimed depreciation is recaptured at up to 25%, and gains may owe capital-gains tax (a 1031 exchange can defer both). Figures are a year-1 estimate at your 24.0% rate — not tax advice; consult a CPA.
Schools (NCES district)
- District
- Caddo Parish
- NCES district ID
- 2200300
- Math proficiency
- 21% ▼ -33.00%
- Reading proficiency
- 32% ▼ -30.00%
- Median HH income
- $39,227
- Composite
- 22.23/100
- National rank
- #8148
- State rank
- #53 of 98 in LA
Livability — Shreveport
- Score
- 59/100
- State rank
- #270
- US rank
- #19730
Category grades
Schools grade is shown separately in the Schools card above.
Census & demographics
- Census place
- Shreveport, LA
- County
- Caddo Parish · 178,536 people
- City population
- 164,123
- Metro
- Shreveport-Bossier City, LA
- Population (ZIP)
- 6,415
- Household income
- $19,351
- Rent vs Own
- Severe rent burden
- 702.0
Population outlook (Caddo County) Hauer SSP2
- Today (2025)
- 243,190 people
- By 2030
- 237,231 · -2.5%
- By 2040
- 222,502 · -8.5%
- By 2050
- 206,516 · -15.1%
- By 2075
- 165,706 · -31.9%
- By 2100
- 122,262 · -49.7%
Race, ethnicity, and origin ACS 2023
- Neighborhood character
- Majority Black (63%)
- Race & ethnicity
- Black 63% White 29% Hispanic / Latino 5% Two or more races 2%
- Common ancestry
- Lithuanian 1% Slovak 1%
- Foreign-born
- 2% · China
- Languages at home
- 98% English-only · Tagalog/Filipino 0%
Political lean MEDSL · Caddo
- 2024 margin
- Toss-up / Even · D 51.6% · R 47.0% · Other 1.4%
- 2008→2024 swing
- +1.6pp toward D · 2008: 3.0pp · 2024: 4.6pp
- All cycles
- 2024: D+4.6 2020: D+6.8 2016: D+4.2 2012: D+4.9 2008: D+3.0
Not yet ingested
- Civics
- —
Market trends
- HPI YoY
- ▼ -0.30%
- Current HPI
- 74.2131
- Rent YoY
- —
- Metro
- Shreveport-Bossier City, LA
- State GDP YoY
- ▲ 3.29%
- F500 in state
- 10
Industry mix (Fortune 500 HQ in LA)
| Industry | F500 HQs | Revenue |
|---|---|---|
| Telecommunications | 2 | $23B |
|
||
| Utilities | 1 | $12B |
|
||
| Wholesale / Distribution | 1 | $5B |
|
||
| Advertising | 1 | $2B |
|
||
Price history
+42.9% since first listed5 events — show timeline
- 2026-05-26 Listed $60,000 NTREIS
- 2011-03-07 Sold (Public Records) $42,000 Public Records
- 2006-12-13 Sold (Public Records) — Public Records
- 2005-06-10 Sold (Public Records) — Public Records
- 2000-10-12 Sold (Public Records) — Public Records
Property tax history
-1.7%/yrLatest (2025): $370 · +0.4% YoY. Source: county tax records.
Cash-flow waterfall
monthlySold comps — $/sqft
last 12 mo · ≤1 miLoading sold comps…