23750 Carson Dr #34 · Pioneer, CA
Flood risk 1/10 · Minimal
- FEMA flood zone
- X (unshaded)
- Chance of flooding over 30 yrs
- 0.0%
- Est. flood insurance / yr
- $507 – $1,088
Fire risk 8/10 · Major
- Est. fire insurance / yr
- $659 – $1,223
Heat risk 4/10 · Minor
- Hot days now (above 98°F)
- 3 days/yr
- Hot days in 30 yrs
- 8 days/yr
Wind risk 1/10 · Minimal
- Chance of severe wind over 30 yrs
- —
Air-quality risk 10/10 · Severe
- Unhealthy air days now
- 26 days/yr
- Unhealthy air days in 30 yrs
- 32 days/yr
Risk factors via First Street. Map © Google.
Why this score? — see what drove the B grade
The composite is a weighted blend of 9 inputs, each scored 0–100. Each bar is that input's sub-score; the figure is the points it added to the 100-point composite (weight × sub-score).
- Cash flow +30.0/30.0
- ARV discount +12.2/15.0
- 1% rule +10.0/10.0
- DSCR +10.0/10.0
- Livability +3.2/5.0
- Schools +2.7/10.0
- Rent growth +2.5/5.0
- Condition / age +2.5/5.0
- Appreciation +0.0/10.0
$85,000
🖨 Deal sheet 📄 Offer letter ✓ Due diligence
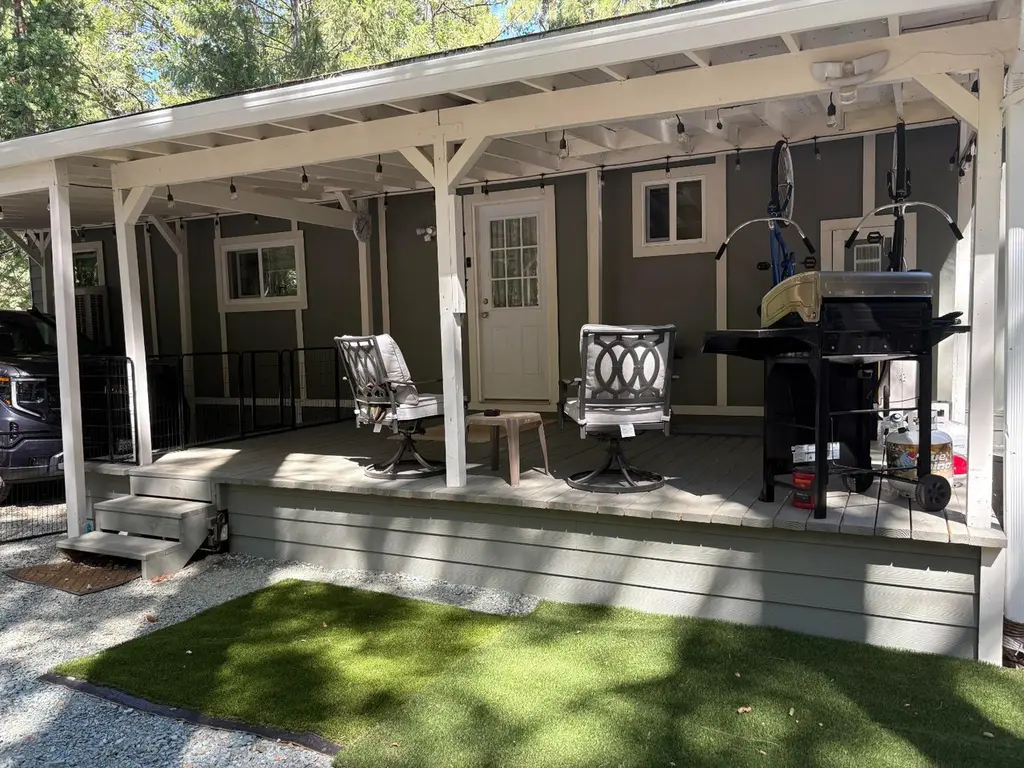
Listing remarks
Tucked into a shady glen, this home offers a serene and picturesque setting within the park. With inviting living spaces and an easy indoor-outdoor flow, it's designed for comfort in every season. The layout feels both cozy and spacious, creating a welcoming vibe the moment you step inside. Inside, you'll find a charming wood stove set in a relaxing nookperfect for winter eveningsalong with an adjacent living room that adds flexibility and comfort. A new evaporative cooler keeps the whole home feeling refreshing in the summer months, and fresh paint and siding bring everything together with a crisp, updated look. The pristine lot enhances the property's natural beauty while giving you room
Key facts
- Cozy wood stove
- New paint
- String patio lights
Tags
Neighborhood map
What this means for you Summary
Snapshot
- This is a 2-bed/2.0-bath single-family listed at $85k.
Deal economics
- At list price, monthly cash flow is $874 ($10k/yr) — positive.
- The deal already cash-flows at list — no discount required.
- Meets the 1% rule at list price ($2k rent vs $85k).
- Recommended offer: $75k (12.0% below list) — sets the bar for market timing.
Location & tenants
- Location reads 64/100 on livability (#419 in CA) — a middle-class / working-renter tenant base. Strengths: employment A+, housing A+, crime A; Watch: schools D-, amenities F, commute F.
- Amador County Unified (town): math 23% / reading 37% proficiency, ranked #330 of 517 in CA (top 64%) — families likely to look elsewhere, expect single-tenant / working-renter base with shorter leases.
- Market conditions: 152 active listings in the ZIP; 66 units permitted in Amador County in 2024 (0 in 5+ unit buildings).
Forward outlook
- Local home prices are declining (-3.0%/yr); year-one equity from $588 of loan paydown is wiped out by about $3k of value loss. Plan a longer hold.
- Amador County population projected at -15% by 2050 — secular population decline; favor cash flow + early exit over multi-decade hold.
- At projected returns (-3.0% appreciation + 3.0% rent growth), your $24k cash investment doubles in ~3 years — after that, you're playing with house money.
Negotiation context
- It's been on market 319 days — a 12% lower offer ($75k) is reasonable based on typical stale-listing flexibility.
Risks & watch-outs
- Climate carrying-cost: severe wildfire risk — expect insurance premiums to compound above CPI over the hold.
Questions for the listing agent
- It's been on market 319 days. Have you received any prior offers? Is the seller open to a 12% concession, seller financing, or rate buy-down credit?
- Built in 1978 — when were the roof, HVAC, electrical panel, plumbing, and water heater last replaced?
- Why hasn't it sold? Are there any deal-killer items the seller is aware of (foundation, flood, title, zoning, code violations)?
- Is there a deadline driving the sale (1031 exchange, divorce, estate, relocation)? That informs how much negotiation room exists.
- Schools are D-rated, which usually means shorter tenancies and higher turnover. Who's the typical renter profile here, and what's been the actual vacancy rate?
- What's the average days-on-market for RENTAL listings here right now (not sales)? A rising rental-DOM trend means longer vacancies and softer asking-rent achievability than the comps imply.
- What's the recent tenant-quality profile in this submarket — average credit score on applications, eviction rate, late-payment / NSF rate, and stable-employment percentage? A property-management company in the area should have these aggregated.
- How much new for-sale + rental construction is in the pipeline within 1–3 miles? Heavy new supply typically softens prices + rents 12–24 months out; constrained supply supports both.
Investment metrics
- 1% rule
- 2.18% ✓
- Cap rate
- 18.63%
- Cash-on-cash
- 44.07%
- DSCR
- 2.96
- GRM
- 3.8
CMA / ARV
- ARV (median comp)
- $95,000
- List price
- $85,000
- Delta
- -5.26%
- Verdict
- FAIR
- Comps
- 11 within 1.0 mi
Show comp detail 3 sales within ~0.75 mi
| Address | Dist | Beds/Ba | Sqft | Sold | Price | $/sf | Match |
|---|---|---|---|---|---|---|---|
| 24291 Carson Dr | 0.59mi | 3/2.0 (+1) | 1,440 (+11%) | 6mo | $321,000 | $223 | 44 |
| 23970 Woodfern Dr | 0.30mi | 3/2.0 (+1) | 1,468 (+13%) | 18mo | $339,000 | $231 | 44 |
| 24301 Carson Dr | 0.59mi | 3/2.0 (+1) | 1,248 (-4%) | 22mo | $320,000 | $256 | 43 |
Match score weights: distance 35% · size 25% · config 20% · recency 20%. Top-matched comps best support the ARV.
Projected returns pro-forma
-3.0% appreciation · 3.0% rent growth · sell at horizon
- IRR
- 41.0%
- Equity multiple
- 2.76×
- Total profit
- $41,927
- Equity at exit
- $12,674
- IRR
- 47.3%
- Equity multiple
- 5.55×
- Total profit
- $108,311
- Equity at exit
- $7,349
Cash invested: $23,800 (down + closing). Projections, not guarantees.
Landlord ↔ Tenant lean methodology
- Overall (STATE)
- 18 Strongly Tenant-Friendly
- State California
- 18 Strongly Tenant-Friendly · D+13
- County
- — inherits STATE
- City
- — inherits STATE
ZIP-level market 95666
- Active inventory
- 152
- Price-to-rent
- 3.8×
Monthly cashflow live
- Estimated rent
- $1,850 medium interval (Pro) →
- Mortgage (P&I)
- −$446
- Tax est. 1.5%
- −$106 /mo · $1,275/yr
- Insurance
- −$35
- HOA
- −$0
- Vacancy / Maint / Mgmt
- −$389
- Net cashflow
- $874
Break-even live
UW: 25.0% down · 7.5% · 30yr · 1.5% tax · 5.0% vac · 8.0% maint · 8.0% mgmt
Financing live
Cash to close
- Down payment
- $21,250
- Closing costs
- $2,550
- Reserves months
- —
- Total cash needed
- —
Loan-product check · same deal, 3 products live
Conventional
25% down · 7.5% · 30yr
- Down + closing
- —
- Monthly P&I
- —
- Monthly cashflow
- —
- DSCR
- —
- Eligible?
- —
Personal DTI + credit; lowest rate.
DSCR
20% down · 8.5% · 30yr
- Down + closing
- —
- Monthly P&I
- —
- Monthly cashflow
- —
- DSCR
- —
- Eligible?
- —
No personal income docs; deal must DSCR.
Hard money
10% down · 12.0% · 12mo
- Down + closing
- —
- Monthly P&I
- —
- Monthly cashflow
- —
- DSCR
- —
- Eligible?
- —
Short-term bridge; refi at stabilization.
Listing history 15 events
-
2026-06-19price $85,000 Active 319 DOM
-
2026-06-18days on market $90,000 Active 319 DOM
-
2026-06-17days on market $90,000 Active 318 DOM
-
2026-06-16days on market $90,000 Active 317 DOM
-
2026-06-15days on market $90,000 Active 316 DOM
-
2026-06-13days on market $90,000 Active 314 DOM
-
2026-06-13days on market $90,000 Active 313 DOM
-
2026-06-09days on market $90,000 Active 310 DOM
-
2026-06-08days on market $90,000 Active 309 DOM
-
2026-06-07days on market $90,000 Active 308 DOM
-
2026-06-05days on market $90,000 Active 305 DOM
-
2026-06-03days on market $90,000 Active 304 DOM
-
2026-06-02days on market $90,000 Active 303 DOM
-
2026-06-01days on market $90,000 Active 302 DOM
-
2026-05-31days on market $90,000 Active 301 DOM
ⓘ Source: listings_history table (triggers on properties + properties_extension) + one-shot
backfill from property_details.listing_events for pre-trigger history.
Climate risk First Street
- Flood 1/10 Low FEMA zone X (unshaded) · 0% chance over 30 yrs
- Wildfire 8/10 Severe
- Heat 4/10 Moderate 3 d/yr ≥98°F today · 8 d/yr by 30 yrs out
- Wind 1/10 Low
- Air quality 10/10 Extreme 26 unhealthy d/yr today · 32 by 30 yrs out
Nearby sold comps map
Loading sold comps map…
Walkable amenities ~0.75 mi
Loading nearby amenities…
Taxation est. · year 1
- Rental income
- $22,200
- − Mortgage interest
- −$4,761
- − Property taxes
- −$1,275
- − Insurance
- −$425
- − Repairs & maintenance
- −$1,776
- − Management
- −$1,776
- − Depreciation
- −$2,473
- Taxable income
- $9,714
- Est. tax owed @ 24.0%
- −$2,331
- After-tax cash flow
- $8,158/yr
For passive investors: Depreciation is non-cash, so a rental often shows a tax loss while cash-flowing — sheltering income. Rental losses are passive: they offset passive income freely, and up to $25,000/yr can offset ordinary (W-2) income if you actively participate and your MAGI is under $100k (phasing out to $0 by $150k); unused losses carry forward. On sale, claimed depreciation is recaptured at up to 25%, and gains may owe capital-gains tax (a 1031 exchange can defer both). Figures are a year-1 estimate at your 24.0% rate — not tax advice; consult a CPA.
Schools (NCES district)
- District
- Amador County Unified
- NCES district ID
- 0602450
- Math proficiency
- 23% ▼ -9.00%
- Reading proficiency
- 37% ▼ -10.00%
- Median HH income
- $55,428
- Composite
- 26.67/100
- National rank
- #7163
- State rank
- #330 of 517 in CA
Livability — Pioneer
- Score
- 64/100
- State rank
- #419
- US rank
- #14266
Category grades
Schools grade is shown separately in the Schools card above.
Census & demographics
- Census place
- Pioneer, CA
- Population (ZIP)
- 6,089
Population outlook (Amador County) Hauer SSP2
- Today (2025)
- 35,295 people
- By 2030
- 34,147 · -3.3%
- By 2040
- 31,618 · -10.4%
- By 2050
- 29,913 · -15.2%
- By 2075
- 27,308 · -22.6%
- By 2100
- 23,465 · -33.5%
Race, ethnicity, and origin ACS 2023
- Neighborhood character
- Predominantly White (81%)
- Race & ethnicity
- White 81% Hispanic / Latino 13% Two or more races 9% Asian 1%
- Hispanic origin (detail)
- Mexican 10%
- Common ancestry
- Italian 4% Scottish 4% Slovak 2%
- Foreign-born
- 2% · Canada, South Korea
- Languages at home
- 96% English-only · Spanish 1% German/W. Germanic 1% Tagalog/Filipino 1%
Political lean MEDSL · Amador
- 2024 margin
- Strong R (+27.8) · D 34.7% · R 62.6% · Other 2.7%
- 2008→2024 swing
- -13.2pp toward R · 2008: -14.6pp · 2024: -27.8pp
- All cycles
- 2024: R+27.8 2020: R+24.4 2016: R+25.2 2012: R+19.0 2008: R+14.6
Not yet ingested
- Civics
- —
Market trends
- HPI YoY
- ▼ -107.84%
- Current HPI
- 143.0962
- Rent YoY
- —
- Metro
- —
- State GDP YoY
- ▲ 3.21%
- F500 in state
- 116
Industry mix (Fortune 500 HQ in CA)
| Industry | F500 HQs | Revenue |
|---|---|---|
| Technology | 27 | $1,492B |
|
||
| Financial Services | 3 | $174B |
|
||
| Retail | 3 | $44B |
|
||
| Insurance | 3 | $26B |
|
||
| Media / Entertainment | 2 | $115B |
|
||
| Pharmaceuticals / Biotech | 2 | $62B |
|
||
Cash-flow waterfall
monthlySold comps — $/sqft
last 12 mo · ≤1 miLoading sold comps…