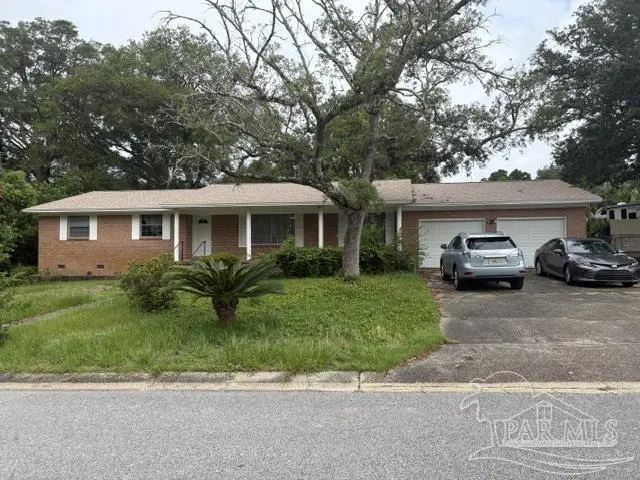
3 Rodgers Pl · West Pensacola, FL
Flood risk 1/10 · Minimal
- FEMA flood zone
- X (unshaded)
- Chance of flooding over 30 yrs
- 0.0%
- Est. flood insurance / yr
- $507 – $1,088
Fire risk 2/10 · Minimal
- Est. fire insurance / yr
- $947 – $1,759
Heat risk 10/10 · Severe
- Hot days now (above 105°F)
- 7 days/yr
- Hot days in 30 yrs
- 24 days/yr
Wind risk 9/10 · Severe
- Chance of severe wind over 30 yrs
- 99.0%
Air-quality risk 1/10 · Minimal
- Unhealthy air days now
- 0 days/yr
- Unhealthy air days in 30 yrs
- 0 days/yr
Risk factors via First Street. Map © Google.
Why this score? — see what drove the C- grade
The composite is a weighted blend of 9 inputs, each scored 0–100. Each bar is that input's sub-score; the figure is the points it added to the 100-point composite (weight × sub-score).
- Cash flow +21.3/30.0
- ARV discount +7.5/15.0
- DSCR +6.8/10.0
- 1% rule +4.8/10.0
- Schools +3.6/10.0
- Rent growth +3.5/5.0
- Livability +3.3/5.0
- Condition / age +2.5/5.0
- Appreciation +0.0/10.0
$220,000
🖨 Deal sheet 📄 Offer letter ✓ Due diligence
Listing remarks
This single family residence is in need of some TLC. The owner passed at a nearby medical facility and the Son and Personal Rep have received notification from the Courts that this property can now be sold. A newer Roof was installed on 09/14/2021. Water Heater was replaced on 2/28/2019. Foundation work was also performed and documented in a Property Inspection Report conducted by the Estate. Because of its location and pricing, this property will NOT last long. Information pertaining to upgrades was obtained from the Escambia County Building Permit Website. Room measurements were taken from databases and believed to be accurate. Buyer/Buyers Agent should confirm all measurements.
Key facts
- Newer roof
- Foundation work
- 0.31 acre lot
Tags
Property features AI
Finance
- Other: Lot size approximately 0.31 acres; Building area about 1,881 square feet
- HOA & community: No homeowners association
Exterior
- Parking: Attached 2-car garage; Two covered parking spaces (total 2 spaces)
- Utilities: Public sewer; Circuit breaker electrical service; Public water
- Home design: Single-story brick home; Resale property; Off-grade foundation; Ridge vent for ventilation
- Construction: Brick construction; Built with one level; Off-grade foundation
- Exterior features: Back yard fencing; Shingle roof; Paved, county-maintained road access; Public water
Interior
- Kitchen: Electric water heater
- Bedrooms: Primary bedroom on the first floor (approx. 15' x 13'); Two additional first-floor bedrooms (each approx. 13' x 10')
- Flooring: Hardwood; Carpet
- Bathrooms: Two full bathrooms; One half bathroom
- Heating & cooling: Heat pump heating; Central air conditioning
- Interior features: Hardwood and carpet flooring; Breakfast nook; Living/dining combo
Neighborhood map
What this means for you Summary
Snapshot
- This is a 4-bed/2.0-bath single-family listed at $220k.
Deal economics
- At list price, monthly cash flow is $321 ($4k/yr) — positive.
- The deal already cash-flows at list — no discount required.
- To meet the 1% rule (rent ≥ 1% of price), the offer needs to be $215k (2.3% below list).
- Recommended offer: $215k (2.3% below list) — sets the bar for 1% rule.
Location & tenants
- Location reads 66/100 on livability (#629 in FL) — a middle-class / working-renter tenant base. Strengths: cost of living A+, housing A+, health & safety B+; Watch: crime D, schools F, amenities F.
- Escambia (suburban): math 40% / reading 45% proficiency, ranked #56 of 73 in FL (top 77%) — families likely to look elsewhere, expect single-tenant / working-renter base with shorter leases.
- Market conditions: Rents rising (+3.9%/yr); 270 active listings in the ZIP; 7 comparable units currently listed for rent nearby; rentals at typical pace (median 24d on market — plan ~3-4 weeks tenant-placement turnaround); 1,479 units permitted in Escambia County in 2024 (0 in 5+ unit buildings).
- This rent runs 41% of the median local income ($62k/yr) — at the standard rent-burdened threshold; future hikes will face affordability resistance.
Forward outlook
- Local home prices are declining (-3.0%/yr); year-one equity from $2k of loan paydown is wiped out by about $7k of value loss. Plan a longer hold.
- Escambia County population projected at +13% by 2050 — modest demand growth; plan on rents tracking national, not racing it.
Negotiation context
- Only 12 days on market — expect competitive offers; lowballing is unlikely to land.
- Current owner paid $31k; list at $220k implies a 614% gain — meaningful room to come down on a strong offer.
Risks & watch-outs
- Climate carrying-cost: severe wind risk, 99% chance of damaging wind over 30y; extreme-heat days projected 7→24/yr by 2055 (HVAC capex compounding) — expect insurance premiums to compound above CPI over the hold.
Questions for the listing agent
- Built in 1974 — when were the roof, HVAC, electrical panel, plumbing, and water heater last replaced?
- Is there a deadline driving the sale (1031 exchange, divorce, estate, relocation)? That informs how much negotiation room exists.
- Schools are F-rated, which usually means shorter tenancies and higher turnover. Who's the typical renter profile here, and what's been the actual vacancy rate?
- Crime grade is D in this area — have there been break-ins, vandalism, or insurance claims at this property in the last 3 years? What carrier currently insures it and at what premium?
- What's the average days-on-market for RENTAL listings here right now (not sales)? A rising rental-DOM trend means longer vacancies and softer asking-rent achievability than the comps imply.
- What's the recent tenant-quality profile in this submarket — average credit score on applications, eviction rate, late-payment / NSF rate, and stable-employment percentage? A property-management company in the area should have these aggregated.
- How much new for-sale + rental construction is in the pipeline within 1–3 miles? Heavy new supply typically softens prices + rents 12–24 months out; constrained supply supports both.
Investment metrics
- 1% rule
- 0.98% ✗
- Cap rate
- 8.04%
- Cash-on-cash
- 6.25%
- DSCR
- 1.28
- GRM
- 8.5
CMA / ARV
- ARV (on-the-fly)
- $220,077
- Comps found
- 12
Show comp detail 12 sales within ~0.75 mi
| Address | Dist | Beds/Ba | Sqft | Sold | Price | $/sf | Match |
|---|---|---|---|---|---|---|---|
| 319 N 57th Ave | 0.24mi | 4/2.0 | 2,010 (+7%) | 6mo | $340,000 | $169 | 72 |
| 4998 Prieto Dr | 0.13mi | 3/2.0 (-1) | 1,775 (-6%) | 9mo | $270,000 | $152 | 72 |
| 311 N 57th Ave | 0.25mi | 4/2.0 | 1,812 (-4%) | 13mo | $250,000 | $138 | 71 |
| 5500 Lynwood Dr | 0.42mi | 3/2.0 (-1) | 1,839 (-2%) | 5mo | $215,000 | $117 | 67 |
| 519 S Edgewood Cir | 0.38mi | 4/2.0 | 1,764 (-6%) | 9mo | $155,000 | $88 | 65 |
| 12 Western Dr | 0.59mi | 4/2.0 | 1,826 (-3%) | 10mo | $234,900 | $129 | 59 |
| 801 N 57th Ave | 0.65mi | 5/2.0 (+1) | 1,857 (-1%) | 5mo | $139,900 | $75 | 59 |
| 27 Linda St | 0.60mi | 3/2.0 (-1) | 1,952 (+4%) | 7mo | $127,000 | $65 | 55 |
| 22 Flynn Dr | 0.68mi | 5/1.5 (+1) | 1,891 (+0%) | 10mo | $189,000 | $100 | 52 |
| 6030 Schofield Dr | 0.41mi | 4/3.0 | 2,127 (+13%) | 6mo | $137,000 | $64 | 50 |
| 4901 Birch Ave | 0.70mi | 4/2.0 | 1,726 (-8%) | 11mo | $247,900 | $144 | 44 |
| 625 Edgecliff Dr | 0.64mi | 3/3.0 (-1) | 2,065 (+10%) | 2mo | $230,000 | $111 | 43 |
Match score weights: distance 35% · size 25% · config 20% · recency 20%. Top-matched comps best support the ARV.
Projected returns pro-forma
-3.0% appreciation · 3.85% rent growth · sell at horizon
- IRR
- -5.8%
- Equity multiple
- 0.78×
- Total profit
- $-13,427
- Equity at exit
- $32,803
- IRR
- 4.7%
- Equity multiple
- 1.36×
- Total profit
- $22,123
- Equity at exit
- $19,022
Cash invested: $61,600 (down + closing). Projections, not guarantees.
Landlord ↔ Tenant lean methodology
- Overall (STATE)
- 87 Strongly Landlord-Friendly
- State Florida
- 87 Strongly Landlord-Friendly · R+3
- County
- — inherits STATE
- City
- — inherits STATE
ZIP-level market 32506
- Home prices YoY
- -22.5%
- Rents YoY
- 3.9%
- Active inventory
- 270
- Price-to-rent
- 8.5×
Monthly cashflow live
- Estimated rent
- $2,150 high interval (Pro) →
- Mortgage (P&I)
- −$1,154
- Tax from tax record
- −$132 /mo · $1,587/yr
- Insurance
- −$92
- HOA
- −$0
- Vacancy / Maint / Mgmt
- −$451
- Net cashflow
- $321
Break-even live
UW: 25.0% down · 7.5% · 30yr · 1.5% tax · 5.0% vac · 8.0% maint · 8.0% mgmt
Financing live
Cash to close
- Down payment
- $55,000
- Closing costs
- $6,600
- Reserves months
- —
- Total cash needed
- —
Loan-product check · same deal, 3 products live
Conventional
25% down · 7.5% · 30yr
- Down + closing
- —
- Monthly P&I
- —
- Monthly cashflow
- —
- DSCR
- —
- Eligible?
- —
Personal DTI + credit; lowest rate.
DSCR
20% down · 8.5% · 30yr
- Down + closing
- —
- Monthly P&I
- —
- Monthly cashflow
- —
- DSCR
- —
- Eligible?
- —
No personal income docs; deal must DSCR.
Hard money
10% down · 12.0% · 12mo
- Down + closing
- —
- Monthly P&I
- —
- Monthly cashflow
- —
- DSCR
- —
- Eligible?
- —
Short-term bridge; refi at stabilization.
Rent comps 7 comps
| Address | Beds | Baths | Sqft | Rent | $/sqft | DOM | Units | Dist |
|---|---|---|---|---|---|---|---|---|
| 5705 Admiral Doyle Rd Pensacola, FL | 4.0 | 3.0 | 1988 | $2,200 | $1.11 | 23d | 1 | 0.26mi |
| 11 Gunn Cir Pensacola, FL | 4.0 | 2.5 | 1894 | $2,400 | $1.27 | 14d | 1 | 0.31mi |
| 6700 Lake Charlene Dr Pensacola, FL | 4.0 | 2.5 | 1823 | $2,100 | $1.15 | 23d | 1 | 0.85mi |
| 231 S 69th Ave Pensacola, FL | 4.0 | 3.0 | 2039 | $1,925 | $0.94 | 23d | 1 | 0.98mi |
| 542 S 72nd Ave Unit C Pensacola, FL | 3.0 | 2.0 | 1300 | $1,400 | $1.08 | 23d | 1 | 1.18mi |
| 7071 Lake Joanne Dr Unit 2A Pensacola, FL | 3.0 | 2.0 | 1300 | $1,400 | $1.08 | 23d | 1 | 1.20mi |
| 7071 Lake Joanne Dr Unit 2C Pensacola, FL | 3.0 | 2.0 | 1300 | $1,400 | $1.08 | 14d | 1 | 1.20mi |
Listing history 10 events
-
2026-06-18days on market $220,000 Active 12 DOM
-
2026-06-17days on market $220,000 Active 11 DOM
-
2026-06-16days on market $220,000 Active 10 DOM
-
2026-06-15days on market $220,000 Active 9 DOM
-
2026-06-14days on market $220,000 Active 7 DOM
-
2026-06-10days on market $220,000 Active 4 DOM
-
2026-06-09days on market $220,000 Active 3 DOM
-
2026-06-08days on market $220,000 Active 2 DOM
-
2026-06-07remarks 691-char remark
-
2026-06-07$220,000 Active 1 DOM
ⓘ Source: listings_history table (triggers on properties + properties_extension) + one-shot
backfill from property_details.listing_events for pre-trigger history.
Tax reassessment forecast FL · Resets to sale price
- Current annual tax
- $1,587 · $132/mo
- Projected year-2 tax
- $1,826 · $152/mo
- Expected delta
- +$239/yr (+$20/mo · 15.1%)
ⓘ Screening estimate from a state-policy table — verify with the county assessor before closing.
Climate risk First Street
- Flood 1/10 Low FEMA zone X (unshaded) · 0% chance over 30 yrs
- Wildfire 2/10 Low
- Heat 10/10 Extreme 7 d/yr ≥105°F today · 24 d/yr by 30 yrs out
- Wind 9/10 Extreme 99% chance of damaging wind over 30 yrs
- Air quality 1/10 Low 0 unhealthy d/yr today · 0 by 30 yrs out
Nearby sold comps map
Loading sold comps map…
Walkable amenities ~0.75 mi
Loading nearby amenities…
Taxation est. · year 1
- Rental income
- $25,797
- − Mortgage interest
- −$12,323
- − Property taxes
- −$1,587
- − Insurance
- −$1,100
- − Repairs & maintenance
- −$2,064
- − Management
- −$2,064
- − Depreciation
- −$6,400
- Taxable income
- $259
- Est. tax owed @ 24.0%
- −$62
- After-tax cash flow
- $3,786/yr
For passive investors: Depreciation is non-cash, so a rental often shows a tax loss while cash-flowing — sheltering income. Rental losses are passive: they offset passive income freely, and up to $25,000/yr can offset ordinary (W-2) income if you actively participate and your MAGI is under $100k (phasing out to $0 by $150k); unused losses carry forward. On sale, claimed depreciation is recaptured at up to 25%, and gains may owe capital-gains tax (a 1031 exchange can defer both). Figures are a year-1 estimate at your 24.0% rate — not tax advice; consult a CPA.
Schools (NCES district)
- District
- Escambia
- NCES district ID
- 1200510
- Math proficiency
- 40% ▼ -9.00%
- Reading proficiency
- 45% ▼ -4.00%
- Median HH income
- $44,649
- Composite
- 36.04/100
- National rank
- #4773
- State rank
- #56 of 73 in FL
Livability — West Pensacola
- Score
- 66/100
- State rank
- #629
- US rank
- #12275
Category grades
Schools grade is shown separately in the Schools card above.
Census & demographics
- Census place
- West Pensacola, FL
- County
- Escambia County · 301,722 people
- Metro
- Pensacola-Ferry Pass-Brent, FL
- Population (ZIP)
- 34,549
- Household income
- $62,486
- Rent vs Own
- Severe rent burden
- 1359.0
Population outlook (Escambia County) Hauer SSP2
- Today (2025)
- 334,637 people
- By 2030
- 345,779 · +3.3%
- By 2040
- 364,828 · +9.0%
- By 2050
- 378,514 · +13.1%
- By 2075
- 403,220 · +20.5%
- By 2100
- 386,125 · +15.4%
Race, ethnicity, and origin ACS 2023
- Neighborhood character
- Diverse neighborhood (Simpson 0.60)
- Race & ethnicity
- White 60% Black 18% Two or more races 11% Hispanic / Latino 6% Asian 6%
- Hispanic origin (detail)
- Mexican 3%
- Common ancestry
- Lithuanian 4% Slovak 2% Italian 2%
- Foreign-born
- 9% · Canada, China, Vietnam
- Languages at home
- 89% English-only · Spanish 4% Tagalog/Filipino 2% Other Indo-European 1%
Political lean MEDSL · Escambia
- 2024 margin
- R (+19.5) · D 39.7% · R 59.2% · Other 1.1%
- 2008→2024 swing
- -0.2pp no change · 2008: -19.3pp · 2024: -19.5pp
- All cycles
- 2024: R+19.5 2020: R+15.1 2016: R+20.6 2012: R+20.6 2008: R+19.3
Not yet ingested
- Civics
- —
Market trends
- HPI YoY
- ▼ -71.86%
- Current HPI
- 247.6085
- Rent YoY
- ▲ 3.85%
- Metro
- Pensacola-Ferry Pass-Brent, FL
- State GDP YoY
- ▲ 3.28%
- F500 in state
- 36
Industry mix (Fortune 500 HQ in FL)
| Industry | F500 HQs | Revenue |
|---|---|---|
| Industrial Technology | 2 | $29B |
|
||
| Insurance | 2 | $17B |
|
||
| Retail | 1 | $60B |
|
||
| Technology Distribution | 1 | $58B |
|
||
| Homebuilding | 1 | $35B |
|
||
| Technology Manufacturing | 1 | $35B |
|
||
Price history
+214.3% since first listed4 events — show timeline
- 2026-06-06 Listed $220,000 PARMLS
- 1992-12-01 Sold (Public Records) $30,800 Public Records
- 1988-05-01 Sold (Public Records) $81,000 Public Records
- 1985-07-01 Sold (Public Records) $70,000 Public Records
Property tax history
+2.9%/yrLatest (2025): $1,587 · +14.2% YoY. Source: county tax records.
Cash-flow waterfall
monthlySold comps — $/sqft
last 12 mo · ≤1 miLoading sold comps…