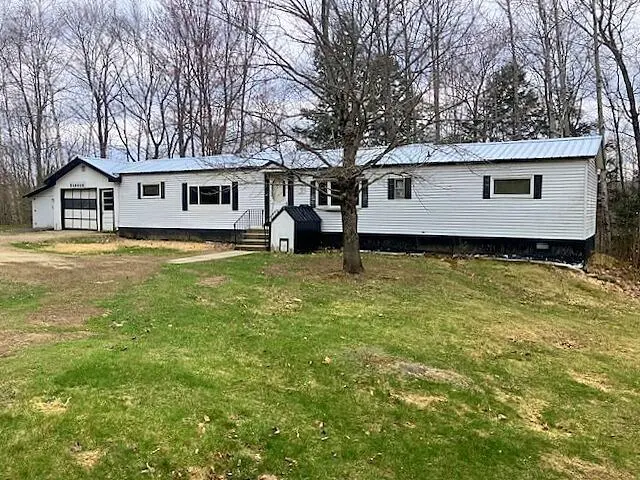
48 Farrington Rd · Jay, ME
Flood risk No data
- FEMA flood zone
- —
- Chance of flooding over 30 yrs
- —
- Est. flood insurance / yr
- —
Fire risk No data
- Est. fire insurance / yr
- —
Heat risk No data
- Hot days now (above threshold)
- —
- Hot days in 30 yrs
- —
Wind risk No data
- Chance of severe wind over 30 yrs
- —
Air-quality risk No data
- Unhealthy air days now
- —
- Unhealthy air days in 30 yrs
- —
Risk factors via First Street. Map © Google.
Why this score? — see what drove the B grade
The composite is a weighted blend of 9 inputs, each scored 0–100. Each bar is that input's sub-score; the figure is the points it added to the 100-point composite (weight × sub-score).
- Cash flow +25.9/30.0
- Appreciation +10.0/10.0
- DSCR +8.7/10.0
- ARV discount +7.5/15.0
- 1% rule +6.8/10.0
- Schools +6.5/10.0
- Rent growth +2.5/5.0
- Livability +2.5/5.0
- Condition / age +2.5/5.0
$83,000
🖨 Deal sheet (PDF) 📄 Offer letter ✓ Due diligence
Listing remarks
Affordable opportunity with plenty of potential! This 2-bedroom single-wide home sits on 0.59 acres, offering a peaceful setting on a quiet road. With some updates and repairs, this property could really shine. Ideal for buyers looking to invest or create their own cozy retreat in a serene location. Priced to sell--don't miss out!
Key facts
- 0.59 acre lot
- Garage
- Built 1970
Property features AI
Finance
- Other: Property subtype: Mobile Home
Exterior
- Parking: 1-car garage; Additional parking for 5–10 vehicles on gravel
- Utilities: Private water; Private sewer
- Home design: Mobile home (single wide); Built in 1970; Rural, open, level lot; Lot approximately 0.59 acres; Facing per town zoning
- Construction: Vinyl siding; Metal roof; Mobile construction
- Exterior features: Porch (screened)
Interior
- Kitchen: Refrigerator; Electric range
- Bedrooms: Bedroom 1 on the first floor; Bedroom 2 on the first floor
- Flooring: Laminate and carpet; Carpeted areas
- Bathrooms: 1 full bathroom
- Heating & cooling: Forced air heating; Electric service with circuit breakers
- Interior features: First-floor bedroom; Total of 4 rooms
- Laundry & utility: Electric water heater
Neighborhood map
What this means for you Summary
Snapshot
- This is a 2-bed/1.0-bath other listed at $83k.
Deal economics
- At list price, monthly cash flow is $204 ($2k/yr) — positive.
- The deal already cash-flows at list — no discount required.
- Meets the 1% rule at list price ($978 rent vs $83k).
- Recommended offer: $82k (1.5% below list) — sets the bar for market timing.
Location & tenants
- Location reads: area grade B — affects rentability + tenant quality, not the cash-flow math above.
- RSU 73 (rural): math 75% / reading 81% proficiency, ranked #91 of 112 in ME (top 81%) — strong family-tenant draw, lease renewals of 3-5y typical.
- Market conditions: 31 active listings in the ZIP; 164 units permitted in Franklin County in 2024 (0 in 5+ unit buildings).
Forward outlook
- In year one you build about $9k of equity ($574 loan paydown + $8k appreciation (10.0% local appreciation)).
- Franklin County population projected at -21% by 2050 — secular population decline; favor cash flow + early exit over multi-decade hold.
- At projected returns (10.0% appreciation + 3.0% rent growth), your $23k cash investment doubles in ~2 years — after that, you're playing with house money.
- By year 4, paydown + projected appreciation supports a ~$31k cash-out refi (75% LTV) — recoverable capital for the next deal without selling this one.
Negotiation context
- It's been on market 25 days — a 2% lower offer ($82k) is reasonable based on typical stale-listing flexibility.
- Current owner paid $70k; 19% above their basis — modest negotiation headroom, anchor on the comps not their cost.
Questions for the listing agent
- Built in 1970 — when were the roof, HVAC, electrical panel, plumbing, and water heater last replaced?
- Is there a deadline driving the sale (1031 exchange, divorce, estate, relocation)? That informs how much negotiation room exists.
- What's the average days-on-market for RENTAL listings here right now (not sales)? A rising rental-DOM trend means longer vacancies and softer asking-rent achievability than the comps imply.
- What's the recent tenant-quality profile in this submarket — average credit score on applications, eviction rate, late-payment / NSF rate, and stable-employment percentage? A property-management company in the area should have these aggregated.
- How much new for-sale + rental construction is in the pipeline within 1–3 miles? Heavy new supply typically softens prices + rents 12–24 months out; constrained supply supports both.
Investment metrics
- 1% rule
- 1.18% ✓
- Cap rate
- 9.24%
- Cash-on-cash
- 10.51%
- DSCR
- 1.47
- GRM
- 7.1
CMA / ARV
No comps found within radius.
Projected returns pro-forma
10.0% appreciation · 3.0% rent growth · sell at horizon
- IRR
- 32.0%
- Equity multiple
- 3.50×
- Total profit
- $58,186
- Equity at exit
- $74,773
- IRR
- 27.6%
- Equity multiple
- 7.94×
- Total profit
- $161,171
- Equity at exit
- $161,251
Cash invested: $23,240 (down + closing). Projections, not guarantees.
Landlord ↔ Tenant lean methodology
- Overall (STATE)
- 41 Moderately Tenant-Leaning
- State Maine
- 41 Moderately Tenant-Leaning · D+2
- County
- — inherits STATE
- City
- — inherits STATE
ZIP-level market 04239
- Home prices YoY
- 5.3%
- Active inventory
- 31
- Price-to-rent
- 7.1×
Monthly cashflow live
- Estimated rent
- $978 medium interval (Pro) →
- Mortgage (P&I)
- −$435
- Tax from tax record
- −$99 /mo · $1,185/yr
- Insurance
- −$35
- HOA
- −$0
- Vacancy / Maint / Mgmt
- −$205
- Net cashflow
- $204
Break-even live
Sensitivity live
| Price | -10% $251 | -5% $227 | +0% $204 | +5% $180 | +10% $157 |
|---|---|---|---|---|---|
| Rent | -10% $126 | -5% $165 | +0% $204 | +5% $242 | +10% $281 |
| Rate | -1.0pp $245 | -0.5pp $225 | base $204 | +0.5pp $182 | +1.0pp $160 |
UW: 25.0% down · 7.5% · 30yr · 1.5% tax · 5.0% vac · 8.0% maint · 8.0% mgmt
Financing live
Cash to close
- Down payment
- $20,750
- Closing costs
- $2,490
- Reserves months
- —
- Total cash needed
- —
Loan-product check · same deal, 3 products live
Conventional
25% down · 7.5% · 30yr
- Down + closing
- —
- Monthly P&I
- —
- Monthly cashflow
- —
- DSCR
- —
- Eligible?
- —
Personal DTI + credit; lowest rate.
DSCR
20% down · 8.5% · 30yr
- Down + closing
- —
- Monthly P&I
- —
- Monthly cashflow
- —
- DSCR
- —
- Eligible?
- —
No personal income docs; deal must DSCR.
Hard money
10% down · 12.0% · 12mo
- Down + closing
- —
- Monthly P&I
- —
- Monthly cashflow
- —
- DSCR
- —
- Eligible?
- —
Short-term bridge; refi at stabilization.
Listing history 2 events
-
2026-05-18status Pending 332-char remark
-
2026-04-23$83,000 Active 332-char remark
ⓘ Source: listings_history table (triggers on properties + properties_extension) + one-shot
backfill from property_details.listing_events for pre-trigger history.
Tax reassessment forecast ME · Partial reset (capped growth)
- Current annual tax
- $1,185 · $99/mo
- Projected year-2 tax
- $1,185 · $99/mo
- Expected delta
- $0/yr ($0/mo · 0.0%)
ⓘ Screening estimate from a state-policy table — verify with the county assessor before closing.
Nearby sold comps map
Loading sold comps map…
Walkable amenities ~0.75 mi
Loading nearby amenities…
Taxation est. · year 1
- Rental income
- $11,730
- − Mortgage interest
- −$4,649
- − Property taxes
- −$1,185
- − Insurance
- −$415
- − Repairs & maintenance
- −$938
- − Management
- −$938
- − Depreciation
- −$2,415
- Taxable income
- $1,189
- Est. tax owed @ 24.0%
- −$285
- After-tax cash flow
- $2,158/yr
For passive investors: Depreciation is non-cash, so a rental often shows a tax loss while cash-flowing — sheltering income. Rental losses are passive: they offset passive income freely, and up to $25,000/yr can offset ordinary (W-2) income if you actively participate and your MAGI is under $100k (phasing out to $0 by $150k); unused losses carry forward. On sale, claimed depreciation is recaptured at up to 25%, and gains may owe capital-gains tax (a 1031 exchange can defer both). Figures are a year-1 estimate at your 24.0% rate — not tax advice; consult a CPA.
Schools (NCES district)
- District
- RSU 73
- NCES district ID
- 2314805
- Math proficiency
- 75% ▲ 50.00%
- Reading proficiency
- 81% ▲ 38.00%
- Median HH income
- $44,547
- Composite
- 65.46/100
- National rank
- #477
- State rank
- #91 of 112 in ME
Livability — Jay
No livability data for this city. (Only ~50 U.S. cities are tracked.)
Census & demographics
- Population (ZIP)
- 4,644
Population outlook (Franklin County) Hauer SSP2
- Today (2025)
- 28,948 people
- By 2030
- 27,889 · -3.7%
- By 2040
- 25,275 · -12.7%
- By 2050
- 22,770 · -21.3%
- By 2075
- 18,980 · -34.4%
- By 2100
- 16,816 · -41.9%
Race, ethnicity, and origin ACS 2023
- Neighborhood character
- Predominantly White (95%)
- Race & ethnicity
- White 95% Two or more races 4% Asian 2%
- Common ancestry
- Lithuanian 10% Italian 4% German 2%
- Foreign-born
- 3% · Canada
- Languages at home
- 97% English-only · French/Haitian/Cajun 2% Tagalog/Filipino 1%
Political lean MEDSL · Franklin
- 2024 margin
- Lean R (+8.2) · D 44.8% · R 53.0% · Other 2.2%
- 2008→2024 swing
- -28.5pp toward R · 2008: 20.3pp · 2024: -8.2pp
- All cycles
- 2024: R+8.2 2020: R+3.9 2016: R+5.5 2012: D+18.5 2008: D+20.3
Not yet ingested
- Civics
- —
Market trends
- HPI YoY
- ▲ 14.17%
- Current HPI
- 279.4231
- Rent YoY
- —
- Metro
- —
- State GDP YoY
- —
- F500 in state
- 0
Price history
-15.7% since first listed3 events — show timeline
- 2026-06-02 Sold (MLS) $70,000 MREIS
- 2026-05-18 Pending — MREIS
- 2026-04-23 Listed $83,000 MREIS
Property tax history
+3.5%/yrLatest (2025): $1,185 · +4.0% YoY. Source: county tax records.
Cash-flow waterfall
monthlySold comps — $/sqft
last 12 mo · ≤1 miLoading sold comps…