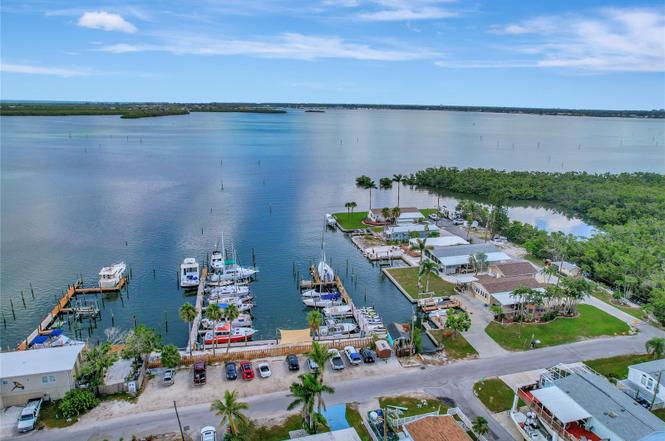
3705 116th Street Ct W · Cortez, FL
Flood risk 10/10 · Severe
- FEMA flood zone
- AE
- Chance of flooding over 30 yrs
- 0.99%
- Est. flood insurance / yr
- $1,737 – $8,500
Fire risk 1/10 · Minimal
- Est. fire insurance / yr
- $947 – $1,759
Heat risk 10/10 · Severe
- Hot days now (above 106°F)
- 7 days/yr
- Hot days in 30 yrs
- 29 days/yr
Wind risk 10/10 · Severe
- Chance of severe wind over 30 yrs
- 99.0%
Air-quality risk 3/10 · Minor
- Unhealthy air days now
- 2 days/yr
- Unhealthy air days in 30 yrs
- 2 days/yr
Risk factors via First Street. Map © Google.
Why this score? — see what drove the D grade
The composite is a weighted blend of 9 inputs, each scored 0–100. Each bar is that input's sub-score; the figure is the points it added to the 100-point composite (weight × sub-score).
- Cash flow +16.4/30.0
- ARV discount +7.5/15.0
- DSCR +5.1/10.0
- Schools +4.4/10.0
- 1% rule +3.7/10.0
- Livability +3.5/5.0
- Condition / age +2.5/5.0
- Rent growth +1.0/5.0
- Appreciation +0.0/10.0
$195,000
🖨 Deal sheet (PDF) 📄 Offer letter ✓ Due diligence
Listing remarks
$5,000 BUYER CREDIT OF CHOICE WITH EXECUTED CONTRACT! Investor Alert - Prime Opportunity Near Anna Maria Island! Calling all savvy real estate investors - Here is your chance to OWN LAND in the sought-after SUNNY SHORES community of Bradenton, just minutes from the turquoise waters of Anna Maria Island. Located right off Palma Sola Bay, with Sunny Shores Park and the Parrot Cove Marina boat ramp in your backyard, this property is all about location, flexibility, and potential. This fully remediated over 1,400 sq ft home offers a solid foundation for your next investment project, featuring: Two additional enclosed living areas for added versatility, a NEW Shingle Roof (2025), a NEW A/C (2025
Key facts
- Clubhouse
- New a/c
- New electrical
Tags
Property features AI
Finance
- Other: Lot about 0.07 acres (approx. 53 x 55) on asphalt road; Living area 1,441 sq ft; building area 1,938 sq ft; Total rooms: 8; Bonus room; Pet policy: breed restrictions
- HOA & community: Has HOA (optional fee); HOA fee $100 annually ($8.33/month)
Exterior
- Utilities: Public water; Public sewer; Cable available; Electricity connected
- Home design: Residential mobile home (double wide); One story; Faces south
- Construction: Frame construction; Metal roof; Built as a double wide mobile home
- Exterior features: Private mailbox; Storage
Interior
- Kitchen: Microwave; Electric water heater
- Bedrooms: 2 bedrooms
- Flooring: Other flooring
- Bathrooms: 2 full bathrooms
- Heating & cooling: Central heating; Central air conditioning
- Interior features: Ceiling fans; Open floor plan; Split bedroom layout; Thermostat
- Laundry & utility: Laundry room with electric dryer hookup
Neighborhood map
What this means for you Summary
Snapshot
- This is a 1-bed/1.0-bath manufactured listed at $195k.
Deal economics
- At list price, monthly cash flow is $-315 ($-4k/yr) — negative.
- To cash-flow at today's rent, offer at most $139k (28.6% below list).
- To meet the 1% rule (rent ≥ 1% of price), the offer needs to be $170k (12.7% below list).
- Recommended offer: $139k (28.6% below list) — sets the bar for cash-flow.
- Cap rate 7.0% vs local median 1.8% in Cortez — top-decile yield for the area; either an underpriced asset or a hidden risk that comps aren't pricing in. Stress-test before assuming the spread holds.
Location & tenants
- Location reads 69/100 on livability (#486 in FL) — a middle-class / working-renter tenant base. Strengths: crime A+, commute A+, housing A+; Watch: cost of living C-, amenities F, health & safety F.
- Manatee (suburban): math 54% / reading 50% proficiency, ranked #26 of 73 in FL (top 36%) — acceptable for families but not a draw, mixed tenant base, ~2y average lease.
- Zoned schools: Sea Breeze Elementary School (math 48% / reading 43%, grade D-, #1,247 of 2,144 statewide, top 59%, 499 students, 74% FRL); W. D. Sugg Middle School (math 34% / reading 28%, grade F, #462 of 571 statewide, top 81%, 1,010 students, 72% FRL); Bayshore High School (math 17% / reading 26%, grade F, #546 of 667 statewide, top 82%, 1,435 students, 65% FRL) — zoned schools average 70% FRL vs 51% district-wide (20 pts higher); higher-poverty schools than district average — tighter screening recommended.
- Zoned-school proficiency averages 33% at this address vs 52% district-wide (-19 pts) — the specific schools serving this property underperform the Manatee average; the district grade overstates school quality for this exact location.
- Market conditions: Rents falling (-6.1%/yr); 557 active listings in the ZIP; 17 comparable units currently listed for rent nearby; rentals at typical pace (median 26d on market — plan ~3-4 weeks tenant-placement turnaround); 7,472 units permitted in Manatee County in 2024 (1,782 in 5+ unit buildings).
Forward outlook
- Local home prices are declining (-3.0%/yr); year-one equity from $1k of loan paydown is wiped out by about $6k of value loss. Plan a longer hold.
- Manatee County population projected at +43% by 2050 — long-run rental-demand tailwind backs the buy-and-hold thesis.
Negotiation context
- It's been on market 319 days — a 12% lower offer ($172k) is reasonable based on typical stale-listing flexibility.
- 3 sale attempts since 2y ago with the ask held roughly flat each time — persistent listings suggest the price (not the market) is what's stuck; bring a comps-based counter.
- Current owner paid $55k; list at $195k implies a 255% gain — meaningful room to come down on a strong offer.
Risks & watch-outs
- Watch-outs: flood insurance adds $427/mo.
- Climate carrying-cost: in FEMA flood zone AE (mandatory federal flood insurance); severe wind risk, 99% chance of damaging wind over 30y; extreme-heat days projected 7→29/yr by 2055 (HVAC capex compounding) — expect insurance premiums to compound above CPI over the hold.
Questions for the listing agent
- What do current leases actually rent for vs. the listed asking? Can we see a recent rent roll and the last 12 months of T-12 income?
- It's been on market 319 days. Have you received any prior offers? Is the seller open to a 29% concession, seller financing, or rate buy-down credit?
- Built in 1972 — when were the roof, HVAC, electrical panel, plumbing, and water heater last replaced?
- What's the actual annual flood-insurance premium (NFIP or private), and is the property in a SFHA with mandatory coverage?
- What does the HOA fee cover, when was the last increase, and are there any pending special assessments or reserve-fund shortfalls?
- Why hasn't it sold? Are there any deal-killer items the seller is aware of (foundation, flood, title, zoning, code violations)?
- Is there a deadline driving the sale (1031 exchange, divorce, estate, relocation)? That informs how much negotiation room exists.
- Schools are D-rated, which usually means shorter tenancies and higher turnover. Who's the typical renter profile here, and what's been the actual vacancy rate?
- The area grade is low — what's the realistic commute time and amenity access for the typical tenant pool here? Any planned neighborhood developments (good or bad) we should know about?
- What's the average days-on-market for RENTAL listings here right now (not sales)? A rising rental-DOM trend means longer vacancies and softer asking-rent achievability than the comps imply.
- What's the recent tenant-quality profile in this submarket — average credit score on applications, eviction rate, late-payment / NSF rate, and stable-employment percentage? A property-management company in the area should have these aggregated.
- How much new for-sale + rental construction is in the pipeline within 1–3 miles? Heavy new supply typically softens prices + rents 12–24 months out; constrained supply supports both.
Investment metrics
- 1% rule
- 0.87% ✗
- Cap rate
- 6.98%
- Cash-on-cash
- 2.45%
- DSCR
- 1.11
- GRM
- 9.5
CMA / ARV
No comps found within radius.
Projected returns pro-forma
-3.0% appreciation · 0.0% rent growth · sell at horizon
- IRR
- -32.6%
- Equity multiple
- -0.03×
- Total profit
- $-56,446
- Equity at exit
- $29,075
- IRR
- -67.7%
- Equity multiple
- -0.71×
- Total profit
- $-93,399
- Equity at exit
- $16,860
Cash invested: $54,600 (down + closing). Projections, not guarantees.
Landlord ↔ Tenant lean methodology
- Overall (STATE)
- 87 Strongly Landlord-Friendly
- State Florida
- 87 Strongly Landlord-Friendly · R+3
- County
- — inherits STATE
- City
- — inherits STATE
ZIP-level market 34210
- Rents YoY
- -6.1%
- Active inventory
- 557
- Price-to-rent
- 9.5×
Monthly cashflow live
- Estimated rent
- $1,702 high interval (Pro) →
- Mortgage (P&I)
- −$1,023
- Tax from tax record
- −$122 /mo · $1,458/yr
- Insurance
- −$81
- Flood insurance flood zone
- −$427 /mo · $5,118/yr
- HOA
- −$8
- Lot rent leased land?
- −$0
- Vacancy / Maint / Mgmt
- −$357
- Net cashflow
- $-315
Break-even live
Sensitivity live
| Price | -10% $-205 | -5% $-260 | +0% $-315 | +5% $-370 | +10% $-426 |
|---|---|---|---|---|---|
| Rent | -10% $-450 | -5% $-382 | +0% $-315 | +5% $-248 | +10% $-181 |
| Rate | -1.0pp $-217 | -0.5pp $-266 | base $-315 | +0.5pp $-366 | +1.0pp $-417 |
UW: 25.0% down · 7.5% · 30yr · 1.5% tax · 5.0% vac · 8.0% maint · 8.0% mgmt
Financing live
Cash to close
- Down payment
- $48,750
- Closing costs
- $5,850
- Reserves months
- —
- Total cash needed
- —
Loan-product check · same deal, 3 products live
Conventional
25% down · 7.5% · 30yr
- Down + closing
- —
- Monthly P&I
- —
- Monthly cashflow
- —
- DSCR
- —
- Eligible?
- —
Personal DTI + credit; lowest rate.
DSCR
20% down · 8.5% · 30yr
- Down + closing
- —
- Monthly P&I
- —
- Monthly cashflow
- —
- DSCR
- —
- Eligible?
- —
No personal income docs; deal must DSCR.
Hard money
10% down · 12.0% · 12mo
- Down + closing
- —
- Monthly P&I
- —
- Monthly cashflow
- —
- DSCR
- —
- Eligible?
- —
Short-term bridge; refi at stabilization.
Rent comps 17 comps
| Address | Beds | Baths | Sqft | Rent | $/sqft | DOM | Units | Dist |
|---|---|---|---|---|---|---|---|---|
| 12112 44th Ave W Unit 1545997P Cortez, FL | 2.0 | 2.0 | 1216 | $1,613 | $1.33 | 16d | 1 | 0.62mi |
| 4311 126th St W Cortez, FL | 2.0 | 2.0 | 864 | $3,850 | $4.46 | 26d | 1 | 0.87mi |
| 1155 Edgewater Cir #28 Bradenton, FL | 2.0 | 2.0 | 1486 | $2,500 | $1.68 | 26d | 1 | 0.93mi |
| 971 Waterside Ln Bradenton, FL | 2.0 | 2.0 | 1069 | $6,000 | $5.61 | 26d | 1 | 0.99mi |
| 1318 Perico Point Cir Bradenton, FL | 2.0 | 2.0 | 1272 | $5,500 | $4.32 | 26d | 1 | 1.07mi |
| 1233 Spoonbill Landings Cir Unit NA Bradenton, FL | 2.0 | 2.0 | 1272 | $2,500 | $1.97 | 18d | 1 | 1.09mi |
| 4607 103rd Street Ct W Bradenton, FL | 2.0 | 2.0 | 930 | $2,100 | $2.26 | 13d | 1 | 1.12mi |
| 1216 Spoonbill Landings Cir Bradenton, FL | 2.0 | 2.0 | 1334 | $2,500 | $1.87 | 26d | 1 | 1.14mi |
| 9819 Hernando Ct Unit 29-A Bradenton, FL | 2.0 | 2.0 | 1078 | $2,500 | $2.32 | 26d | 1 | 1.17mi |
| 4518 102nd St W Bradenton, FL | 2.0 | 1.0 | 850 | $1,395 | $1.64 | 26d | 1 | 1.19mi |
| 922 Sandpiper Cir Bradenton, FL | 2.0 | 2.0 | 1096 | $3,500 | $3.19 | 26d | 1 | 1.20mi |
| 958 Sandpiper Cir #958 Bradenton, FL | 2.0 | 2.0 | 1096 | $4,300 | $3.92 | 5d | 1 | 1.25mi |
| 831 Audubon Dr Unit 831 Bradenton, FL | 2.0 | 2.0 | 1185 | $2,400 | $2.03 | 26d | 1 | 1.27mi |
| 614 Estuary Dr #614 Bradenton, FL | 2.0 | 2.0 | 1486 | $2,900 | $1.95 | 26d | 1 | 1.43mi |
| 11001 Bristol Bay Dr Bradenton, FL | 1.0–2.0 | 1.0–2.0 | 928 | $1,265 | $1.36 | 4d | 16 | 1.47mi |
| 517 Woodstork Cir Bradenton, FL | 2.0 | 2.0 | 1368 | $2,500 | $1.83 | 18d | 1 | 1.47mi |
| 708 Estuary Dr #708 Bradenton, FL | 2.0 | 2.0 | 1334 | $2,350 | $1.76 | 18d | 1 | 1.49mi |
HOA detail
- Monthly dues
- $8 · $96/yr
- Likely covers
- water
Listing history 25 events
-
2026-06-22days on market $195,000 Active 319 DOM
-
2026-06-22days on market $195,000 Active 318 DOM
-
2026-06-18days on market $195,000 Active 315 DOM
-
2026-06-17days on market $195,000 Active 314 DOM
-
2026-06-16days on market $195,000 Active 313 DOM
-
2026-06-15days on market $195,000 Active 312 DOM
-
2026-06-13days on market $195,000 Active 310 DOM
-
2026-06-13days on market $195,000 Active 309 DOM
-
2026-06-10days on market $195,000 Active 307 DOM
-
2026-06-09days on market $195,000 Active 306 DOM
-
2026-06-08days on market $195,000 Active 305 DOM
-
2026-06-08days on market $195,000 Active 304 DOM
-
2026-06-03days on market $195,000 Active 300 DOM
-
2026-06-02days on market $195,000 Active 299 DOM
-
2026-06-01days on market $195,000 Active 298 DOM
-
2026-05-31days on market $195,000 Active 297 DOM
-
2026-03-24status Active
-
2026-03-24status Pending
-
2025-08-07$195,000 Active
-
2024-09-18historical
-
2024-09-11price $265,000
-
2024-07-23price $284,500
-
2024-06-18$289,000 Active
-
1997-04-08soldstatus $55,000
-
1980-09-01soldstatus $37,900
ⓘ Source: listings_history table (triggers on properties + properties_extension) + one-shot
backfill from property_details.listing_events for pre-trigger history.
Tax reassessment forecast FL · Resets to sale price
- Current annual tax
- $1,458 · $122/mo
- Projected year-2 tax
- $1,618 · $135/mo
- Expected delta
- +$160/yr (+$13/mo · 11.0%)
ⓘ Screening estimate from a state-policy table — verify with the county assessor before closing.
Climate risk First Street
- Flood 10/10 Extreme FEMA zone AE · 99% chance over 30 yrs
- Wildfire 1/10 Low
- Heat 10/10 Extreme 7 d/yr ≥106°F today · 29 d/yr by 30 yrs out
- Wind 10/10 Extreme 99% chance of damaging wind over 30 yrs
- Air quality 3/10 Moderate 2 unhealthy d/yr today · 2 by 30 yrs out
Nearby sold comps map
Loading sold comps map…
Walkable amenities ~0.75 mi
Loading nearby amenities…
Taxation est. · year 1
- Rental income
- $20,425
- − Mortgage interest
- −$10,923
- − Property taxes
- −$1,458
- − Insurance
- −$6,094
- − Repairs & maintenance
- −$1,634
- − Management
- −$1,634
- − HOA
- −$96
- − Depreciation
- −$5,673
- Taxable loss
- −$7,086
- Est. tax savings @ 24.0%
- +$1,701
- After-tax cash flow
- $-2,082/yr
For passive investors: Depreciation is non-cash, so a rental often shows a tax loss while cash-flowing — sheltering income. Rental losses are passive: they offset passive income freely, and up to $25,000/yr can offset ordinary (W-2) income if you actively participate and your MAGI is under $100k (phasing out to $0 by $150k); unused losses carry forward. On sale, claimed depreciation is recaptured at up to 25%, and gains may owe capital-gains tax (a 1031 exchange can defer both). Figures are a year-1 estimate at your 24.0% rate — not tax advice; consult a CPA.
Schools (NCES district)
- District
- Manatee
- NCES district ID
- 1201230
- Math proficiency
- 54% ▼ -6.00%
- Reading proficiency
- 50% ▼ -2.00%
- Median HH income
- $49,607
- Composite
- 44.43/100
- National rank
- #2806
- State rank
- #26 of 73 in FL
Livability — Cortez
- Score
- 69/100
- State rank
- #486
- US rank
- #8944
Category grades
Schools grade is shown separately in the Schools card above.
Census & demographics
- Census place
- Cortez, FL
- County
- Manatee County · 416,364 people
- City population
- 759
- Metro
- North Port-Sarasota-Bradenton, FL
- Population (ZIP)
- 17,682
- Household income
- $64,244
- Rent vs Own
- Severe rent burden
- 895.0
Population outlook (Manatee County) Hauer SSP2
- Today (2025)
- 447,342 people
- By 2030
- 488,911 · +9.3%
- By 2040
- 567,934 · +27.0%
- By 2050
- 637,995 · +42.6%
- By 2075
- 781,970 · +74.8%
- By 2100
- 848,272 · +89.6%
Race, ethnicity, and origin ACS 2023
- Neighborhood character
- Predominantly White (68%)
- Race & ethnicity
- White 68% Hispanic / Latino 20% Black 8% Two or more races 7% Asian 2%
- Hispanic origin (detail)
- Mexican 4% Puerto Rican 3% Cuban 7%
- Common ancestry
- Hispanic 4% Romanian 3% Lithuanian 3%
- Foreign-born
- 17% · Canada, China, Jamaica
- Languages at home
- 76% English-only · Spanish 15% French/Haitian/Cajun 4% Other Indo-European 1%
Political lean MEDSL · Manatee
- 2024 margin
- Strong R (+23.5) · D 37.9% · R 61.4%
- 2008→2024 swing
- -16.5pp toward R · 2008: -7.0pp · 2024: -23.5pp
- All cycles
- 2024: R+23.5 2020: R+16.1 2016: R+17.1 2012: R+12.5 2008: R+7.0
Not yet ingested
- Civics
- —
Market trends
- HPI YoY
- ▼ -162.68%
- Current HPI
- 246.9247
- Rent YoY
- ▼ -6.08%
- Metro
- North Port-Sarasota-Bradenton, FL
- State GDP YoY
- ▲ 3.28%
- F500 in state
- 36
Industry mix (Fortune 500 HQ in FL)
| Industry | F500 HQs | Revenue |
|---|---|---|
| Industrial Technology | 2 | $29B |
|
||
| Insurance | 2 | $17B |
|
||
| Retail | 1 | $60B |
|
||
| Technology Distribution | 1 | $58B |
|
||
| Homebuilding | 1 | $35B |
|
||
| Technology Manufacturing | 1 | $35B |
|
||
Price history
+414.5% since first listed9 events — show timeline
- 2026-03-24 Relisted — Stellar MLS as Distributed by MLS Grid
- 2026-03-24 Pending — Stellar MLS as Distributed by MLS Grid
- 2025-08-07 Listed $195,000 Stellar MLS as Distributed by MLS Grid
- 2024-09-18 Listing Removed — Stellar MLS as Distributed by MLS Grid
- 2024-09-11 Price Changed $265,000 Stellar MLS as Distributed by MLS Grid
- 2024-07-23 Price Changed $284,500 Stellar MLS as Distributed by MLS Grid
- 2024-06-18 Listed $289,000 Stellar MLS as Distributed by MLS Grid
- 1997-04-08 Sold (Public Records) $55,000 Public Records
- 1980-09-01 Sold (Public Records) $37,900 Public Records
Property tax history
+7.3%/yrLatest (2025): $1,458 · +100.6% YoY. Source: county tax records.
Cash-flow waterfall
monthlySold comps — $/sqft
last 12 mo · ≤1 miLoading sold comps…