2526 63rd St · Lubbock, TX
Flood risk 1/10 · Minimal
- FEMA flood zone
- X (unshaded)
- Chance of flooding over 30 yrs
- 0.0%
- Est. flood insurance / yr
- $507 – $1,088
Fire risk 1/10 · Minimal
- Est. fire insurance / yr
- $1,222 – $2,270
Heat risk 5/10 · Moderate
- Hot days now (above 99°F)
- 7 days/yr
- Hot days in 30 yrs
- 21 days/yr
Wind risk 2/10 · Minimal
- Chance of severe wind over 30 yrs
- —
Air-quality risk 2/10 · Minimal
- Unhealthy air days now
- 1 days/yr
- Unhealthy air days in 30 yrs
- 1 days/yr
Risk factors via First Street. Map © Google.
Why this score? — see what drove the C- grade
The composite is a weighted blend of 9 inputs, each scored 0–100. Each bar is that input's sub-score; the figure is the points it added to the 100-point composite (weight × sub-score).
- Cash flow +16.2/30.0
- ARV discount +13.9/15.0
- DSCR +5.0/10.0
- 1% rule +4.7/10.0
- Livability +4.0/5.0
- Schools +3.1/10.0
- Rent growth +3.0/5.0
- Condition / age +2.5/5.0
- Appreciation +0.0/10.0
$125,000
🖨 Deal sheet 📄 Offer letter ✓ Due diligence
Listing remarks MLS
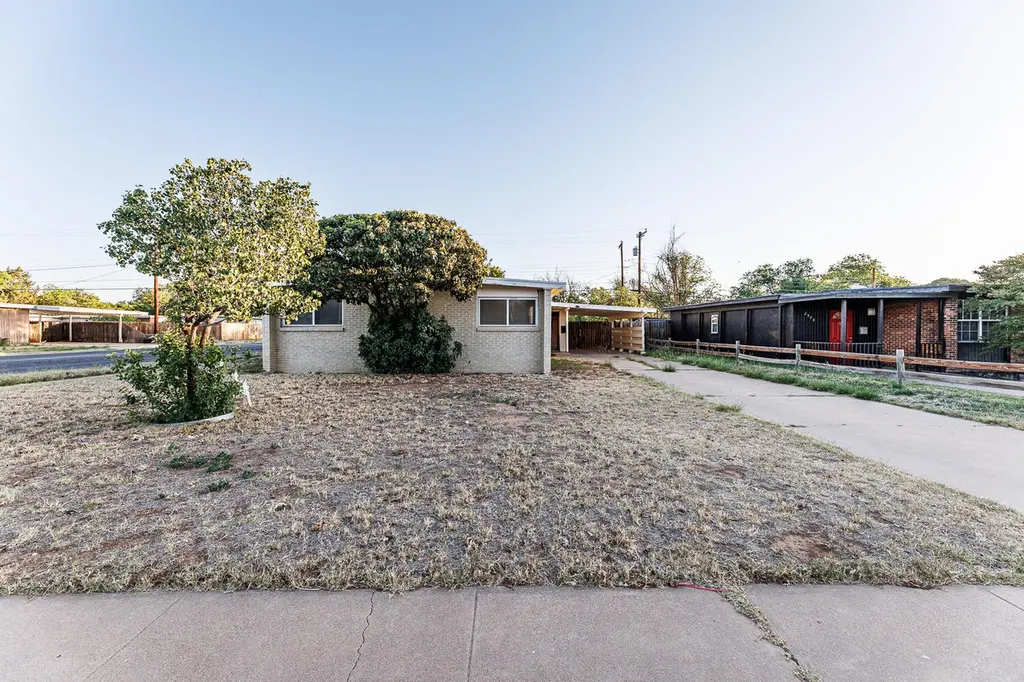
A brick home with two bedrooms, two baths and two living areas on a corner lot.
Key facts
- Flexible floor plan
- Two living areas
- Bonus space
Tags
Property features AI
Finance
- Other: Property listed by Lubbock Homestead Realty Group
Exterior
- Parking: Attached carport; Additional parking
- Utilities: Gas water heater
- Home design: Single-family residence; Residential property
- Construction: Brick and wood siding exterior; Composition roof; Slab foundation; Built area above grade: 1,278
- Exterior features: Storage; Shed(s); Fenced backyard; Corner lot; Paved road access
Interior
- Kitchen: Free-standing gas range; Microwave; Refrigerator; Gas water heater
- Bedrooms: 6 total rooms (bedroom count not specified)
- Flooring: Carpet; Tile
- Bathrooms: 2 full bathrooms
- Heating & cooling: Central heating; Central air conditioning
- Interior features: Beamed ceilings; Window coverings
- Laundry & utility: Laundry area in the kitchen
Neighborhood map
What this means for you Summary
Snapshot
- This is a 2-bed/2.0-bath single-family listed at $125k.
Deal economics
- At list price, monthly cash flow is $66 ($798/yr) — positive.
- The deal already cash-flows at list — no discount required.
- To meet the 1% rule (rent ≥ 1% of price), the offer needs to be $121k (2.9% below list).
- Recommended offer: $121k (2.9% below list) — sets the bar for 1% rule.
Location & tenants
- Location reads 80/100 on livability (#37 in TX, #1,749 nationally) — a professional / high-income tenant draw. Strengths: commute A+, cost of living A+, housing A+; Watch: employment C-, schools D+, crime F.
- Lubbock ISD (urban): math 36% / reading 39% proficiency, ranked #481 of 826 in TX (top 58%) — families likely to look elsewhere, expect single-tenant / working-renter base with shorter leases; 60% free/reduced lunch — lower-income household profile, screen leases tightly.
- Market conditions: Rents rising (+1.9%/yr); 183 active listings in the ZIP; 40 comparable units currently listed for rent nearby; rentals at typical pace (median 21d on market — plan ~3-4 weeks tenant-placement turnaround); 45% of comp listings sitting > 30 days — soft ceiling on asking rent; 2,219 units permitted in Lubbock County in 2024 (252 in 5+ unit buildings).
Forward outlook
- Local home prices are declining (-3.0%/yr); year-one equity from $864 of loan paydown is wiped out by about $4k of value loss. Plan a longer hold.
- Lubbock County population projected at +39% by 2050 — long-run rental-demand tailwind backs the buy-and-hold thesis.
Negotiation context
- It's been on market 22 days — a 2% lower offer ($123k) is reasonable based on typical stale-listing flexibility.
- 3 sale attempts since 10y ago with the ask held roughly flat each time — persistent listings suggest the price (not the market) is what's stuck; bring a comps-based counter.
Risks & watch-outs
- Watch-outs: built in 1958 — expect roof / HVAC / electrical / plumbing capex.
- Climate carrying-cost: extreme-heat days projected 7→21/yr by 2055 (HVAC capex compounding) — expect insurance premiums to compound above CPI over the hold.
Questions for the listing agent
- Built in 1958 — when were the roof, HVAC, electrical panel, plumbing, and water heater last replaced?
- Is there a deadline driving the sale (1031 exchange, divorce, estate, relocation)? That informs how much negotiation room exists.
- Schools are D-rated, which usually means shorter tenancies and higher turnover. Who's the typical renter profile here, and what's been the actual vacancy rate?
- Crime grade is F in this area — have there been break-ins, vandalism, or insurance claims at this property in the last 3 years? What carrier currently insures it and at what premium?
- What's the average days-on-market for RENTAL listings here right now (not sales)? A rising rental-DOM trend means longer vacancies and softer asking-rent achievability than the comps imply.
- What's the recent tenant-quality profile in this submarket — average credit score on applications, eviction rate, late-payment / NSF rate, and stable-employment percentage? A property-management company in the area should have these aggregated.
- How much new for-sale + rental construction is in the pipeline within 1–3 miles? Heavy new supply typically softens prices + rents 12–24 months out; constrained supply supports both.
Investment metrics
- 1% rule
- 0.97% ✗
- Cap rate
- 6.93%
- Cash-on-cash
- 2.28%
- DSCR
- 1.10
- GRM
- 8.6
CMA / ARV
- ARV (median comp)
- $145,769
- List price
- $125,000
- Delta
- -14.25%
- Verdict
- UNDERPRICED
- Comps
- 6 within 2.0 mi
Projected returns pro-forma
-3.0% appreciation · 1.94% rent growth · sell at horizon
- IRR
- -13.9%
- Equity multiple
- 0.51×
- Total profit
- $-17,265
- Equity at exit
- $18,638
- IRR
- -6.9%
- Equity multiple
- 0.58×
- Total profit
- $-14,581
- Equity at exit
- $10,808
Cash invested: $35,000 (down + closing). Projections, not guarantees.
Landlord ↔ Tenant lean methodology
- Overall (STATE)
- 87 Strongly Landlord-Friendly
- State Texas
- 87 Strongly Landlord-Friendly · R+5
- County
- — inherits STATE
- City
- — inherits STATE
ZIP-level market 79413
- Rents YoY
- 1.9%
- Active inventory
- 183
- Price-to-rent
- 8.6×
Monthly cashflow live
- Estimated rent
- $1,213 high interval (Pro) →
- Mortgage (P&I)
- −$656
- Tax from tax record
- −$185 /mo · $2,214/yr
- Insurance
- −$52
- HOA
- −$0
- Vacancy / Maint / Mgmt
- −$255
- Net cashflow
- $66
Break-even live
UW: 25.0% down · 7.5% · 30yr · 1.5% tax · 5.0% vac · 8.0% maint · 8.0% mgmt
Financing live
Cash to close
- Down payment
- $31,250
- Closing costs
- $3,750
- Reserves months
- —
- Total cash needed
- —
Loan-product check · same deal, 3 products live
Conventional
25% down · 7.5% · 30yr
- Down + closing
- —
- Monthly P&I
- —
- Monthly cashflow
- —
- DSCR
- —
- Eligible?
- —
Personal DTI + credit; lowest rate.
DSCR
20% down · 8.5% · 30yr
- Down + closing
- —
- Monthly P&I
- —
- Monthly cashflow
- —
- DSCR
- —
- Eligible?
- —
No personal income docs; deal must DSCR.
Hard money
10% down · 12.0% · 12mo
- Down + closing
- —
- Monthly P&I
- —
- Monthly cashflow
- —
- DSCR
- —
- Eligible?
- —
Short-term bridge; refi at stabilization.
Rent comps 40 comps
| Address | Beds | Baths | Sqft | Rent | $/sqft | DOM | Units | Dist |
|---|---|---|---|---|---|---|---|---|
| 2707 63rd St Lubbock, TX | 3.0 | 1.0 | 1080 | $1,050 | $0.97 | 13d | 1 | 0.07mi |
| 2725 63rd St Unit FS Lubbock, TX | 3.0 | 2.0 | 1624 | $1,599 | $0.98 | 43d | 1 | 0.18mi |
| 2817 63rd St Lubbock, TX | 3.0 | 1.0 | 1125 | $1,250 | $1.11 | 21d | 1 | 0.29mi |
| 2821 61st St Lubbock, TX | 3.0 | 1.0 | 1230 | $1,100 | $0.89 | 43d | 1 | 0.33mi |
| 2827 66th St Lubbock, TX | 3.0 | 1.0 | 1190 | $1,200 | $1.01 | 21d | 1 | 0.35mi |
| 2823 54th St Lubbock, TX | 3.0 | 2.0 | 1725 | $1,825 | $1.06 | 43d | 1 | 0.63mi |
| 6914 Fremont Ave Unit A Lubbock, TX | 2.0 | 1.0 | 1020 | $995 | $0.98 | 43d | 1 | 0.73mi |
| 3236 63rd St Lubbock, TX | 3.0 | 2.5 | 1818 | $1,524 | $0.84 | 13d | 1 | 0.74mi |
| 6911 Gary Ave Unit A Lubbock, TX | 3.0 | 2.0 | 1154 | $1,125 | $0.97 | 43d | 1 | 0.74mi |
| 2401 73rd St Unit 14 Lubbock, TX | 2.0 | 2.0 | 950 | $800 | $0.84 | 13d | 1 | 0.76mi |
| 7304 Avenue W Lubbock, TX | 3.0 | 2.0 | 1500 | $999 | $0.67 | 13d | 1 | 0.77mi |
| 6711 Hartford Ave Unit A Lubbock, TX | 2.0 | 1.5 | 1165 | $975 | $0.84 | 43d | 1 | 0.78mi |
| 7404 W Avenue Unit A Lubbock, TX | 2.0 | 1.0 | 950 | $825 | $0.87 | 43d | 1 | 0.80mi |
| 2128 74th St Lubbock, TX | 3.0 | 2.5 | 1132 | $1,350 | $1.19 | 21d | 1 | 0.81mi |
| 7414 Elgin Ave Lubbock, TX | 1.0–2.0 | 1.0 | 708 | $995 | $1.41 | 13d | 16 | 0.81mi |
| 2113 South Loop 289 Unit B Lubbock, TX | 2.0 | 1.0 | 950 | $900 | $0.95 | 13d | 1 | 0.81mi |
| 2113 S Loop 289 Lubbock, TX | 2.0 | 1.0 | 1000 | $849 | $0.85 | 43d | 1 | 0.81mi |
| 7406 Waco Ave Unit C Lubbock, TX | 2.0 | 1.0 | 1831 | $750 | $0.41 | 43d | 1 | 0.83mi |
| 2105 South Loop 289 Unit A Lubbock, TX | 2.0 | 1.0 | 962 | $950 | $0.99 | 13d | 1 | 0.84mi |
| 3107 75th St Unit B Lubbock, TX | 2.0 | 2.0 | 1400 | $1,250 | $0.89 | 21d | 1 | 0.96mi |
| 6518 Avenue S Lubbock, TX | 2.0 | 1.0 | 990 | $700 | $0.71 | 21d | 1 | 0.96mi |
| 2101 51st St Lubbock, TX | 2.0 | 1.5 | 1100 | $900 | $0.82 | 21d | 1 | 0.96mi |
| 2315 48th St Lubbock, TX | 3.0 | 1.0 | 1014 | $1,350 | $1.33 | 21d | 1 | 0.97mi |
| 1921 S Loop 289 Lubbock, TX | 3.0 | 2.0 | 1121 | $1,100 | $0.98 | 43d | 1 | 1.00mi |
| 1940 77th St Lubbock, TX | 3.0 | 2.0 | 1700 | $1,500 | $0.88 | 43d | 1 | 1.04mi |
| 2316 47th St Lubbock, TX | 3.0 | 2.0 | 1285 | $1,400 | $1.09 | 21d | 1 | 1.06mi |
| 1923 76th St Lubbock, TX | 3.0 | 2.0 | 1622 | $1,699 | $1.05 | 43d | 1 | 1.08mi |
| 3006 47th St Lubbock, TX | 3.0 | 1.0 | 1016 | $1,150 | $1.13 | 21d | 1 | 1.09mi |
| 3019 47th St Lubbock, TX | 3.0 | 2.0 | 1298 | $1,400 | $1.08 | 21d | 1 | 1.09mi |
| 1618 58th St Unit B Lubbock, TX | 2.0 | 1.0 | 952 | $950 | $1.00 | 43d | 1 | 1.10mi |
| 2412 46th St Apt A Lubbock, TX | 2.0 | 1.0 | 945 | $795 | $0.84 | 21d | 1 | 1.10mi |
| 2612 81st St Unit B Lubbock, TX | 2.0 | 2.0 | 1150 | $1,100 | $0.96 | 43d | 1 | 1.10mi |
| 2406 46th St Unit A Lubbock, TX | 2.0 | 1.0 | 943 | $775 | $0.82 | 21d | 1 | 1.11mi |
| 2402 46th St Unit B Lubbock, TX | 2.0 | 1.0 | 942 | $745 | $0.79 | 21d | 1 | 1.11mi |
| 1614 58th St Unit A Lubbock, TX | 2.0 | 1.0 | 952 | $950 | $1.00 | 43d | 1 | 1.12mi |
| 1612 58th St Unit B Lubbock, TX | 2.0 | 1.0 | 952 | $950 | $1.00 | 43d | 1 | 1.13mi |
| 1610 58th St Unit B Lubbock, TX | 2.0 | 1.0 | 952 | $950 | $1.00 | 43d | 1 | 1.14mi |
| 3006 46th St Lubbock, TX | 2.0 | 1.0 | 1047 | $995 | $0.95 | 21d | 1 | 1.15mi |
| 2701 44th St Lubbock, TX | 1.0–3.0 | 1.0–1.5 | 657 | $888 | $1.35 | 13d | 25 | 1.15mi |
| 2607 44th St Lubbock, TX | 2.0 | 2.0 | 988 | $1,325 | $1.34 | 43d | 1 | 1.17mi |
Listing history 17 events
-
2026-06-18days on market $125,000 Active 22 DOM
-
2026-06-17days on market $125,000 Active 21 DOM
-
2026-06-16days on market $125,000 Active 20 DOM
-
2026-06-15days on market $125,000 Active 19 DOM
-
2026-06-14days on market $125,000 Active 17 DOM
-
2026-06-13days on market $125,000 Active 16 DOM
-
2026-06-10days on market $125,000 Active 14 DOM
-
2026-06-09days on market $125,000 Active 13 DOM
-
2026-06-08days on market $125,000 Active 12 DOM
-
2026-06-07days on market $125,000 Active 11 DOM
-
2026-06-05status $125,000 Active 8 DOM
-
2026-05-15$125,000 Active 904-char remark
-
2017-02-03soldstatus 79-char remark
Show marketing remark (79 chars)
A brick home with two bedrooms, two baths and two living areas on a corner lot.
-
2017-02-02soldstatus
-
2016-11-22$83,000 79-char remark
Show marketing remark (79 chars)
A brick home with two bedrooms, two baths and two living areas on a corner lot.
-
2012-11-19soldstatus
-
2001-02-26soldstatus
ⓘ Source: listings_history table (triggers on properties + properties_extension) + one-shot
backfill from property_details.listing_events for pre-trigger history.
Tax reassessment forecast TX · Resets to sale price
- Current annual tax
- $2,214 · $185/mo
- Projected year-2 tax
- $2,288 · $191/mo
- Expected delta
- +$73/yr (+$6/mo · 3.3%)
ⓘ Screening estimate from a state-policy table — verify with the county assessor before closing.
Climate risk First Street
- Flood 1/10 Low FEMA zone X (unshaded) · 0% chance over 30 yrs
- Wildfire 1/10 Low
- Heat 5/10 Major 7 d/yr ≥99°F today · 21 d/yr by 30 yrs out
- Wind 2/10 Low
- Air quality 2/10 Low 1 unhealthy d/yr today · 1 by 30 yrs out
Nearby sold comps map
Loading sold comps map…
Walkable amenities ~0.75 mi
Loading nearby amenities…
Taxation est. · year 1
- Rental income
- $14,561
- − Mortgage interest
- −$7,002
- − Property taxes
- −$2,214
- − Insurance
- −$625
- − Repairs & maintenance
- −$1,165
- − Management
- −$1,165
- − Depreciation
- −$3,636
- Taxable loss
- −$1,246
- Est. tax savings @ 24.0%
- +$299
- After-tax cash flow
- $1,097/yr
For passive investors: Depreciation is non-cash, so a rental often shows a tax loss while cash-flowing — sheltering income. Rental losses are passive: they offset passive income freely, and up to $25,000/yr can offset ordinary (W-2) income if you actively participate and your MAGI is under $100k (phasing out to $0 by $150k); unused losses carry forward. On sale, claimed depreciation is recaptured at up to 25%, and gains may owe capital-gains tax (a 1031 exchange can defer both). Figures are a year-1 estimate at your 24.0% rate — not tax advice; consult a CPA.
Schools (NCES district)
- District
- Lubbock ISD
- NCES district ID
- 4828500
- Math proficiency
- 36% ▼ -8.00%
- Reading proficiency
- 39% ▼ -1.00%
- Median HH income
- $39,820
- Composite
- 31.44/100
- National rank
- #5984
- State rank
- #481 of 826 in TX
Livability — Lubbock
- Score
- 80/100
- State rank
- #37
- US rank
- #1749
Category grades
Schools grade is shown separately in the Schools card above.
Census & demographics
- Census place
- Lubbock, TX
- County
- Lubbock County · 293,542 people
- City population
- 283,030
- Metro
- Lubbock, TX
- Population (ZIP)
- 23,343
- Household income
- $69,400
- Rent vs Own
- Severe rent burden
- 1211.0
Population outlook (Lubbock County) Hauer SSP2
- Today (2025)
- 345,960 people
- By 2030
- 371,449 · +7.4%
- By 2040
- 424,539 · +22.7%
- By 2050
- 481,150 · +39.1%
- By 2075
- 633,467 · +83.1%
- By 2100
- 746,853 · +115.9%
Race, ethnicity, and origin ACS 2023
- Neighborhood character
- Diverse neighborhood (Simpson 0.59)
- Race & ethnicity
- White 54% Hispanic / Latino 34% Two or more races 18% Black 6%
- Hispanic origin (detail)
- Mexican 25%
- Common ancestry
- Slovak 2% Italian 2% Serbian 1%
- Foreign-born
- 3% · Canada, China
- Languages at home
- 88% English-only · Spanish 10% Chinese 1%
Political lean MEDSL · Lubbock
- 2024 margin
- Solid R (+39.5) · D 29.7% · R 69.2% · Other 1.0%
- 2008→2024 swing
- -2.8pp toward R · 2008: -36.7pp · 2024: -39.5pp
- All cycles
- 2024: R+39.5 2020: R+32.2 2016: R+38.4 2012: R+40.9 2008: R+36.7
Not yet ingested
- Civics
- —
Market trends
- HPI YoY
- ▼ -145.52%
- Current HPI
- 239.8854
- Rent YoY
- ▲ 1.94%
- Metro
- Lubbock, TX
- State GDP YoY
- ▲ 3.95%
- F500 in state
- 110
Industry mix (Fortune 500 HQ in TX)
| Industry | F500 HQs | Revenue |
|---|---|---|
| Energy | 16 | $1,198B |
|
||
| Technology | 5 | $198B |
|
||
| Engineering / Construction | 4 | $72B |
|
||
| Energy Services | 3 | $60B |
|
||
| Utilities | 3 | $41B |
|
||
| Healthcare | 2 | $330B |
|
||
Price history
+50.6% since first listed8 events — show timeline
- 2026-06-04 Relisted — LARMLS
- 2026-05-23 Pending — LARMLS
- 2026-05-15 Listed $125,000 LARMLS
- 2017-02-03 Sold (MLS) — LARMLS
- 2017-02-02 Sold (Public Records) — Public Records
- 2016-11-22 Listed $83,000 LARMLS
- 2012-11-19 Sold (Public Records) — Public Records
- 2001-02-26 Sold (Public Records) — Public Records
Property tax history
+4.6%/yrLatest (2025): $2,214 · -3.4% YoY. Source: county tax records.
Cash-flow waterfall
monthlySold comps — $/sqft
last 12 mo · ≤1 miLoading sold comps…