 Fourplex
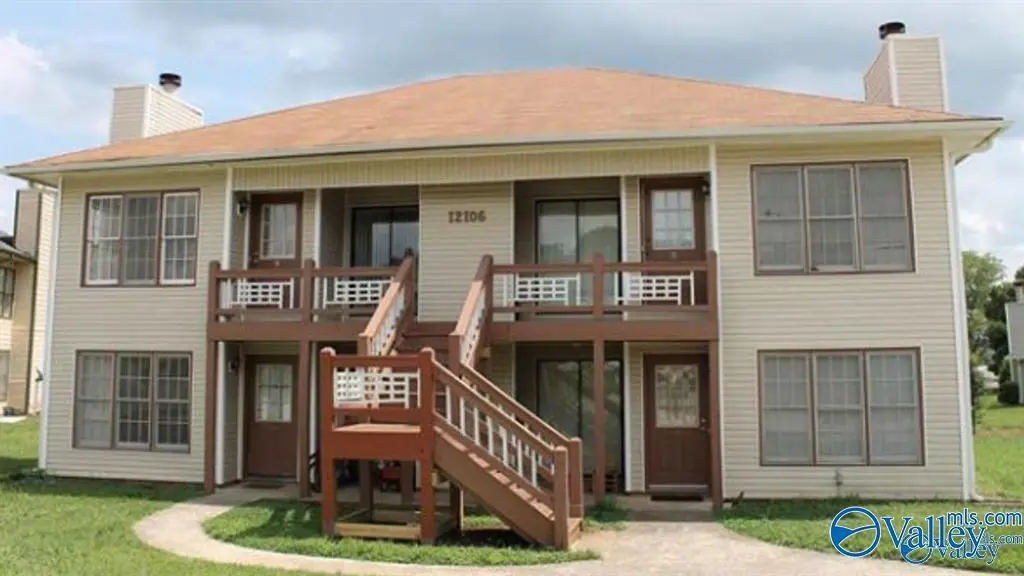
12106 Carriage Ct SE · Huntsville, AL
Flood risk 1/10 · Minimal
- FEMA flood zone
- X (unshaded)
- Chance of flooding over 30 yrs
- 0.0%
- Est. flood insurance / yr
- $507 – $1,088
Fire risk 4/10 · Minor
- Est. fire insurance / yr
- $916 – $1,700
Heat risk 6/10 · Moderate
- Hot days now (above 104°F)
- 7 days/yr
- Hot days in 30 yrs
- 22 days/yr
Wind risk 4/10 · Minor
- Chance of severe wind over 30 yrs
- 19.0%
Air-quality risk 2/10 · Minimal
- Unhealthy air days now
- 1 days/yr
- Unhealthy air days in 30 yrs
- 2 days/yr
Risk factors via First Street. Map © Google.
Why this score? — see what drove the D- grade
The composite is a weighted blend of 9 inputs, each scored 0–100. Each bar is that input's sub-score; the figure is the points it added to the 100-point composite (weight × sub-score).
- Cash flow +11.5/30.0
- ARV discount +7.5/15.0
- Livability +4.1/5.0
- DSCR +3.4/10.0
- Rent growth +3.4/5.0
- Schools +2.9/10.0
- Condition / age +2.5/5.0
- 1% rule +2.4/10.0
- Appreciation +0.0/10.0
$590,000
🖨 Deal sheet (PDF) 📄 Offer letter ✓ Due diligence
Multi-family units
County records classify this as Multi-Family (5+ Unit). Listing-text estimate: 4 units. estimate disagrees with records
5+ unit building — per-unit beds/baths from public records are typically unavailable; the breakdown below (if shown) is an estimate from the listing text.
Listing remarks
Four unit building in the heart of SE Huntsville, next to some of Huntsville's new Challenger Elementary and Challenger Middle. End of cul de sac location, larger lot. Concrete parking lot and drive, Professionally managed. All units are two bed two full bath. Taxes paid 2025 are $2766. Do not miss out on your chance to own a multi-family in Huntsville! Call today!
Key facts
- 8 parking spots
- Built 1984
- Listed 31 days
Property features AI
Finance
- Other: Directions: From Memorial Parkway, east on Hobbs, right at Chaney Thompson, right onto Lantern Walk, left onto Carriage Court
Exterior
- Parking: Eight parking spaces; Concrete driveway and parking lot with open parking
- Utilities: Public water; Public sewer; No gas service indicated
- Home design: Residential income property (apartment); Built in 1984
- Construction: Year built 1984
- Exterior features: Located at the end of a cul-de-sac (building at end of cul-de-sac); Subdivision: Sugar Mill
Interior
- Kitchen: Oven; Refrigerator; Dishwasher; Electric water heater
- Heating & cooling: Central heating (electric); Central air conditioning
- Interior features: No view reported
- Laundry & utility: Washer/Dryer hookup
Neighborhood map
What this means for you Summary
Snapshot
- This is a 4 × 2-bed/2-bath units multifamily listed at $590k.
Deal economics
- At list price, monthly cash flow is $-194 ($-2k/yr) — negative. Per door: $-49/mo.
- To cash-flow at today's rent, offer at most $556k (5.8% below list).
- To meet the 1% rule (rent ≥ 1% of price), the offer needs to be $437k (25.9% below list).
- Recommended offer: $437k (25.9% below list) — sets the bar for 1% rule.
- Cap rate 5.9% vs local median 3.8% in Huntsville — top-decile yield for the area; either an underpriced asset or a hidden risk that comps aren't pricing in. Stress-test before assuming the spread holds.
Location & tenants
- Location reads 82/100 on livability (#3 in AL, #1,082 nationally) — a professional / high-income tenant draw. Strengths: commute A+, cost of living A+, housing A+; Watch: crime F.
- Huntsville City (urban): math 21% / reading 46% proficiency, ranked #48 of 129 in AL (top 37%) — families likely to look elsewhere, expect single-tenant / working-renter base with shorter leases.
- Zoned schools: Challenger Elementary School (math 30% / reading 53%, grade F, #232 of 627 statewide, top 37%, 503 students, 43% FRL); Challenger Middle School (math 19% / reading 55%, grade F, #73 of 257 statewide, top 29%, 438 students, 44% FRL); Virgil Grissom High School (math 34% / reading 40%, grade F, #39 of 305 statewide, top 13%, 1,974 students, 43% FRL) — zoned schools at 43% FRL track the district average.
- Market conditions: Rents rising (+3.7%/yr); 283 active listings in the ZIP; 2 comparable units currently listed for rent nearby; solid renter incomes; 4,709 units permitted in Madison County in 2024 (1,186 in 5+ unit buildings).
- At $4,374/mo this rent would consume 52% of the median local household income ($101k/yr) (locally 411% of renters already pay >50% of income on rent) — very limited rent-growth headroom before tenants either downsize or default.
Forward outlook
- Local home prices are declining (-3.0%/yr); year-one equity from $4k of loan paydown is wiped out by about $18k of value loss. Plan a longer hold.
- Madison County population projected at +18% by 2050 — long-run rental-demand tailwind backs the buy-and-hold thesis.
Negotiation context
- It's been on market 31 days — a 3% lower offer ($572k) is reasonable based on typical stale-listing flexibility.
- 2 sale attempts since 3y ago with the ask held roughly flat each time — persistent listings suggest the price (not the market) is what's stuck; bring a comps-based counter.
- Current owner paid $229k; list at $590k implies a 158% gain — meaningful room to come down on a strong offer.
Risks & watch-outs
- Climate carrying-cost: extreme-heat days projected 7→22/yr by 2055 (HVAC capex compounding) — expect insurance premiums to compound above CPI over the hold.
Questions for the listing agent
- What do current leases actually rent for vs. the listed asking? Can we see a recent rent roll and the last 12 months of T-12 income?
- It's been on market 31 days. Have you received any prior offers? Is the seller open to a 26% concession, seller financing, or rate buy-down credit?
- Can we see the unit-by-unit rent roll, current vacancy, and any below-market leases? What's the average tenancy length?
- What capital expenditures (roof, boiler, parking lot, exteriors) have been made in the last 5 years, and what's planned in the next 2?
- Is there a deadline driving the sale (1031 exchange, divorce, estate, relocation)? That informs how much negotiation room exists.
- Crime grade is F in this area — have there been break-ins, vandalism, or insurance claims at this property in the last 3 years? What carrier currently insures it and at what premium?
- The area grade is low — what's the realistic commute time and amenity access for the typical tenant pool here? Any planned neighborhood developments (good or bad) we should know about?
- What's the average days-on-market for RENTAL listings here right now (not sales)? A rising rental-DOM trend means longer vacancies and softer asking-rent achievability than the comps imply.
- What's the recent tenant-quality profile in this submarket — average credit score on applications, eviction rate, late-payment / NSF rate, and stable-employment percentage? A property-management company in the area should have these aggregated.
- How much new apartment / multifamily construction is in the pipeline within 1–3 miles? Heavy new supply (>2% of stock underway) typically softens rents 12–24 months out; light construction supports rent growth.
Investment metrics
- 1% rule
- 0.74% ✗
- Cap rate
- 5.90%
- Cash-on-cash
- -1.41%
- DSCR
- 0.94
- GRM
- 11.2
CMA / ARV
No comps found within radius.
Projected returns pro-forma
-3.0% appreciation · 3.72% rent growth · sell at horizon
- IRR
- -18.0%
- Equity multiple
- 0.36×
- Total profit
- $-104,993
- Equity at exit
- $87,971
- IRR
- -9.0%
- Equity multiple
- 0.43×
- Total profit
- $-94,880
- Equity at exit
- $51,012
Cash invested: $165,200 (down + closing). Projections, not guarantees.
Landlord ↔ Tenant lean methodology
- Overall (STATE)
- 90 Strongly Landlord-Friendly
- State Alabama
- 90 Strongly Landlord-Friendly · R+15
- County
- — inherits STATE
- City
- — inherits STATE
ZIP-level market 35803
- Home prices YoY
- -22.9%
- Rents YoY
- 3.7%
- Active inventory
- 283
- Price-to-rent
- 45.0×
Monthly cashflow live
- Estimated rent
- $4,374 high interval (Pro) →
- Mortgage (P&I)
- −$3,094
- Tax from tax record
- −$310 /mo · $3,720/yr
- Insurance
- −$246
- HOA
- −$0
- Vacancy / Maint / Mgmt
- −$919
- Net cashflow
- $-194
Break-even live
Sensitivity live
| Price | -10% $140 | -5% $-27 | +0% $-194 | +5% $-361 | +10% $-528 |
|---|---|---|---|---|---|
| Rent | -10% $-540 | -5% $-367 | +0% $-194 | +5% $-22 | +10% $151 |
| Rate | -1.0pp $103 | -0.5pp $-44 | base $-194 | +0.5pp $-347 | +1.0pp $-503 |
4-unit breakdown (identical units grouped — click to expand)
| Units | Beds | Baths | Est. rent |
|---|---|---|---|
| 4× units | 2 | 2 | $4,372 |
| #1 | 2 | 2 | $1,093 |
| #2 | 2 | 2 | $1,093 |
| #3 | 2 | 2 | $1,093 |
| #4 | 2 | 2 | $1,093 |
| Total (4 units) | $4,374 | ||
UW: 25.0% down · 7.5% · 30yr · 1.5% tax · 5.0% vac · 8.0% maint · 8.0% mgmt
Financing live
Cash to close
- Down payment
- $147,500
- Closing costs
- $17,700
- Reserves months
- —
- Total cash needed
- —
Loan-product check · same deal, 3 products live
Conventional
25% down · 7.5% · 30yr
- Down + closing
- —
- Monthly P&I
- —
- Monthly cashflow
- —
- DSCR
- —
- Eligible?
- —
Personal DTI + credit; lowest rate.
DSCR
20% down · 8.5% · 30yr
- Down + closing
- —
- Monthly P&I
- —
- Monthly cashflow
- —
- DSCR
- —
- Eligible?
- —
No personal income docs; deal must DSCR.
Hard money
10% down · 12.0% · 12mo
- Down + closing
- —
- Monthly P&I
- —
- Monthly cashflow
- —
- DSCR
- —
- Eligible?
- —
Short-term bridge; refi at stabilization.
Rent comps 2 comps
| Address | Beds | Baths | Sqft | Rent | $/sqft | DOM | Units | Dist |
|---|---|---|---|---|---|---|---|---|
| 2507 Millwood Cir SE Huntsville, AL | 3.0 | 3.0 | 2700 | $1,898 | $0.70 | 45d | 1 | 0.50mi |
| 15010 Carlisle Dr SE Huntsville, AL | 3.0 | 3.0 | 2488 | $2,495 | $1.00 | 15d | 1 | 0.89mi |
Listing history 21 events
-
2026-06-22days on market $590,000 Active 31 DOM
-
2026-06-18days on market $590,000 Active 28 DOM
-
2026-06-17days on market $590,000 Active 27 DOM
-
2026-06-16days on market $590,000 Active 26 DOM
-
2026-06-15days on market $590,000 Active 25 DOM
-
2026-06-14days on market $590,000 Active 23 DOM
-
2026-06-10days on market $590,000 Active 20 DOM
-
2026-06-09days on market $590,000 Active 19 DOM
-
2026-06-08days on market $590,000 Active 18 DOM
-
2026-06-07days on market $590,000 Active 17 DOM
-
2026-06-03days on market $590,000 Active 13 DOM
-
2026-06-02days on market $590,000 Active 12 DOM
-
2026-06-01days on market $590,000 Active 11 DOM
-
2026-05-31days on market $590,000 Active 10 DOM
-
2026-05-30days on market $590,000 Active 9 DOM
-
2026-05-21$590,000 Active
-
2023-07-14status Pending
-
2023-06-29$495,000 Active
-
2018-04-27soldstatus $229,000
-
2010-08-02soldstatus $147,000
-
2006-12-19soldstatus $389,600
ⓘ Source: listings_history table (triggers on properties + properties_extension) + one-shot
backfill from property_details.listing_events for pre-trigger history.
Tax reassessment forecast AL · Resets to sale price
- Current annual tax
- $3,720 · $310/mo
- Projected year-2 tax
- $3,720 · $310/mo
- Expected delta
- $0/yr ($0/mo · 0.0%)
ⓘ Screening estimate from a state-policy table — verify with the county assessor before closing.
Climate risk First Street
- Flood 1/10 Low FEMA zone X (unshaded) · 0% chance over 30 yrs
- Wildfire 4/10 Moderate
- Heat 6/10 Major 7 d/yr ≥104°F today · 22 d/yr by 30 yrs out
- Wind 4/10 Moderate 19% chance of damaging wind over 30 yrs
- Air quality 2/10 Low 1 unhealthy d/yr today · 2 by 30 yrs out
Nearby sold comps map
Loading sold comps map…
Walkable amenities ~0.75 mi
Loading nearby amenities…
Taxation est. · year 1
- Rental income
- $52,488
- − Mortgage interest
- −$33,049
- − Property taxes
- −$3,720
- − Insurance
- −$2,950
- − Repairs & maintenance
- −$4,199
- − Management
- −$4,199
- − Depreciation
- −$17,164
- Taxable loss
- −$12,793
- Est. tax savings @ 24.0%
- +$3,070
- After-tax cash flow
- $737/yr
For passive investors: Depreciation is non-cash, so a rental often shows a tax loss while cash-flowing — sheltering income. Rental losses are passive: they offset passive income freely, and up to $25,000/yr can offset ordinary (W-2) income if you actively participate and your MAGI is under $100k (phasing out to $0 by $150k); unused losses carry forward. On sale, claimed depreciation is recaptured at up to 25%, and gains may owe capital-gains tax (a 1031 exchange can defer both). Figures are a year-1 estimate at your 24.0% rate — not tax advice; consult a CPA.
Schools (NCES district)
- District
- Huntsville City
- NCES district ID
- 0101800
- Math proficiency
- 21% ▼ -23.00%
- Reading proficiency
- 46% ▬ 0.00%
- Median HH income
- $48,264
- Composite
- 28.84/100
- National rank
- #6647
- State rank
- #48 of 129 in AL
Livability — Huntsville
- Score
- 82/100
- State rank
- #3
- US rank
- #1082
Category grades
Schools grade is shown separately in the Schools card above.
Census & demographics
- Census place
- Huntsville, AL
- County
- Madison County · 380,832 people
- City population
- 220,435
- Metro
- Huntsville, AL
- Population (ZIP)
- 29,197
- Household income
- $100,846
- Rent vs Own
- Severe rent burden
- 411.0
Population outlook (Madison County) Hauer SSP2
- Today (2025)
- 392,086 people
- By 2030
- 409,788 · +4.5%
- By 2040
- 440,557 · +12.4%
- By 2050
- 460,990 · +17.6%
- By 2075
- 502,872 · +28.3%
- By 2100
- 513,623 · +31.0%
Race, ethnicity, and origin ACS 2023
- Neighborhood character
- Predominantly White (82%)
- Race & ethnicity
- White 82% Hispanic / Latino 7% Two or more races 7% Black 4% Asian 3%
- Hispanic origin (detail)
- Mexican 4% Puerto Rican 1%
- Common ancestry
- Slovak 3% Italian 2% Lithuanian 2%
- Foreign-born
- 6% · Canada, China, South Korea
- Languages at home
- 92% English-only · Spanish 3% Chinese 2% German/W. Germanic 1%
Political lean MEDSL · Madison
- 2024 margin
- Lean R (+9.0) · D 44.7% · R 53.7% · Other 1.6%
- 2008→2024 swing
- +6.0pp toward D · 2008: -14.9pp · 2024: -9.0pp
- All cycles
- 2024: R+9.0 2020: R+8.0 2016: R+16.8 2012: R+18.7 2008: R+14.9
Not yet ingested
- Civics
- —
Market trends
- HPI YoY
- ▼ -110.53%
- Current HPI
- 372.1842
- Rent YoY
- ▲ 3.72%
- Metro
- Huntsville, AL
- State GDP YoY
- ▲ 2.94%
- F500 in state
- 4
Industry mix (Fortune 500 HQ in AL)
| Industry | F500 HQs | Revenue |
|---|---|---|
| Financial Services | 1 | $8B |
|
||
| Healthcare | 1 | $5B |
|
||
Price history
+51.4% since first listed6 events — show timeline
- 2026-05-21 Listed $590,000 VMLS
- 2023-07-14 Pending — VMLS
- 2023-06-29 Listed $495,000 VMLS
- 2018-04-27 Sold (Public Records) $229,000 Public Records
- 2010-08-02 Sold (Public Records) $147,000 Public Records
- 2006-12-19 Sold (Public Records) $389,600 Public Records
Property tax history
+9.6%/yrLatest (2024): $3,720 · +4.3% YoY. Source: county tax records.
Cash-flow waterfall
monthlySold comps — $/sqft
last 12 mo · ≤1 miLoading sold comps…