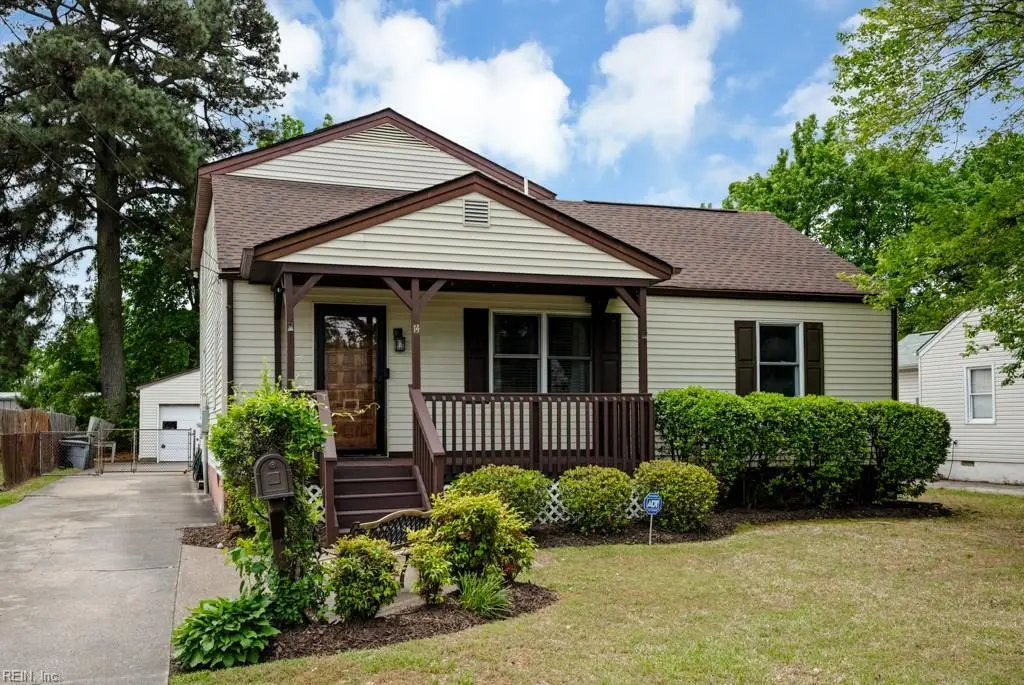
14 Quinn St · Hampton, VA
Flood risk 6/10 · Moderate
- FEMA flood zone
- X (unshaded)
- Chance of flooding over 30 yrs
- 0.55%
- Est. flood insurance / yr
- $473 – $860
Fire risk 1/10 · Minimal
- Est. fire insurance / yr
- $666 – $1,236
Heat risk 9/10 · Severe
- Hot days now (above 104°F)
- 7 days/yr
- Hot days in 30 yrs
- 16 days/yr
Wind risk 8/10 · Major
- Chance of severe wind over 30 yrs
- 80.0%
Air-quality risk 2/10 · Minimal
- Unhealthy air days now
- 2 days/yr
- Unhealthy air days in 30 yrs
- 2 days/yr
Risk factors via First Street. Map © Google.
Why this score? — see what drove the C- grade
The composite is a weighted blend of 9 inputs, each scored 0–100. Each bar is that input's sub-score; the figure is the points it added to the 100-point composite (weight × sub-score).
- ARV discount +15.0/15.0
- Cash flow +13.7/30.0
- Schools +5.5/10.0
- DSCR +4.1/10.0
- Rent growth +3.9/5.0
- Livability +3.8/5.0
- 1% rule +3.3/10.0
- Condition / age +2.5/5.0
- Appreciation +0.0/10.0
$260,000
🖨 Deal sheet 📄 Offer letter ✓ Due diligence
Listing remarks
Spacious 4 bedroom, 2 bathroom home with a cozy front porch and large deck in back. Conveniently located near shopping, dining, interstates, beaches, bases, etc. All appliances convey as-is, the roof, gutters and hvac are all 6-7 years old.
Key facts
- 8,712 sq ft lot
- 2 garage spots
- Built 1950
Property features AI
Finance
- Other: Energy efficiency features include spray foam insulation and storm doors
- HOA & community: No HOA fees
Exterior
- Parking: Detached 2-car garage; Additional multi-car parking; Street parking
- Utilities: City/County sewer; Electric water heater; Electric service (220 V available)
- Home design: Detached home; Traditional style; 2 stories (2 living levels); Entry level includes first-floor bedroom and full bathroom; Simple ownership
- Construction: Vinyl siding; Asphalt shingle roof; Crawl foundation
- Exterior features: Deck; Patio; Screened porch; Back yard fenced with chain link and wood fencing
Interior
- Kitchen: Electric range; Microwave; Dishwasher; Disposal; Refrigerator; Pantry
- Bedrooms: Master bedroom with bath; One bedroom with ensuite; First-floor bedroom
- Flooring: Laminate; Slate; Vinyl
- Bathrooms: 2 full bathrooms
- Heating & cooling: Natural gas heating; Central air
- Interior features: Attic fan; Cable hookup; Ceiling fans; Garage door opener; Walk-in attic; Walk-in closet
- Laundry & utility: Washer; Dryer; Utility room
Neighborhood map
What this means for you Summary
Snapshot
- This is a 2-bed/1.0-bath single-family listed at $260k.
Deal economics
- At list price, monthly cash flow is $20 ($236/yr) — positive.
- The deal already cash-flows at list — no discount required.
- To meet the 1% rule (rent ≥ 1% of price), the offer needs to be $215k (17.1% below list).
- Recommended offer: $215k (17.1% below list) — sets the bar for 1% rule.
- Cap rate 6.4% vs local median 4.5% in Hampton — top-decile yield for the area; either an underpriced asset or a hidden risk that comps aren't pricing in. Stress-test before assuming the spread holds.
Location & tenants
- Location reads 75/100 on livability (#133 in VA, #4,302 nationally) — a middle-class / working-renter tenant base. Strengths: housing A+, health & safety A+, cost of living A; Watch: crime C-, amenities D+, commute F.
- Hampton City Public School District (urban): math 60% / reading 70% proficiency, ranked #40 of 131 in VA (top 30%) — acceptable for families but not a draw, mixed tenant base, ~2y average lease.
- Zoned schools: Captain John Smith Elementary (math 42% / reading 57%, grade D, #742 of 1,108 statewide, top 70%, 393 students, 82% FRL); Hampton High (math 60% / reading 75%, grade B, #183 of 319 statewide, top 58%, 1,359 students, 86% FRL) — zoned schools average 84% FRL vs 49% district-wide (35 pts higher); higher-poverty schools than district average — tighter screening recommended.
- Market conditions: Rents rising fast (+5.4%/yr); 232 active listings in the ZIP; 18 comparable units currently listed for rent nearby; rentals at typical pace (median 17d on market — plan ~3-4 weeks tenant-placement turnaround); 68 units permitted in Hampton city in 2024 (0 in 5+ unit buildings).
- This rent runs 36% of the median local income ($71k/yr) — at the standard rent-burdened threshold; future hikes will face affordability resistance.
Forward outlook
- Local home prices are declining (-3.0%/yr); year-one equity from $2k of loan paydown is wiped out by about $8k of value loss. Plan a longer hold.
- Hampton County population projected at -13% by 2050 — secular population decline; favor cash flow + early exit over multi-decade hold.
Negotiation context
- Only 14 days on market — expect competitive offers; lowballing is unlikely to land.
Risks & watch-outs
- Watch-outs: built in 1950 — expect roof / HVAC / electrical / plumbing capex.
- Climate carrying-cost: major flood risk; severe wind risk, 80% chance of damaging wind over 30y; extreme-heat days projected 7→16/yr by 2055 (HVAC capex compounding) — expect insurance premiums to compound above CPI over the hold.
Questions for the listing agent
- Built in 1950 — when were the roof, HVAC, electrical panel, plumbing, and water heater last replaced?
- Is there a deadline driving the sale (1031 exchange, divorce, estate, relocation)? That informs how much negotiation room exists.
- Schools are B-rated — typically a magnet for longer-tenancy family renters. What's the average tenant stay here, and is there a school-zone premium baked into asking?
- What's the average days-on-market for RENTAL listings here right now (not sales)? A rising rental-DOM trend means longer vacancies and softer asking-rent achievability than the comps imply.
- What's the recent tenant-quality profile in this submarket — average credit score on applications, eviction rate, late-payment / NSF rate, and stable-employment percentage? A property-management company in the area should have these aggregated.
- How much new for-sale + rental construction is in the pipeline within 1–3 miles? Heavy new supply typically softens prices + rents 12–24 months out; constrained supply supports both.
Investment metrics
- 1% rule
- 0.83% ✗
- Cap rate
- 6.38%
- Cash-on-cash
- 0.32%
- DSCR
- 1.01
- GRM
- 10.1
CMA / ARV
- ARV (median comp)
- $328,884
- List price
- $260,000
- Delta
- -20.94%
- Verdict
- UNDERPRICED
- Comps
- 20 within 1.0 mi
Show comp detail 10 sales within ~0.75 mi
| Address | Dist | Beds/Ba | Sqft | Sold | Price | $/sf | Match |
|---|---|---|---|---|---|---|---|
| 305 Roane Dr | 0.32mi | 3/2.5 (+1) | 1,902 (-3%) | 11mo | $342,500 | $180 | 60 |
| 317 Shoreline Dr | 0.46mi | 3/2.0 (+1) | 1,892 (-4%) | 9mo | $289,900 | $153 | 56 |
| 242 Bailey Park Dr | 0.37mi | 3/2.5 (+1) | 2,078 (+6%) | 9mo | $325,000 | $156 | 54 |
| 53 Longwood Dr | 0.43mi | 3/2.0 (+1) | 1,844 (-6%) | 14mo | $327,000 | $177 | 49 |
| 19 Pine Cone Dr | 0.68mi | 3/2.0 (+1) | 1,875 (-5%) | 8mo | $360,800 | $192 | 45 |
| 12 Lands End Cir | 0.62mi | 3/3.0 (+1) | 1,850 (-6%) | 4mo | $700,000 | $378 | 45 |
| 238 Bailey Park Dr | 0.35mi | 3/2.5 (+1) | 1,761 (-10%) | 13mo | $325,000 | $185 | 45 |
| 108 Kove Dr | 0.54mi | 3/2.0 (+1) | 1,800 (-8%) | 9mo | $360,000 | $200 | 44 |
| 201 Pine Grove Ave | 0.70mi | 3/3.0 (+1) | 2,000 (+2%) | 13mo | $339,900 | $170 | 40 |
| 4 Lands End Cir | 0.56mi | 3/2.0 (+1) | 2,195 (+12%) | 10mo | $340,000 | $155 | 37 |
Match score weights: distance 35% · size 25% · config 20% · recency 20%. Top-matched comps best support the ARV.
Projected returns pro-forma
-3.0% appreciation · 5.44% rent growth · sell at horizon
- IRR
- -13.3%
- Equity multiple
- 0.51×
- Total profit
- $-35,500
- Equity at exit
- $38,767
- IRR
- -1.1%
- Equity multiple
- 0.92×
- Total profit
- $-6,083
- Equity at exit
- $22,480
Cash invested: $72,800 (down + closing). Projections, not guarantees.
Landlord ↔ Tenant lean methodology
- Overall (STATE)
- 55 Moderately Landlord-Leaning
- State Virginia
- 55 Moderately Landlord-Leaning · D+2
- County
- — inherits STATE
- City
- — inherits STATE
ZIP-level market 23669
- Rents YoY
- 5.4%
- Active inventory
- 232
- Price-to-rent
- 10.1×
Monthly cashflow live
- Estimated rent
- $2,154 high interval (Pro) →
- Mortgage (P&I)
- −$1,363
- Tax from tax record
- −$211 /mo · $2,526/yr
- Insurance
- −$108
- HOA
- −$0
- Vacancy / Maint / Mgmt
- −$452
- Net cashflow
- $20
Break-even live
UW: 25.0% down · 7.5% · 30yr · 1.5% tax · 5.0% vac · 8.0% maint · 8.0% mgmt
Financing live
Cash to close
- Down payment
- $65,000
- Closing costs
- $7,800
- Reserves months
- —
- Total cash needed
- —
Loan-product check · same deal, 3 products live
Conventional
25% down · 7.5% · 30yr
- Down + closing
- —
- Monthly P&I
- —
- Monthly cashflow
- —
- DSCR
- —
- Eligible?
- —
Personal DTI + credit; lowest rate.
DSCR
20% down · 8.5% · 30yr
- Down + closing
- —
- Monthly P&I
- —
- Monthly cashflow
- —
- DSCR
- —
- Eligible?
- —
No personal income docs; deal must DSCR.
Hard money
10% down · 12.0% · 12mo
- Down + closing
- —
- Monthly P&I
- —
- Monthly cashflow
- —
- DSCR
- —
- Eligible?
- —
Short-term bridge; refi at stabilization.
Rent comps 18 comps
| Address | Beds | Baths | Sqft | Rent | $/sqft | DOM | Units | Dist |
|---|---|---|---|---|---|---|---|---|
| 217 W Gilbert St Hampton, VA | 3.0 | 2.5 | 2055 | $2,495 | $1.21 | 43d | 1 | 0.22mi |
| 225 W Gilbert St Hampton, VA | 3.0 | 2.5 | 2196 | $2,700 | $1.23 | 14d | 1 | 0.24mi |
| 31 Saxony Pl Hampton, VA | 3.0 | 2.5 | 1315 | $1,645 | $1.25 | 17d | 1 | 0.52mi |
| 17 S Gawain Way Hampton, VA | 3.0 | 1.5 | 1460 | $1,895 | $1.30 | 2d | 1 | 0.52mi |
| 13 W Lamington Rd Hampton, VA | 3.0 | 1.5 | 1415 | $2,050 | $1.45 | 43d | 1 | 0.78mi |
| 98 Apollo Dr Hampton, VA | 3.0 | 2.5 | 1880 | $2,200 | $1.17 | 14d | 1 | 0.87mi |
| 98 Apollo Dr Hampton, VA | 3.0 | 2.5 | 1880 | $2,200 | $1.17 | 43d | 1 | 0.87mi |
| 212 Dockside Dr Unit B Hampton, VA | 2.0 | 2.0 | 1253 | $1,795 | $1.43 | 43d | 1 | 0.93mi |
| 606 Washington St Hampton, VA | 3.0 | 2.5 | 2370 | $2,600 | $1.10 | 21d | 1 | 1.09mi |
| 703 N Back River Rd Hampton, VA | 3.0 | 2.5 | 2062 | $2,475 | $1.20 | 43d | 1 | 1.12mi |
| 18 Colonies Lndg Hampton, VA | 3.0 | 2.5 | 1540 | $2,000 | $1.30 | 4d | 1 | 1.17mi |
| 2 Abbott Dr Hampton, VA | 1.0–3.0 | 1.0–3.5 | 1187 | $2,224 | $1.87 | 1d | 18 | 1.20mi |
| 102 Tyburn Ct Hampton, VA | 3.0 | 2.5 | 1500 | $2,000 | $1.33 | 12d | 1 | 1.23mi |
| 608 Charlton Dr Hampton, VA | 3.0 | 2.5 | 1800 | $2,500 | $1.39 | 14d | 1 | 1.27mi |
| 19 Magnolia Pl Hampton, VA | 3.0 | 1.5 | 1405 | $2,100 | $1.49 | 14d | 1 | 1.34mi |
| 709 E Pembroke Ave Unit B Hampton, VA | 2.0 | 1.5 | 1664 | $1,349 | $0.81 | 23d | 1 | 1.34mi |
| 63 Waters Edge Cir Hampton, VA | 3.0 | 2.5 | 1667 | $2,400 | $1.44 | 23d | 1 | 1.43mi |
| 99 Tide Mill Ln Hampton, VA | 1.0–4.0 | 1.0–2.0 | 1145 | $1,882 | $1.64 | 1d | 19 | 1.47mi |
Listing history 4 events
-
2026-05-10historical Active Under Contract 241-char remark
-
2026-05-07$260,000 Active 241-char remark
-
2005-12-05soldstatus $100,000
-
1989-05-01soldstatus $75,500
ⓘ Source: listings_history table (triggers on properties + properties_extension) + one-shot
backfill from property_details.listing_events for pre-trigger history.
Tax reassessment forecast VA · Resets to sale price
- Current annual tax
- $2,526 · $211/mo
- Projected year-2 tax
- $2,526 · $211/mo
- Expected delta
- $0/yr ($0/mo · 0.0%)
ⓘ Screening estimate from a state-policy table — verify with the county assessor before closing.
Climate risk First Street
- Flood 6/10 Major FEMA zone X (unshaded) · 55% chance over 30 yrs
- Wildfire 1/10 Low
- Heat 9/10 Extreme 7 d/yr ≥104°F today · 16 d/yr by 30 yrs out
- Wind 8/10 Severe 80% chance of damaging wind over 30 yrs
- Air quality 2/10 Low 2 unhealthy d/yr today · 2 by 30 yrs out
Nearby sold comps map
Loading sold comps map…
Walkable amenities ~0.75 mi
Loading nearby amenities…
Taxation est. · year 1
- Rental income
- $25,853
- − Mortgage interest
- −$14,564
- − Property taxes
- −$2,526
- − Insurance
- −$1,300
- − Repairs & maintenance
- −$2,068
- − Management
- −$2,068
- − Depreciation
- −$7,564
- Taxable loss
- −$4,238
- Est. tax savings @ 24.0%
- +$1,017
- After-tax cash flow
- $1,253/yr
For passive investors: Depreciation is non-cash, so a rental often shows a tax loss while cash-flowing — sheltering income. Rental losses are passive: they offset passive income freely, and up to $25,000/yr can offset ordinary (W-2) income if you actively participate and your MAGI is under $100k (phasing out to $0 by $150k); unused losses carry forward. On sale, claimed depreciation is recaptured at up to 25%, and gains may owe capital-gains tax (a 1031 exchange can defer both). Figures are a year-1 estimate at your 24.0% rate — not tax advice; consult a CPA.
Schools (NCES district)
- District
- Hampton City Public School District
- NCES district ID
- 5101800
- Math proficiency
- 60% ▼ -21.00%
- Reading proficiency
- 70% ▼ -4.00%
- Median HH income
- $50,089
- Composite
- 55.19/100
- National rank
- #1272
- State rank
- #40 of 131 in VA
Livability — Hampton
- Score
- 75/100
- State rank
- #133
- US rank
- #4302
Category grades
Schools grade is shown separately in the Schools card above.
Census & demographics
- Census place
- Hampton, VA
- County
- Hampton City · 132,421 people
- City population
- 132,421
- Metro
- Virginia Beach-Norfolk-Newport News, VA-NC
- Population (ZIP)
- 39,884
- Household income
- $71,222
- Rent vs Own
- Severe rent burden
- 2130.0
Population outlook (Hampton County) Hauer SSP2
- Today (2025)
- 134,055 people
- By 2030
- 131,753 · -1.7%
- By 2040
- 125,017 · -6.7%
- By 2050
- 116,825 · -12.9%
- By 2075
- 97,033 · -27.6%
- By 2100
- 76,188 · -43.2%
Race, ethnicity, and origin ACS 2023
- Neighborhood character
- Diverse neighborhood (Simpson 0.63)
- Race & ethnicity
- Black 46% White 39% Two or more races 9% Hispanic / Latino 6% Asian 2%
- Hispanic origin (detail)
- Mexican 1% Puerto Rican 2%
- Common ancestry
- Slovak 2% Italian 1% Romanian 1%
- Foreign-born
- 4% · Canada
- Languages at home
- 95% English-only · Spanish 3% Other Asian/Pacific 1%
Political lean MEDSL · Hampton
- 2024 margin
- Solid D (+39.9) · D 69.2% · R 29.4% · Other 1.4%
- 2008→2024 swing
- +1.0pp no change · 2008: 38.9pp · 2024: 39.9pp
- All cycles
- 2024: D+39.9 2020: D+42.2 2016: D+37.8 2012: D+45.4 2008: D+38.9
Not yet ingested
- Civics
- —
Market trends
- HPI YoY
- ▼ -150.40%
- Current HPI
- 276.4636
- Rent YoY
- ▲ 5.44%
- Metro
- Virginia Beach-Norfolk-Newport News, VA-NC
- State GDP YoY
- ▲ 2.40%
- F500 in state
- 50
Industry mix (Fortune 500 HQ in VA)
| Industry | F500 HQs | Revenue |
|---|---|---|
| Aerospace / Defense | 4 | $236B |
|
||
| Technology / Defense | 3 | $32B |
|
||
| Financial Services | 2 | $176B |
|
||
| Utilities | 2 | $27B |
|
||
| Insurance | 2 | $25B |
|
||
| Technology | 2 | $15B |
|
||
Price history
+264.2% since first listed6 events — show timeline
- 2026-06-09 Sold (MLS) $275,000 REINMLS
- 2026-05-21 Pending — REINMLS
- 2026-05-10 Contingent — REINMLS
- 2026-05-07 Listed $260,000 REINMLS
- 2005-12-05 Sold (Public Records) $100,000 Public Records
- 1989-05-01 Sold (Public Records) $75,500 Public Records
Property tax history
+9.1%/yrLatest (2025): $2,526 · +11.7% YoY. Source: county tax records.
Cash-flow waterfall
monthlySold comps — $/sqft
last 12 mo · ≤1 miLoading sold comps…