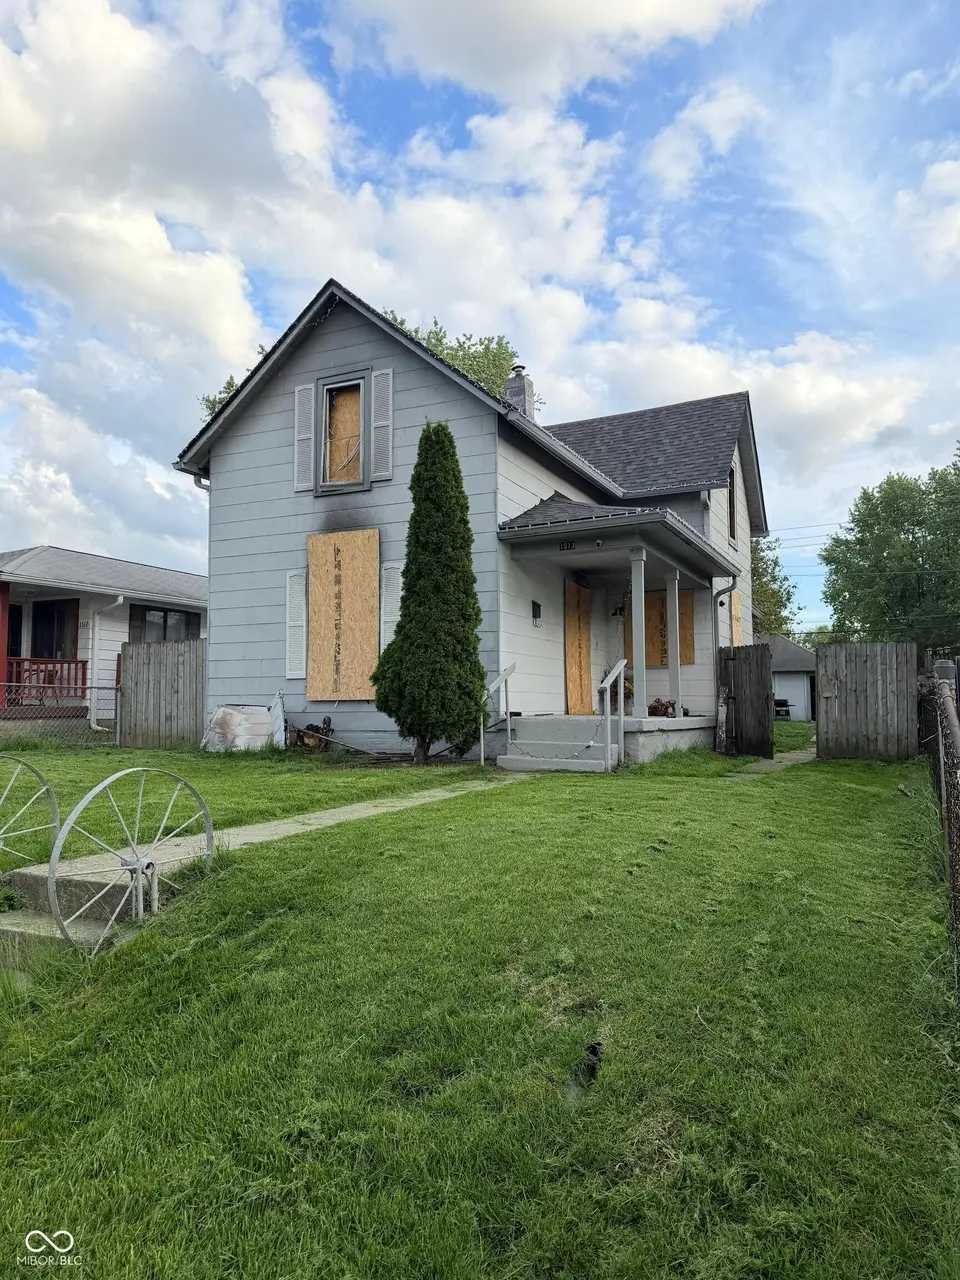
1513 Finley Ave · Indianapolis city (balance), IN
Flood risk 1/10 · Minimal
- FEMA flood zone
- X (unshaded)
- Chance of flooding over 30 yrs
- 0.0%
- Est. flood insurance / yr
- $473 – $860
Fire risk 1/10 · Minimal
- Est. fire insurance / yr
- $717 – $1,331
Heat risk 4/10 · Minor
- Hot days now (above 101°F)
- 7 days/yr
- Hot days in 30 yrs
- 19 days/yr
Wind risk 2/10 · Minimal
- Chance of severe wind over 30 yrs
- 0.0%
Air-quality risk 3/10 · Minor
- Unhealthy air days now
- 2 days/yr
- Unhealthy air days in 30 yrs
- 3 days/yr
Risk factors via First Street. Map © Google.
Why this score? — see what drove the B- grade
The composite is a weighted blend of 9 inputs, each scored 0–100. Each bar is that input's sub-score; the figure is the points it added to the 100-point composite (weight × sub-score).
- Cash flow +30.0/30.0
- 1% rule +10.0/10.0
- DSCR +10.0/10.0
- ARV discount +7.5/15.0
- Rent growth +3.2/5.0
- Livability +2.5/5.0
- Condition / age +2.5/5.0
- Schools +1.4/10.0
- Appreciation +0.0/10.0
$70,000
🖨 Deal sheet 📄 Offer letter ✓ Due diligence
Listing remarks MLS
Garfield Park Neighborhood's most affordable and move-in ready 3 bed 2 full bath home just hit the market! Freshly painted throughout with a spacious living room area, high ceilings and sizeable bedrooms, this home is everything you will want and need! Enjoy a cool evening breeze on your large, covered front porch. Or, hang out in a large private backyard that's fully-fenced and pet-friendly. Convenient parking and storage is offered in a 2 car detached garage! Seller is offering a $5,000 closing credit with a strong and qualified offer!
Key facts
- 6,011 sq ft lot
- 2 garage spots
- Built 1900
Property features AI
Exterior
- Parking: Detached 2-car garage
- Utilities: Public water; Municipal sewer
- Home design: Single-family residence; Two levels
- Construction: Cement siding; Block foundation
- Exterior features: Fenced yard; Less than 1/4 acre lot
Interior
- Kitchen: Kitchen (main level)
- Bedrooms: Three bedrooms (one on the main level, two on the upper level)
- Bathrooms: Two full bathrooms
- Heating & cooling: Forced air heating (natural gas); Central air conditioning
- Interior features: Finished basement; 5 total rooms
- Laundry & utility: No listed laundry appliances
Neighborhood map
What this means for you Summary
Snapshot
- This is a 2-bed/2.0-bath single-family listed at $70k.
Deal economics
- At list price, monthly cash flow is $457 ($5k/yr) — positive.
- The deal already cash-flows at list — no discount required.
- Meets the 1% rule at list price ($1k rent vs $70k).
- Cap rate 14.1% vs local median 4.4% in Indianapolis city (balance) — top-decile yield for the area; either an underpriced asset or a hidden risk that comps aren't pricing in. Stress-test before assuming the spread holds.
Location & tenants
- Location reads: area grade B — affects rentability + tenant quality, not the cash-flow math above.
- Indianapolis Public Schools (urban): math 14% / reading 20% proficiency, ranked #286 of 301 in IN (top 95%) — low school quality limits family demand, transient renter base, plan for 1-2y turnover; 77% free/reduced lunch — lower-income household profile, screen leases tightly.
- Market conditions: Rents rising (+2.9%/yr); 493 active listings in the ZIP; 40 comparable units currently listed for rent nearby; rentals at typical pace (median 22d on market — plan ~3-4 weeks tenant-placement turnaround); 1,906 units permitted in Marion County in 2024 (621 in 5+ unit buildings).
Forward outlook
- Local home prices are declining (-3.0%/yr); year-one equity from $484 of loan paydown is wiped out by about $2k of value loss. Plan a longer hold.
- Marion County population projected at +18% by 2050 — long-run rental-demand tailwind backs the buy-and-hold thesis.
- At projected returns (-3.0% appreciation + 2.9% rent growth), your $20k cash investment doubles in ~5 years — after that, you're playing with house money.
Negotiation context
- Only 7 days on market — expect competitive offers; lowballing is unlikely to land.
- 4 sale attempts since 15y ago with the ask held roughly flat each time — persistent listings suggest the price (not the market) is what's stuck; bring a comps-based counter.
Risks & watch-outs
- Watch-outs: property tax is 2.6% of price; built in 1900 — expect roof / HVAC / electrical / plumbing capex.
Questions for the listing agent
- Built in 1900 — when were the roof, HVAC, electrical panel, plumbing, and water heater last replaced?
- Property tax is high relative to price — has the assessment been appealed recently, and will the sale trigger a re-assessment?
- Is there a deadline driving the sale (1031 exchange, divorce, estate, relocation)? That informs how much negotiation room exists.
- What's the average days-on-market for RENTAL listings here right now (not sales)? A rising rental-DOM trend means longer vacancies and softer asking-rent achievability than the comps imply.
- What's the recent tenant-quality profile in this submarket — average credit score on applications, eviction rate, late-payment / NSF rate, and stable-employment percentage? A property-management company in the area should have these aggregated.
- How much new for-sale + rental construction is in the pipeline within 1–3 miles? Heavy new supply typically softens prices + rents 12–24 months out; constrained supply supports both.
Investment metrics
- 1% rule
- 1.81% ✓
- Cap rate
- 14.13%
- Cash-on-cash
- 28.00%
- DSCR
- 2.25
- GRM
- 4.6
CMA / ARV
- ARV (median comp)
- $162,950
- List price
- $70,000
- Delta
- -57.04%
- Verdict
- UNDERPRICED
- Comps
- 20 within 1.0 mi
Show comp detail 12 sales within ~0.75 mi
| Address | Dist | Beds/Ba | Sqft | Sold | Price | $/sf | Match |
|---|---|---|---|---|---|---|---|
| 1127 E Kelly St | 0.32mi | 2/2.0 | 1,280 (+3%) | 2mo | $185,000 | $145 | 78 |
| 1426 E Bradbury Ave | 0.11mi | 3/2.0 (+1) | 1,320 (+6%) | 1mo | $208,000 | $158 | 78 |
| 1639 Comer Ave | 0.20mi | 3/2.0 (+1) | 1,327 (+7%) | 1mo | $100,000 | $75 | 73 |
| 1518 E Legrande Ave | 0.42mi | 2/2.0 | 1,296 (+4%) | 3mo | $177,000 | $137 | 70 |
| 1532 E Tabor St | 0.28mi | 2/1.0 | 1,305 (+5%) | 7mo | $92,000 | $70 | 68 |
| 1411 E Bradbury Ave | 0.11mi | 3/2.0 (+1) | 1,120 (-10%) | 7mo | $147,500 | $132 | 68 |
| 2845 Tindall St | 0.57mi | 3/1.0 (+1) | 1,200 (-3%) | 3mo | $180,000 | $150 | 56 |
| 1850 E Legrande Ave | 0.59mi | 2/1.0 | 1,344 (+8%) | 1mo | $145,000 | $108 | 54 |
| 2916 Dietz St | 0.67mi | 3/1.0 (+1) | 1,200 (-3%) | 4mo | $160,000 | $133 | 52 |
| 2020 Mac Ct | 0.58mi | 3/1.0 (+1) | 1,314 (+6%) | 4mo | $185,000 | $141 | 50 |
| 2905 Dietz St | 0.65mi | 3/1.0 (+1) | 1,144 (-8%) | 4mo | $150,000 | $131 | 44 |
| 2415 Finley Ave | 0.74mi | 3/1.0 (+1) | 1,148 (-7%) | 3mo | $178,500 | $155 | 41 |
Match score weights: distance 35% · size 25% · config 20% · recency 20%. Top-matched comps best support the ARV.
Projected returns pro-forma
-3.0% appreciation · 2.88% rent growth · sell at horizon
- IRR
- 22.1%
- Equity multiple
- 1.90×
- Total profit
- $17,689
- Equity at exit
- $10,437
- IRR
- 30.1%
- Equity multiple
- 3.68×
- Total profit
- $52,517
- Equity at exit
- $6,052
Cash invested: $19,600 (down + closing). Projections, not guarantees.
Landlord ↔ Tenant lean methodology
- Overall (STATE)
- 90 Strongly Landlord-Friendly
- State Indiana
- 90 Strongly Landlord-Friendly · R+11
- County
- — inherits STATE
- City
- — inherits STATE
ZIP-level market 46203
- Home prices YoY
- -26.7%
- Rents YoY
- 2.9%
- Active inventory
- 493
- Price-to-rent
- 4.6×
Monthly cashflow live
- Estimated rent
- $1,270 high interval (Pro) →
- Mortgage (P&I)
- −$367
- Tax from tax record
- −$150 /mo · $1,799/yr
- Insurance
- −$29
- HOA
- −$0
- Vacancy / Maint / Mgmt
- −$267
- Net cashflow
- $457
Break-even live
UW: 25.0% down · 7.5% · 30yr · 1.5% tax · 5.0% vac · 8.0% maint · 8.0% mgmt
Financing live
Cash to close
- Down payment
- $17,500
- Closing costs
- $2,100
- Reserves months
- —
- Total cash needed
- —
Loan-product check · same deal, 3 products live
Conventional
25% down · 7.5% · 30yr
- Down + closing
- —
- Monthly P&I
- —
- Monthly cashflow
- —
- DSCR
- —
- Eligible?
- —
Personal DTI + credit; lowest rate.
DSCR
20% down · 8.5% · 30yr
- Down + closing
- —
- Monthly P&I
- —
- Monthly cashflow
- —
- DSCR
- —
- Eligible?
- —
No personal income docs; deal must DSCR.
Hard money
10% down · 12.0% · 12mo
- Down + closing
- —
- Monthly P&I
- —
- Monthly cashflow
- —
- DSCR
- —
- Eligible?
- —
Short-term bridge; refi at stabilization.
Rent comps 40 comps
| Address | Beds | Baths | Sqft | Rent | $/sqft | DOM | Units | Dist |
|---|---|---|---|---|---|---|---|---|
| 1637 Hoefgen St Indianapolis, IN | 2.0 | 1.0 | 780 | $1,000 | $1.28 | 43d | 1 | 0.17mi |
| 1604 E Kelly St Indianapolis, IN | 2.0 | 1.0 | 800 | $1,025 | $1.28 | 10d | 1 | 0.24mi |
| 1604 E Kelly St Indianapolis, IN | 2.0 | 1.0 | 750 | $1,025 | $1.37 | 17d | 1 | 0.24mi |
| 1549 Nelson Ave Indianapolis, IN | 3.0 | 1.0 | 950 | $1,380 | $1.45 | 43d | 1 | 0.33mi |
| 2555 Shelby St Unit 2559 Indianapolis, IN | 1.0 | 1.0 | 717 | $1,250 | $1.74 | 43d | 1 | 0.34mi |
| 2469 Dawson St Indianapolis, IN | 2.0 | 1.0 | 700 | $949 | $1.36 | 3d | 4 | 0.34mi |
| 1706 E Tabor St Unit 1708 Indianapolis, IN | 3.0 | 1.0 | 1000 | $1,300 | $1.30 | 7d | 1 | 0.35mi |
| 2020 Boyd Ave Indianapolis, IN | 3.0 | 1.5 | 1160 | $1,450 | $1.25 | 23d | 1 | 0.47mi |
| 2018 Boyd Ave Indianapolis, IN | 3.0 | 1.5 | 1160 | $1,350 | $1.16 | 43d | 1 | 0.47mi |
| 1144 McDougal St Indianapolis, IN | 3.0 | 1.0 | 876 | $1,500 | $1.71 | 21d | 1 | 0.50mi |
| 1011 E Raymond St Indianapolis, IN | 2.0 | 2.0 | 1100 | $1,350 | $1.23 | 23d | 1 | 0.50mi |
| 2633 S Randolph St Indianapolis, IN | 2.0 | 1.0 | 900 | $995 | $1.11 | 10d | 1 | 0.52mi |
| 2633 S Randolph St Unit b Indianapolis, IN | 2.0 | 1.0 | 900 | $995 | $1.11 | 23d | 1 | 0.52mi |
| 2103 Ringgold Ave Indianapolis, IN | 1.0 | 1.0 | 1090 | $775 | $0.71 | 13d | 1 | 0.61mi |
| 2036 Calhoun St Indianapolis, IN | 2.0 | 1.0 | 880 | $1,200 | $1.36 | 7d | 1 | 0.70mi |
| 1861 Barth Ave Unit 1861 Indianapolis, IN | 2.0 | 1.0 | 1300 | $1,600 | $1.23 | 23d | 1 | 0.74mi |
| 2948 Shelby St Unit D Indianapolis, IN | 2.0 | 1.0 | 750 | $1,025 | $1.37 | 43d | 1 | 0.74mi |
| 1742 Thaddeus St Unit 1742-A Indianapolis, IN | 3.0 | 2.0 | 1350 | $1,600 | $1.19 | 13d | 1 | 0.76mi |
| 1815 Dawson St Unit 1815 Indianapolis, IN | 2.0 | 1.0 | 1019 | $999 | $0.98 | 14d | 1 | 0.77mi |
| 1729 Thaddeus St Unit 1729-B Indianapolis, IN | 3.0 | 2.0 | 1350 | $1,600 | $1.19 | 13d | 1 | 0.78mi |
| 2430 E Kelly St Indianapolis, IN | 2.0 | 1.0 | 965 | $949 | $0.98 | 43d | 1 | 0.79mi |
| 2109 Singleton St Indianapolis, IN | 3.0 | 2.0 | 1340 | $2,100 | $1.57 | 7d | 1 | 0.85mi |
| 1637 S State Ave Indianapolis, IN | 2.0 | 1.5 | 816 | $900 | $1.10 | 17d | 1 | 0.88mi |
| 1640 Asbury St Indianapolis, IN | 1.0 | 1.0 | 700 | $850 | $1.21 | 43d | 1 | 0.89mi |
| 1602 Quill St Unit B Indianapolis, IN | 3.0 | 2.0 | 1250 | $1,650 | $1.32 | 14d | 1 | 0.91mi |
| 1602 Quill St Unit B Indianapolis, IN | 3.0 | 2.0 | 1250 | $1,750 | $1.40 | 43d | 1 | 0.91mi |
| 3146 Asbury St Indianapolis, IN | 2.0 | 1.0 | 728 | $850 | $1.17 | 7d | 1 | 0.93mi |
| 1620 E Palmer St Indianapolis, IN | 2.0 | 1.0 | 824 | $1,200 | $1.46 | 23d | 1 | 0.93mi |
| 1543 S State Ave Indianapolis, IN | 2.0 | 1.0 | 1086 | $1,100 | $1.01 | 7d | 1 | 0.94mi |
| 823 Iowa St Indianapolis, IN | 2.0 | 1.0 | 812 | $1,100 | $1.35 | 43d | 1 | 0.94mi |
| 620 E Beecher St Indianapolis, IN | 3.0 | 2.0 | 1072 | $1,639 | $1.53 | 19d | 1 | 0.94mi |
| 2770 South East St Unit 302 Indianapolis, IN | 3.0 | 2.0 | 1158 | $1,015 | $0.88 | 2d | 1 | 0.95mi |
| 2770 S East St Apt 103 Indianapolis, IN | 3.0 | 2.0 | 1190 | $1,045 | $0.88 | 14d | 1 | 0.95mi |
| 2760 S East St Indianapolis, IN | 2.0–3.0 | 2.0 | 1072 | $895 | $0.83 | 3d | 3 | 0.96mi |
| 944 E Minnesota St Indianapolis, IN | 2.0 | 2.0 | 944 | $1,299 | $1.38 | 43d | 1 | 0.96mi |
| 1833 Orleans St Unit 1 Indianapolis, IN | 3.0 | 1.0 | 1260 | $1,350 | $1.07 | 43d | 1 | 0.97mi |
| 2209 Ransdell St Indianapolis, IN | 2.0 | 1.0 | 710 | $900 | $1.27 | 43d | 1 | 0.97mi |
| 1534 Dawson St Indianapolis, IN | 3.0 | 1.0 | 1040 | $1,499 | $1.44 | 23d | 1 | 0.99mi |
| 265 E Southern Ave Indianapolis, IN | 1.0–2.0 | 1.0 | 800 | $1,150 | $1.44 | 2d | 2 | 0.99mi |
| 2236 Ransdell St Indianapolis, IN | 2.0 | 1.0 | 850 | $1,150 | $1.35 | 43d | 1 | 1.00mi |
Listing history 12 events
-
2026-05-11status Pending 516-char remark
-
2026-05-04$70,000 Active 516-char remark
-
2024-03-20soldstatus $142,000 Closed 543-char remark
Show marketing remark (543 chars)
Garfield Park Neighborhood's most affordable and move-in ready 3 bed 2 full bath home just hit the market! Freshly painted throughout with a spacious living room area, high ceilings and sizeable bedrooms, this home is everything you will want and need! Enjoy a cool evening breeze on your large, covered front porch. Or, hang out in a large private backyard that's fully-fenced and pet-friendly. Convenient parking and storage is offered in a 2 car detached garage! Seller is offering a $5,000 closing credit with a strong and qualified offer!
-
2024-02-19status Pending 543-char remark
Show marketing remark (543 chars)
Garfield Park Neighborhood's most affordable and move-in ready 3 bed 2 full bath home just hit the market! Freshly painted throughout with a spacious living room area, high ceilings and sizeable bedrooms, this home is everything you will want and need! Enjoy a cool evening breeze on your large, covered front porch. Or, hang out in a large private backyard that's fully-fenced and pet-friendly. Convenient parking and storage is offered in a 2 car detached garage! Seller is offering a $5,000 closing credit with a strong and qualified offer!
-
2024-02-15$148,000 Active 543-char remark
Show marketing remark (543 chars)
Garfield Park Neighborhood's most affordable and move-in ready 3 bed 2 full bath home just hit the market! Freshly painted throughout with a spacious living room area, high ceilings and sizeable bedrooms, this home is everything you will want and need! Enjoy a cool evening breeze on your large, covered front porch. Or, hang out in a large private backyard that's fully-fenced and pet-friendly. Convenient parking and storage is offered in a 2 car detached garage! Seller is offering a $5,000 closing credit with a strong and qualified offer!
-
2015-03-11status Pending
-
2015-02-27price $56,300
-
2015-02-14$46,300 Active
-
2012-02-20historical
-
2012-02-17soldstatus $17,200
-
2011-12-27$13,900
-
2002-02-08soldstatus $85,120
ⓘ Source: listings_history table (triggers on properties + properties_extension) + one-shot
backfill from property_details.listing_events for pre-trigger history.
Tax reassessment forecast IN · Partial reset (capped growth)
- Current annual tax
- $1,799 · $150/mo
- Projected year-2 tax
- $1,799 · $150/mo
- Expected delta
- $0/yr ($0/mo · 0.0%)
ⓘ Screening estimate from a state-policy table — verify with the county assessor before closing.
Climate risk First Street
- Flood 1/10 Low FEMA zone X (unshaded) · 0% chance over 30 yrs
- Wildfire 1/10 Low
- Heat 4/10 Moderate 7 d/yr ≥101°F today · 19 d/yr by 30 yrs out
- Wind 2/10 Low 0% chance of damaging wind over 30 yrs
- Air quality 3/10 Moderate 2 unhealthy d/yr today · 3 by 30 yrs out
Nearby sold comps map
Loading sold comps map…
Walkable amenities ~0.75 mi
Loading nearby amenities…
Taxation est. · year 1
- Rental income
- $15,243
- − Mortgage interest
- −$3,921
- − Property taxes
- −$1,799
- − Insurance
- −$350
- − Repairs & maintenance
- −$1,219
- − Management
- −$1,219
- − Depreciation
- −$2,036
- Taxable income
- $4,698
- Est. tax owed @ 24.0%
- −$1,127
- After-tax cash flow
- $4,361/yr
For passive investors: Depreciation is non-cash, so a rental often shows a tax loss while cash-flowing — sheltering income. Rental losses are passive: they offset passive income freely, and up to $25,000/yr can offset ordinary (W-2) income if you actively participate and your MAGI is under $100k (phasing out to $0 by $150k); unused losses carry forward. On sale, claimed depreciation is recaptured at up to 25%, and gains may owe capital-gains tax (a 1031 exchange can defer both). Figures are a year-1 estimate at your 24.0% rate — not tax advice; consult a CPA.
Schools (NCES district)
- District
- Indianapolis Public Schools
- NCES district ID
- 1804770
- Math proficiency
- 14% ▼ -7.00%
- Reading proficiency
- 20% ▼ -3.00%
- Median HH income
- $32,034
- Composite
- 13.69/100
- National rank
- #9499
- State rank
- #286 of 301 in IN
Livability — Indianapolis city (balance)
No livability data for this city. (Only ~50 U.S. cities are tracked.)
Census & demographics
- Census place
- Indianapolis city (balance), IN
- County
- Marion County · 998,460 people
- City population
- 881,119
- Metro
- Indianapolis-Carmel-Anderson, IN
- Population (ZIP)
- 37,758
- Household income
- $57,393
- Rent vs Own
- Severe rent burden
- 1499.0
Population outlook (Marion County) Hauer SSP2
- Today (2025)
- 1,025,572 people
- By 2030
- 1,065,727 · +3.9%
- By 2040
- 1,141,577 · +11.3%
- By 2050
- 1,208,920 · +17.9%
- By 2075
- 1,367,288 · +33.3%
- By 2100
- 1,438,201 · +40.2%
Race, ethnicity, and origin ACS 2023
- Neighborhood character
- Predominantly White (69%)
- Race & ethnicity
- White 69% Hispanic / Latino 14% Black 12% Two or more races 8% Asian 2% Native American 1%
- Hispanic origin (detail)
- Mexican 12% Puerto Rican 1%
- Common ancestry
- Slovak 2% Lithuanian 2% Italian 1%
- Foreign-born
- 8% · Canada
- Languages at home
- 88% English-only · Spanish 10% Other Indo-European 1%
Political lean MEDSL · Marion
- 2024 margin
- Strong D (+27.7) · D 63.0% · R 35.3% · Other 1.7%
- 2008→2024 swing
- -0.7pp no change · 2008: 28.4pp · 2024: 27.7pp
- All cycles
- 2024: D+27.7 2020: D+29.1 2016: D+22.8 2012: D+22.2 2008: D+28.4
Not yet ingested
- Civics
- —
Market trends
- HPI YoY
- ▼ -127.37%
- Current HPI
- 349.579
- Rent YoY
- ▲ 2.88%
- Metro
- Indianapolis-Carmel-Anderson, IN
- State GDP YoY
- ▲ 2.90%
- F500 in state
- 18
Industry mix (Fortune 500 HQ in IN)
| Industry | F500 HQs | Revenue |
|---|---|---|
| Industrial Machinery | 2 | $37B |
|
||
| Healthcare | 1 | $177B |
|
||
| Pharmaceuticals | 1 | $45B |
|
||
| Metals / Steel | 1 | $18B |
|
||
| Agriculture | 1 | $17B |
|
||
| Packaging | 1 | $12B |
|
||
Price history
-22.5% since first listed13 events — show timeline
- 2026-05-26 Sold (MLS) $66,000 MIBOR as Distributed by MLS Grid
- 2026-05-11 Pending — MIBOR as Distributed by MLS Grid
- 2026-05-04 Listed $70,000 MIBOR as Distributed by MLS Grid
- 2024-03-20 Sold (MLS) $142,000 MIBOR as Distributed by MLS Grid
- 2024-02-19 Pending — MIBOR as Distributed by MLS Grid
- 2024-02-15 Listed $148,000 MIBOR as Distributed by MLS Grid
- 2015-03-11 Pending — MIBOR as Distributed by MLS Grid
- 2015-02-27 Price Changed $56,300 MIBOR as Distributed by MLS Grid
- 2015-02-14 Listed $46,300 MIBOR as Distributed by MLS Grid
- 2012-02-20 Listing Removed — MIBOR as Distributed by MLS Grid
- 2012-02-17 Sold (MLS) $17,200 MIBOR as Distributed by MLS Grid
- 2011-12-27 Listed $13,900 MIBOR as Distributed by MLS Grid
- 2002-02-08 Sold (Public Records) $85,120 Public Records
Property tax history
+9.8%/yrLatest (2025): $1,799 · +84.6% YoY. Source: county tax records.
Cash-flow waterfall
monthlySold comps — $/sqft
last 12 mo · ≤1 miLoading sold comps…