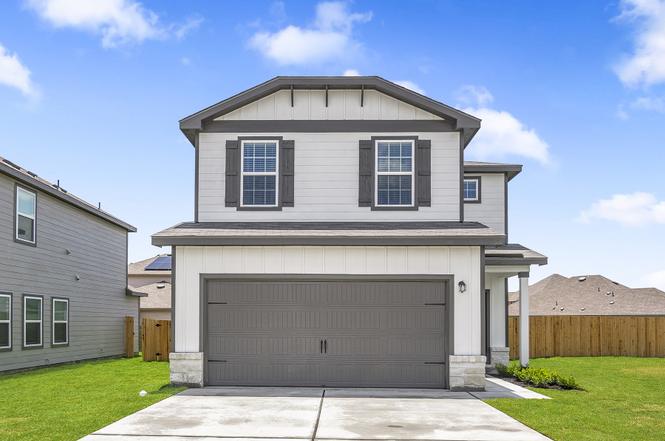
14512 Wahlbergs Way · Elgin, TX
Flood risk No data
- FEMA flood zone
- —
- Chance of flooding over 30 yrs
- —
- Est. flood insurance / yr
- —
Fire risk No data
- Est. fire insurance / yr
- —
Heat risk No data
- Hot days now (above threshold)
- —
- Hot days in 30 yrs
- —
Wind risk No data
- Chance of severe wind over 30 yrs
- —
Air-quality risk No data
- Unhealthy air days now
- —
- Unhealthy air days in 30 yrs
- —
Risk factors via First Street. Map © Google.
Why this score? — see what drove the D grade
The composite is a weighted blend of 9 inputs, each scored 0–100. Each bar is that input's sub-score; the figure is the points it added to the 100-point composite (weight × sub-score).
- Appreciation +10.0/10.0
- Cash flow +9.0/30.0
- ARV discount +7.5/15.0
- Livability +3.7/5.0
- Rent growth +3.3/5.0
- DSCR +2.5/10.0
- Condition / age +2.5/5.0
- 1% rule +2.0/10.0
- Schools +2.0/10.0
$282,900
🖨 Deal sheet 📄 Offer letter ✓ Due diligence
Listing remarks
The beautiful Holly plan is ready for a quick move-in! This spacious home features three large bedrooms, two and a half bathrooms, a roomy family room, and a fully-equipped, chef-inspired kitchen. The open-concept design of the main floor makes it ideal for entertaining, with a seamless flow between the family room, kitchen, and dining area. Whether you're hosting a gathering or enjoying a quiet evening, the layout ensures you’ll always be at the heart of the action, making lasting memories with loved ones.
Key facts
- Open-concept design
- Quick move-in
- Roomy family room
Tags
Property features AI
Finance
- HOA & community: Homeowners association with annual fee; HOA fee covers common area maintenance; Community amenities include barbecue area, common grounds, community mailbox, dog park, internet access, playground, park, street lights, trails/paths, and curbs
Exterior
- Parking: Attached garage; 2 garage spaces (garage faces front); Garage door opener; Concrete driveway; Additional parking for total of 4 spaces; 2 covered parking spaces; Lighted parking
- Security: Smoke detectors; Carbon monoxide detector(s)
- Utilities: Public water; Public sewer; Electricity available; Cable available; Fiber optic available; Phone available; Underground utilities
- Home design: 2-story home; New construction by LGI Homes – Texas, LLC; Faces southeast; Slab foundation
- Construction: Shingle/composition roof; HardiPlank siding; Masonry and concrete elements; Blown-in insulation; Radiant barrier; Insulated attic/crawl hatchway(s); Glass components
- Exterior features: Private yard; Covered front porch; Back yard and front yard; Landscaped; Automatic in-ground sprinklers; Small trees; Fenced back yard with wood fence and gate
Interior
- Kitchen: Granite counters; Galley kitchen with breakfast bar and dining area; Dishwasher; Disposal; Electric range (free-standing); Range hood; Microwave; Plumbed for ice maker; Stainless steel appliances; Exhaust fan; Free-standing refrigerator
- Bedrooms: Bedrooms located on second level
- Flooring: Carpet; Vinyl
- Bathrooms: 2 full bathrooms; 1 half bathroom
- Heating & cooling: Central heating (heat pump, electric); Central air conditioning; Ceiling fan(s); HVAC energy efficient features
- Interior features: Open floorplan; Entrance foyer; Breakfast bar; Pantry; Recessed lighting; Ceiling fan(s); Granite counters; Smart thermostat; Wired for data; High speed internet; Walk-in closet(s); Interior steps
- Laundry & utility: Upper-level laundry room; Washer hookup; Electric dryer hookup
Neighborhood map
What this means for you Summary
Snapshot
- This is a 3-bed/2.5-bath land listed at $283k.
Deal economics
- At list price, monthly cash flow is $-222 ($-3k/yr) — negative.
- To cash-flow at today's rent, offer at most $244k (13.9% below list).
- To meet the 1% rule (rent ≥ 1% of price), the offer needs to be $199k (29.6% below list).
- Recommended offer: $199k (29.6% below list) — sets the bar for 1% rule.
- Cap rate 5.4% vs local median 4.4% in Elgin — meaningfully above typical; check what's discounted (condition, days-on-market, listing class) to confirm the premium yield is real.
Location & tenants
- Location reads 74/100 on livability (#167 in TX, #4,404 nationally) — a middle-class / working-renter tenant base. Strengths: cost of living A+, housing A+, health & safety A+; Watch: schools F, amenities F, commute F.
- Elgin ISD (rural): math 17% / reading 26% proficiency, ranked #741 of 826 in TX (top 90%) — low school quality limits family demand, transient renter base, plan for 1-2y turnover; 67% free/reduced lunch — lower-income household profile, screen leases tightly.
- Market conditions: Rents rising (+3.1%/yr); 807 active listings in the ZIP; 28 comparable units currently listed for rent nearby; rentals at typical pace (median 15d on market — plan ~3-4 weeks tenant-placement turnaround); solid renter incomes; 17,121 units permitted in Travis County in 2024 (11,963 in 5+ unit buildings).
Forward outlook
- In year one you build about $30k of equity ($2k loan paydown + $28k appreciation (10.0% local appreciation)).
- Travis County population projected at +60% by 2050 — long-run rental-demand tailwind backs the buy-and-hold thesis.
- By year 2, paydown + projected appreciation supports a ~$49k cash-out refi (75% LTV) — recoverable capital for the next deal without selling this one.
Negotiation context
- Only 7 days on market — expect competitive offers; lowballing is unlikely to land.
Questions for the listing agent
- What do current leases actually rent for vs. the listed asking? Can we see a recent rent roll and the last 12 months of T-12 income?
- What does the HOA fee cover, when was the last increase, and are there any pending special assessments or reserve-fund shortfalls?
- Is there a deadline driving the sale (1031 exchange, divorce, estate, relocation)? That informs how much negotiation room exists.
- Schools are F-rated, which usually means shorter tenancies and higher turnover. Who's the typical renter profile here, and what's been the actual vacancy rate?
- The area grade is low — what's the realistic commute time and amenity access for the typical tenant pool here? Any planned neighborhood developments (good or bad) we should know about?
- What's the average days-on-market for RENTAL listings here right now (not sales)? A rising rental-DOM trend means longer vacancies and softer asking-rent achievability than the comps imply.
- What's the recent tenant-quality profile in this submarket — average credit score on applications, eviction rate, late-payment / NSF rate, and stable-employment percentage? A property-management company in the area should have these aggregated.
- How much new for-sale + rental construction is in the pipeline within 1–3 miles? Heavy new supply typically softens prices + rents 12–24 months out; constrained supply supports both.
Investment metrics
- 1% rule
- 0.70% ✗
- Cap rate
- 5.35%
- Cash-on-cash
- -3.37%
- DSCR
- 0.85
- GRM
- 11.8
CMA / ARV
No comps found within radius.
Projected returns pro-forma
10.0% appreciation · 3.12% rent growth · sell at horizon
- IRR
- 21.9%
- Equity multiple
- 2.77×
- Total profit
- $140,098
- Equity at exit
- $254,859
- IRR
- 19.7%
- Equity multiple
- 6.35×
- Total profit
- $424,047
- Equity at exit
- $549,612
Cash invested: $79,212 (down + closing). Projections, not guarantees.
Landlord ↔ Tenant lean methodology
- Overall (STATE)
- 87 Strongly Landlord-Friendly
- State Texas
- 87 Strongly Landlord-Friendly · R+5
- County
- — inherits STATE
- City
- — inherits STATE
ZIP-level market 78621
- Home prices YoY
- 7.6%
- Rents YoY
- 3.1%
- Active inventory
- 807
- Price-to-rent
- 11.8×
Monthly cashflow live
- Estimated rent
- $1,991 high interval (Pro) →
- Mortgage (P&I)
- −$1,484
- Tax from tax record
- −$159 /mo · $1,905/yr
- Insurance
- −$118
- HOA
- −$35
- Vacancy / Maint / Mgmt
- −$418
- Net cashflow
- $-222
Break-even live
UW: 25.0% down · 7.5% · 30yr · 1.5% tax · 5.0% vac · 8.0% maint · 8.0% mgmt
Financing live
Cash to close
- Down payment
- $70,725
- Closing costs
- $8,487
- Reserves months
- —
- Total cash needed
- —
Loan-product check · same deal, 3 products live
Conventional
25% down · 7.5% · 30yr
- Down + closing
- —
- Monthly P&I
- —
- Monthly cashflow
- —
- DSCR
- —
- Eligible?
- —
Personal DTI + credit; lowest rate.
DSCR
20% down · 8.5% · 30yr
- Down + closing
- —
- Monthly P&I
- —
- Monthly cashflow
- —
- DSCR
- —
- Eligible?
- —
No personal income docs; deal must DSCR.
Hard money
10% down · 12.0% · 12mo
- Down + closing
- —
- Monthly P&I
- —
- Monthly cashflow
- —
- DSCR
- —
- Eligible?
- —
Short-term bridge; refi at stabilization.
Rent comps 28 comps
| Address | Beds | Baths | Sqft | Rent | $/sqft | DOM | Units | Dist |
|---|---|---|---|---|---|---|---|---|
| 14508 Wahlbergs Way Elgin, TX | 3.0 | 2.0 | 1076 | $2,045 | $1.90 | 11d | 1 | 0.03mi |
| 18300 Speculator Ln Elgin, TX | 4.0 | 2.0 | 1794 | $1,995 | $1.11 | 23d | 1 | 0.11mi |
| 18224 Speculator Ln Elgin, TX | 3.0 | 2.5 | 1599 | $1,700 | $1.06 | 43d | 1 | 0.12mi |
| 18200 Papuan Cv Elgin, TX | 3.0 | 2.0 | 1402 | $1,900 | $1.36 | 3d | 1 | 0.12mi |
| 18316 Stellers Sea St Elgin, TX | 3.0 | 2.0 | 1076 | $2,045 | $1.90 | 19d | 1 | 0.14mi |
| 14141 Prospector Way Elgin, TX | 3.0 | 2.0 | 1520 | $1,650 | $1.09 | 43d | 1 | 0.16mi |
| 14300 Boomtown Way Elgin, TX | 4.0 | 2.0 | 1794 | $2,050 | $1.14 | 23d | 1 | 0.23mi |
| 14101 Prospector Way Unit 14101 Elgin, TX | 4.0 | 2.5 | 2198 | $2,099 | $0.95 | 23d | 1 | 0.23mi |
| 14101 Prospector Way Elgin, TX | 4.0 | 2.5 | 2198 | $2,099 | $0.95 | 43d | 1 | 0.23mi |
| 18500 Allen Welch Dr Elgin, TX | 3.0 | 2.0 | 1525 | $1,825 | $1.20 | 4d | 1 | 0.26mi |
| 18612 Allen Welch Dr Elgin, TX | 4.0 | 2.0 | 1794 | $1,885 | $1.05 | 4d | 1 | 0.32mi |
| 18505 Quiet Range Dr Elgin, TX | 4.0 | 2.0 | 1794 | $1,950 | $1.09 | 23d | 1 | 0.33mi |
| 18505 Quiet Range Dr Unit 18505 Elgin, TX | 4.0 | 2.0 | 1794 | $1,785 | $0.99 | 4d | 1 | 0.33mi |
| 18525 Quiet Range Dr Elgin, TX | 4.0 | 2.0 | 1794 | $1,725 | $0.96 | 17d | 1 | 0.33mi |
| 14421 Prairie Sod Ln Elgin, TX | 3.0 | 2.0 | 1525 | $1,650 | $1.08 | 2d | 1 | 0.36mi |
| 14521 Gurneys Eagle Dr Elgin, TX | 3.0 | 2.0 | 1878 | $1,895 | $1.01 | 1d | 1 | 0.38mi |
| 18721 Quiet Range Dr Elgin, TX | 3.0–5.0 | 2.0–3.5 | 1773 | $2,085 | $1.18 | 1d | 1 | 0.46mi |
| 234 Heritage Mill Trl Elgin, TX | 3.0 | 2.0 | 1530 | $1,850 | $1.21 | 2d | 1 | 0.49mi |
| 107 Tillage Rd Elgin, TX | 3.0 | 2.0 | 1548 | $1,775 | $1.15 | 19d | 1 | 0.51mi |
| 116 Honeybee Ln Elgin, TX | 3.0 | 2.5 | 1782 | $2,000 | $1.12 | 4d | 1 | 0.64mi |
| 242 Barley Ln Elgin, TX | 3.0 | 2.5 | 1782 | $2,150 | $1.21 | 1d | 1 | 0.67mi |
| 19405 Bear Grass Dr Elgin, TX | 3.0 | 2.0 | 1495 | $1,760 | $1.18 | 43d | 1 | 0.81mi |
| 13817 County Line Rd Elgin, TX | 1.0–3.0 | 1.0–2.0 | 937 | $1,890 | $2.02 | 1d | 6 | 0.93mi |
| 101 Bandara Woods Blvd Elgin, TX | 3.0 | 2.0 | 1499 | $1,769 | $1.18 | 14d | 1 | 0.99mi |
| 401 Bandara Woods Blvd Elgin, TX | 3.0 | 2.0 | 1665 | $1,875 | $1.13 | 43d | 1 | 1.11mi |
| 722 Lavaca Loop Elgin, TX | 4.0 | 2.5 | 2075 | $1,895 | $0.91 | 17d | 1 | 1.12mi |
| 419 Gettysburg Loop Elgin, TX | 3.0 | 2.0 | 1565 | $1,850 | $1.18 | 12d | 1 | 1.39mi |
| 18436 Weatherby Ln Elgin, TX | 4.0 | 2.5 | 2095 | $2,000 | $0.95 | 4d | 1 | 1.39mi |
HOA detail
- Monthly dues
- $35 · $420/yr
Listing history 6 events
-
2026-06-18days on market $282,900 Active 7 DOM
-
2026-06-17days on market $282,900 Active 6 DOM
-
2026-06-16days on market $282,900 Active 5 DOM
-
2026-06-15days on market $282,900 Active 4 DOM
-
2026-06-13remarks 512-char remark
-
2026-06-13$282,900 Active 2 DOM
ⓘ Source: listings_history table (triggers on properties + properties_extension) + one-shot
backfill from property_details.listing_events for pre-trigger history.
Tax reassessment forecast TX · Resets to sale price
- Current annual tax
- $1,905 · $159/mo
- Projected year-2 tax
- $5,177 · $431/mo
- Expected delta
- +$3,272/yr (+$273/mo · 171.8%)
ⓘ Screening estimate from a state-policy table — verify with the county assessor before closing.
Nearby sold comps map
Loading sold comps map…
Walkable amenities ~0.75 mi
Loading nearby amenities…
Taxation est. · year 1
- Rental income
- $23,894
- − Mortgage interest
- −$15,847
- − Property taxes
- −$1,905
- − Insurance
- −$1,414
- − Repairs & maintenance
- −$1,912
- − Management
- −$1,912
- − HOA
- −$420
- − Depreciation
- −$8,230
- Taxable loss
- −$7,745
- Est. tax savings @ 24.0%
- +$1,859
- After-tax cash flow
- $-807/yr
For passive investors: Depreciation is non-cash, so a rental often shows a tax loss while cash-flowing — sheltering income. Rental losses are passive: they offset passive income freely, and up to $25,000/yr can offset ordinary (W-2) income if you actively participate and your MAGI is under $100k (phasing out to $0 by $150k); unused losses carry forward. On sale, claimed depreciation is recaptured at up to 25%, and gains may owe capital-gains tax (a 1031 exchange can defer both). Figures are a year-1 estimate at your 24.0% rate — not tax advice; consult a CPA.
Schools (NCES district)
- District
- Elgin ISD
- NCES district ID
- 4818360
- Math proficiency
- 17% ▼ -9.00%
- Reading proficiency
- 26% ▼ -5.00%
- Median HH income
- $55,176
- Composite
- 19.62/100
- National rank
- #8749
- State rank
- #741 of 826 in TX
Livability — Elgin
- Score
- 74/100
- State rank
- #167
- US rank
- #4404
Category grades
Schools grade is shown separately in the Schools card above.
Census & demographics
- Census place
- Elgin, TX
- County
- Bastrop County · 68,601 people
- City population
- 27,860
- Metro
- Austin-Round Rock-Georgetown, TX
- Population (ZIP)
- 30,411
- Household income
- $98,534
- Rent vs Own
- Severe rent burden
- 235.0
Population outlook (Travis County) Hauer SSP2
- Today (2025)
- 1,545,133 people
- By 2030
- 1,729,269 · +11.9%
- By 2040
- 2,097,596 · +35.8%
- By 2050
- 2,463,890 · +59.5%
- By 2075
- 3,249,374 · +110.3%
- By 2100
- 3,801,868 · +146.1%
Race, ethnicity, and origin ACS 2023
- Neighborhood character
- Diverse neighborhood (Simpson 0.64)
- Race & ethnicity
- Hispanic / Latino 46% White 38% Two or more races 19% Black 11% Native American 1%
- Hispanic origin (detail)
- Mexican 38%
- Common ancestry
- Slovak 2% Italian 2% Romanian 1%
- Foreign-born
- 17% · Canada, Vietnam
- Languages at home
- 63% English-only · Spanish 36%
Political lean MEDSL · Travis
- 2024 margin
- Solid D (+39.3) · D 68.8% · R 29.4% · Other 1.8%
- 2008→2024 swing
- +9.9pp toward D · 2008: 29.4pp · 2024: 39.3pp
- All cycles
- 2024: D+39.3 2020: D+45.0 2016: D+38.9 2012: D+23.9 2008: D+29.4
Not yet ingested
- Civics
- —
Market trends
- HPI YoY
- ▲ 29.47%
- Current HPI
- 416.87
- Rent YoY
- ▲ 3.12%
- Metro
- Austin-Round Rock-Georgetown, TX
- State GDP YoY
- ▲ 3.95%
- F500 in state
- 110
Industry mix (Fortune 500 HQ in TX)
| Industry | F500 HQs | Revenue |
|---|---|---|
| Energy | 16 | $1,198B |
|
||
| Technology | 5 | $198B |
|
||
| Engineering / Construction | 4 | $72B |
|
||
| Energy Services | 3 | $60B |
|
||
| Utilities | 3 | $41B |
|
||
| Healthcare | 2 | $330B |
|
||
Price history
1 event — show timeline
- 2026-06-11 Listed $282,900 Unlock MLS
Property tax history
+0.0%/yrLatest (2026): $1,905 · +0.0% YoY. Source: county tax records.
Cash-flow waterfall
monthlySold comps — $/sqft
last 12 mo · ≤1 miLoading sold comps…