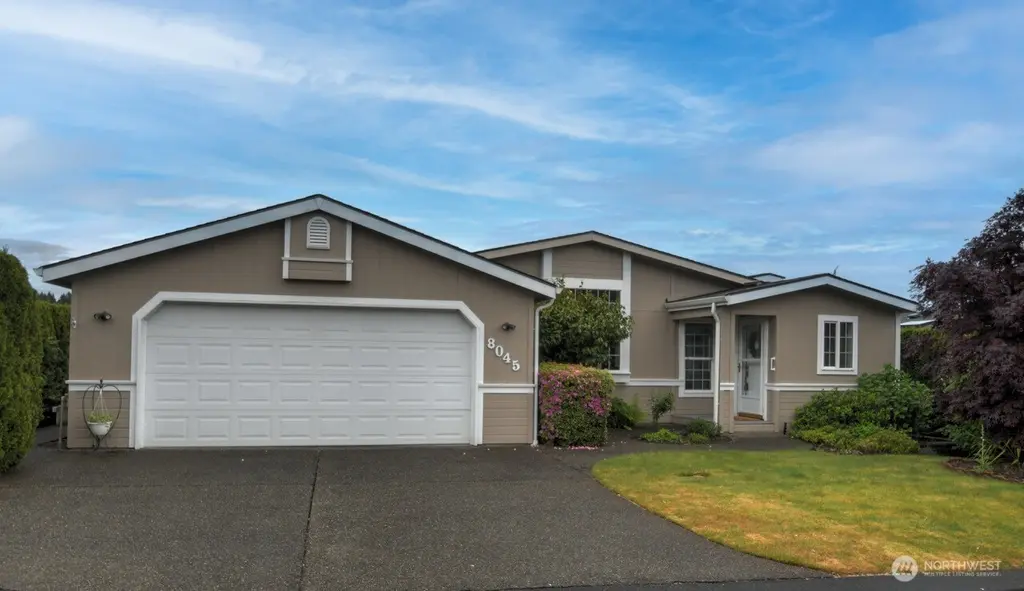
8045 18th Ln SE · Lacey, WA
Flood risk 1/10 · Minimal
- FEMA flood zone
- X (unshaded)
- Chance of flooding over 30 yrs
- 0.0%
- Est. flood insurance / yr
- $507 – $1,088
Fire risk 4/10 · Minor
- Est. fire insurance / yr
- $604 – $1,122
Heat risk 3/10 · Minor
- Hot days now (above 88°F)
- 7 days/yr
- Hot days in 30 yrs
- 15 days/yr
Wind risk 1/10 · Minimal
- Chance of severe wind over 30 yrs
- —
Air-quality risk 6/10 · Moderate
- Unhealthy air days now
- 7 days/yr
- Unhealthy air days in 30 yrs
- 8 days/yr
Risk factors via First Street. Map © Google.
Why this score? — see what drove the C+ grade
The composite is a weighted blend of 9 inputs, each scored 0–100. Each bar is that input's sub-score; the figure is the points it added to the 100-point composite (weight × sub-score).
- Cash flow +23.1/30.0
- ARV discount +11.4/15.0
- DSCR +7.4/10.0
- 1% rule +5.7/10.0
- Schools +5.1/10.0
- Livability +4.2/5.0
- Rent growth +3.4/5.0
- Condition / age +2.5/5.0
- Appreciation +0.0/10.0
$245,900
🖨 Deal sheet 📄 Offer letter ✓ Due diligence
Listing remarks
Welcome to Laurel Oaks, the desirable 55+ gated community where carefree living meets everyday comfort. This beautifully maintained 1,971 square foot triple wide MH features three bedrooms, two bathrooms, and a floor plan that is ideal for casual living or entertaining. Rich wood floors enhance the main living areas, while new carpets add a plush feel to the bedrooms. The living room greets all who enter with cheery natural light from a wall of windows, and a gas fireplace provides warmth and ambiance. An expansive kitchen is at the center of the home, featuring abundant cabinets, a walk in pantry, and casual counter seating. All the appliances are included. The kitchen opens to the family
Key facts
- Gated community
- Rich wood floors
- Covered patio
Tags
Property features AI
Finance
- Other: Calculated living area: 1971 square feet; Structure type: Manufactured house; Direction faces: North
- Financial info: Land lease: $866; Listing terms: Cash or Conventional
- HOA & community: Laurel Oaks manufactured home park (park approved for sale); Park amenities: BBQ areas, clubhouse, common area, exercise room, high-speed internet available, RV parking, security gate; 148 homes in park; Senior community
Exterior
- Parking: Individual garage (garage included)
- Security: Security gate
- Utilities: Public water; Public sewer; PSE electric; Comcast cable and internet
- Home design: Manufactured triple-wide home (Silvercrest); One level; North-facing; Very good condition
- Construction: Wood construction; Composition roof; Manufactured after 6/15/1976; Mobile home remains
- Exterior features: Wood products siding; Patio/porch/deck; Paved lot
Interior
- Kitchen: Dishwasher; Microwave; Refrigerator; Stove/Range; Kitchen with eating space
- Bedrooms: 3 bedrooms
- Flooring: Ceramic tile; Hardwood; Vinyl; Carpet
- Bathrooms: 2 full bathrooms; 2 bathtubs; 2 showers
- Heating & cooling: Forced air heating (high efficiency); Heat pump cooling; Natural gas energy source
- Interior features: Fireplace (gas); Water heater (gas, located in hallway closet); Skylights; Vaulted ceilings; Jetted/soaking tub; Walk-in closet; Walk-in pantry; Ceiling fans; Landscaped
- Laundry & utility: Washer; Dryer; Utility room
Neighborhood map
What this means for you Summary
Snapshot
- This is a 3-bed/2.0-bath manufactured listed at $246k.
Deal economics
- At list price, monthly cash flow is $443 ($5k/yr) — positive.
- The deal already cash-flows at list — no discount required.
- Meets the 1% rule at list price ($3k rent vs $246k).
- Recommended offer: $242k (1.5% below list) — sets the bar for market timing.
- Cap rate 8.5% vs local median 3.0% in Lacey — top-decile yield for the area; either an underpriced asset or a hidden risk that comps aren't pricing in. Stress-test before assuming the spread holds.
Location & tenants
- Location reads 85/100 on livability (#33 in WA, #581 nationally) — a professional / high-income tenant draw. Strengths: amenities A+, commute A+, housing A+; Watch: cost of living D+.
- North Thurston Public Schools (suburban): math 51% / reading 62% proficiency, ranked #80 of 291 in WA (top 28%) — acceptable for families but not a draw, mixed tenant base, ~2y average lease.
- Market conditions: Rents rising (+3.6%/yr); 190 active listings in the ZIP; 12 comparable units currently listed for rent nearby; rentals lingering (median 44d on market — plan ~5-8 weeks vacancy on turnover, expect pricing pressure); 75% of comp listings sitting > 30 days — soft ceiling on asking rent; solid renter incomes; 1,222 units permitted in Thurston County in 2024 (508 in 5+ unit buildings).
- This rent runs 35% of the median local income ($89k/yr) — at the standard rent-burdened threshold; future hikes will face affordability resistance.
Forward outlook
- Local home prices are declining (-3.0%/yr); year-one equity from $2k of loan paydown is wiped out by about $7k of value loss. Plan a longer hold.
- Thurston County population projected at +27% by 2050 — long-run rental-demand tailwind backs the buy-and-hold thesis.
Negotiation context
- It's been on market 22 days — a 2% lower offer ($242k) is reasonable based on typical stale-listing flexibility.
Questions for the listing agent
- Is there a deadline driving the sale (1031 exchange, divorce, estate, relocation)? That informs how much negotiation room exists.
- Schools are B-rated — typically a magnet for longer-tenancy family renters. What's the average tenant stay here, and is there a school-zone premium baked into asking?
- What's the average days-on-market for RENTAL listings here right now (not sales)? A rising rental-DOM trend means longer vacancies and softer asking-rent achievability than the comps imply.
- What's the recent tenant-quality profile in this submarket — average credit score on applications, eviction rate, late-payment / NSF rate, and stable-employment percentage? A property-management company in the area should have these aggregated.
- How much new for-sale + rental construction is in the pipeline within 1–3 miles? Heavy new supply typically softens prices + rents 12–24 months out; constrained supply supports both.
Investment metrics
- 1% rule
- 1.07% ✓
- Cap rate
- 8.45%
- Cash-on-cash
- 7.72%
- DSCR
- 1.34
- GRM
- 7.8
CMA / ARV
- ARV (median comp)
- $269,211
- List price
- $245,900
- Delta
- -8.66%
- Verdict
- FAIR
- Comps
- 20 within 1.0 mi
Show comp detail 12 sales within ~0.75 mi
| Address | Dist | Beds/Ba | Sqft | Sold | Price | $/sf | Match |
|---|---|---|---|---|---|---|---|
| 8045 18th Ln SE | 0.00mi | 3/2.0 | 1,971 (0%) | 0mo | $245,900 | $125 | 100 |
| 8041 18th Ln SE #102 | 0.01mi | 2/2.0 (-1) | 2,036 (+3%) | 12mo | $285,000 | $140 | 79 |
| 8203 18th Ln SE #46 | 0.12mi | 2/2.0 (-1) | 2,050 (+4%) | 8mo | $240,000 | $117 | 76 |
| 1815 Sorrel Ln SE #119 | 0.05mi | 2/2.0 (-1) | 2,080 (+6%) | 10mo | $265,000 | $127 | 76 |
| 1936 Daylily Ln SE #37 | 0.15mi | 2/2.0 (-1) | 2,050 (+4%) | 8mo | $294,950 | $144 | 74 |
| 8117 20th Ln SE #23 | 0.11mi | 2/2.0 (-1) | 2,050 (+4%) | 11mo | $300,000 | $146 | 74 |
| 1820 Daylily Ln SE #42 | 0.14mi | 2/2.0 (-1) | 2,050 (+4%) | 16mo | $285,000 | $139 | 68 |
| 1924 Sorrel Ln SE | 0.06mi | 3/2.0 | 1,716 (-13%) | 10mo | $275,000 | $160 | 67 |
| 1823 Cranberry Ln SE | 0.04mi | 2/2.0 (-1) | 1,676 (-15%) | 2mo | $190,000 | $113 | 67 |
| 1933 Windflower Ln SE | 0.10mi | 3/2.0 | 1,720 (-13%) | 11mo | $246,000 | $143 | 65 |
| 1929 Daylily Ln SE | 0.13mi | 2/2.0 (-1) | 2,124 (+8%) | 16mo | $281,000 | $132 | 63 |
| 1822 Cranberry Ln SE #82 | 0.06mi | 2/2.0 (-1) | 2,240 (+14%) | 15mo | $279,900 | $125 | 57 |
Match score weights: distance 35% · size 25% · config 20% · recency 20%. Top-matched comps best support the ARV.
Projected returns pro-forma
-3.0% appreciation · 3.56% rent growth · sell at horizon
- IRR
- -3.9%
- Equity multiple
- 0.85×
- Total profit
- $-10,149
- Equity at exit
- $36,664
- IRR
- 6.4%
- Equity multiple
- 1.49×
- Total profit
- $33,642
- Equity at exit
- $21,261
Cash invested: $68,852 (down + closing). Projections, not guarantees.
Landlord ↔ Tenant lean methodology
- Overall (STATE)
- 28 Tenant-Leaning
- State Washington
- 28 Tenant-Leaning · D+8
- County
- — inherits STATE
- City
- — inherits STATE
ZIP-level market 98503
- Rents YoY
- 3.6%
- Active inventory
- 190
- Price-to-rent
- 7.8×
Monthly cashflow live
- Estimated rent
- $2,621 high interval (Pro) →
- Mortgage (P&I)
- −$1,290
- Tax from tax record
- −$236 /mo · $2,831/yr
- Insurance
- −$102
- HOA
- −$0
- Vacancy / Maint / Mgmt
- −$551
- Net cashflow
- $443
Break-even live
UW: 25.0% down · 7.5% · 30yr · 1.5% tax · 5.0% vac · 8.0% maint · 8.0% mgmt
Financing live
Cash to close
- Down payment
- $61,475
- Closing costs
- $7,377
- Reserves months
- —
- Total cash needed
- —
Loan-product check · same deal, 3 products live
Conventional
25% down · 7.5% · 30yr
- Down + closing
- —
- Monthly P&I
- —
- Monthly cashflow
- —
- DSCR
- —
- Eligible?
- —
Personal DTI + credit; lowest rate.
DSCR
20% down · 8.5% · 30yr
- Down + closing
- —
- Monthly P&I
- —
- Monthly cashflow
- —
- DSCR
- —
- Eligible?
- —
No personal income docs; deal must DSCR.
Hard money
10% down · 12.0% · 12mo
- Down + closing
- —
- Monthly P&I
- —
- Monthly cashflow
- —
- DSCR
- —
- Eligible?
- —
Short-term bridge; refi at stabilization.
Rent comps 12 comps
| Address | Beds | Baths | Sqft | Rent | $/sqft | DOM | Units | Dist |
|---|---|---|---|---|---|---|---|---|
| 8107 26th Ave SE Lacey, WA | 3.0 | 2.5 | 1594 | $2,295 | $1.44 | 44d | 1 | 0.44mi |
| 8420 13th Ave SE Olympia, WA | 3.0 | 2.5 | 2164 | $2,800 | $1.29 | 44d | 1 | 0.48mi |
| 2712 Mayes Rd SE Lacey, WA | 3.0 | 2.5 | 1763 | $2,495 | $1.42 | 21d | 1 | 0.49mi |
| 2732 Hidden Springs Loop SE Unit 1 Olympia, WA | 3.0 | 2.5 | 1778 | $2,595 | $1.46 | 44d | 1 | 0.53mi |
| 1446 Laredo Dr SE Olympia, WA | 3.0 | 3.0 | 1828 | $2,700 | $1.48 | 14d | 1 | 1.02mi |
| 8936 28th Way SE Olympia, WA | 4.0 | 2.5 | 2188 | $3,100 | $1.42 | 44d | 1 | 1.13mi |
| 7509 38th Dr SE Lacey, WA | 3.0 | 2.5 | 1800 | $2,695 | $1.50 | 44d | 1 | 1.32mi |
| 716 Kinwood Ct SE Lacey, WA | 3.0 | 2.0 | 1256 | $2,495 | $1.99 | 44d | 1 | 1.33mi |
| 8400 Ostrom Ave SE Lacey, WA | 4.0 | 2.5 | 2251 | $3,250 | $1.44 | 44d | 1 | 1.34mi |
| 2134 Diamond Loop SE Lacey, WA | 4.0 | 3.0 | 2582 | $2,795 | $1.08 | 44d | 1 | 1.38mi |
| 7325 39th Ct SE Lacey, WA | 3.0 | 2.0 | 1676 | $2,695 | $1.61 | 21d | 1 | 1.48mi |
| 8545 Oxford Ave SE Lacey, WA | 3.0 | 2.5 | 1572 | $2,400 | $1.53 | 44d | 1 | 1.50mi |
Listing history 7 events
-
2026-06-07statusdays on market $245,900 Pending 22 DOM
-
2026-06-03days on market $245,900 Active 20 DOM
-
2026-06-02days on market $245,900 Active 19 DOM
-
2026-06-01days on market $245,900 Active 18 DOM
-
2026-05-31days on market $245,900 Active 17 DOM
-
2026-05-30days on market $245,900 Active 16 DOM
-
2026-05-14$245,900 Active
ⓘ Source: listings_history table (triggers on properties + properties_extension) + one-shot
backfill from property_details.listing_events for pre-trigger history.
Tax reassessment forecast WA · Resets to sale price
- Current annual tax
- $2,831 · $236/mo
- Projected year-2 tax
- $2,831 · $236/mo
- Expected delta
- $0/yr ($0/mo · 0.0%)
ⓘ Screening estimate from a state-policy table — verify with the county assessor before closing.
Climate risk First Street
- Flood 1/10 Low FEMA zone X (unshaded) · 0% chance over 30 yrs
- Wildfire 4/10 Moderate
- Heat 3/10 Moderate 7 d/yr ≥88°F today · 15 d/yr by 30 yrs out
- Wind 1/10 Low
- Air quality 6/10 Major 7 unhealthy d/yr today · 8 by 30 yrs out
Nearby sold comps map
Loading sold comps map…
Walkable amenities ~0.75 mi
Loading nearby amenities…
Taxation est. · year 1
- Rental income
- $31,457
- − Mortgage interest
- −$13,774
- − Property taxes
- −$2,831
- − Insurance
- −$1,230
- − Repairs & maintenance
- −$2,517
- − Management
- −$2,517
- − Depreciation
- −$7,153
- Taxable income
- $1,436
- Est. tax owed @ 24.0%
- −$345
- After-tax cash flow
- $4,972/yr
For passive investors: Depreciation is non-cash, so a rental often shows a tax loss while cash-flowing — sheltering income. Rental losses are passive: they offset passive income freely, and up to $25,000/yr can offset ordinary (W-2) income if you actively participate and your MAGI is under $100k (phasing out to $0 by $150k); unused losses carry forward. On sale, claimed depreciation is recaptured at up to 25%, and gains may owe capital-gains tax (a 1031 exchange can defer both). Figures are a year-1 estimate at your 24.0% rate — not tax advice; consult a CPA.
Schools (NCES district)
- District
- North Thurston Public Schools
- NCES district ID
- 5305850
- Math proficiency
- 51% ▬ 0.00%
- Reading proficiency
- 62% ▬ 0.00%
- Median HH income
- $62,338
- Composite
- 51.09/100
- National rank
- #3798
- State rank
- #80 of 291 in WA
Livability — Lacey
- Score
- 85/100
- State rank
- #33
- US rank
- #581
Category grades
Schools grade is shown separately in the Schools card above.
Census & demographics
- County
- Thurston County · 269,345 people
- City population
- 108,850
- Metro
- Olympia-Lacey-Tumwater, WA
- Population (ZIP)
- 41,656
- Household income
- $89,002
- Rent vs Own
- Severe rent burden
- 2195.0
Population outlook (Thurston County) Hauer SSP2
- Today (2025)
- 308,239 people
- By 2030
- 326,483 · +5.9%
- By 2040
- 359,890 · +16.8%
- By 2050
- 391,800 · +27.1%
- By 2075
- 468,024 · +51.8%
- By 2100
- 519,890 · +68.7%
Race, ethnicity, and origin ACS 2023
- Neighborhood character
- Diverse neighborhood (Simpson 0.56)
- Race & ethnicity
- White 65% Two or more races 12% Hispanic / Latino 12% Asian 7% Black 5% Pacific Islander 2% Native American 1%
- Hispanic origin (detail)
- Mexican 8% Puerto Rican 1%
- Common ancestry
- Portuguese 4% Slovak 3% Lithuanian 3%
- Foreign-born
- 10% · Canada, Vietnam, South Korea
- Languages at home
- 82% English-only · Spanish 6% German/W. Germanic 3% Other Asian/Pacific 2%
Political lean MEDSL · Thurston
- 2024 margin
- Strong D (+20.4) · D 58.5% · R 38.1% · Other 3.5%
- 2008→2024 swing
- -1.3pp toward R · 2008: 21.7pp · 2024: 20.4pp
- All cycles
- 2024: D+20.4 2020: D+18.6 2016: D+15.4 2012: D+19.0 2008: D+21.7
Not yet ingested
- Civics
- —
Market trends
- HPI YoY
- ▼ -385.93%
- Current HPI
- 361.0974
- Rent YoY
- ▲ 3.56%
- Metro
- Olympia-Lacey-Tumwater, WA
- State GDP YoY
- ▲ 4.65%
- F500 in state
- 22
Industry mix (Fortune 500 HQ in WA)
| Industry | F500 HQs | Revenue |
|---|---|---|
| Retail | 2 | $269B |
|
||
| Technology / Retail | 1 | $638B |
|
||
| Technology | 1 | $245B |
|
||
| Telecommunications | 1 | $38B |
|
||
| Food / Beverage | 1 | $36B |
|
||
| Automotive / Trucks | 1 | $34B |
|
||
Price history
2 events — show timeline
- 2026-06-05 Pending — NWMLS as Distributed by MLS Grid
- 2026-05-14 Listed $245,900 NWMLS as Distributed by MLS Grid
Property tax history
+3.1%/yrLatest (2026): $2,831 · +1.2% YoY. Source: county tax records.
Cash-flow waterfall
monthlySold comps — $/sqft
last 12 mo · ≤1 miLoading sold comps…