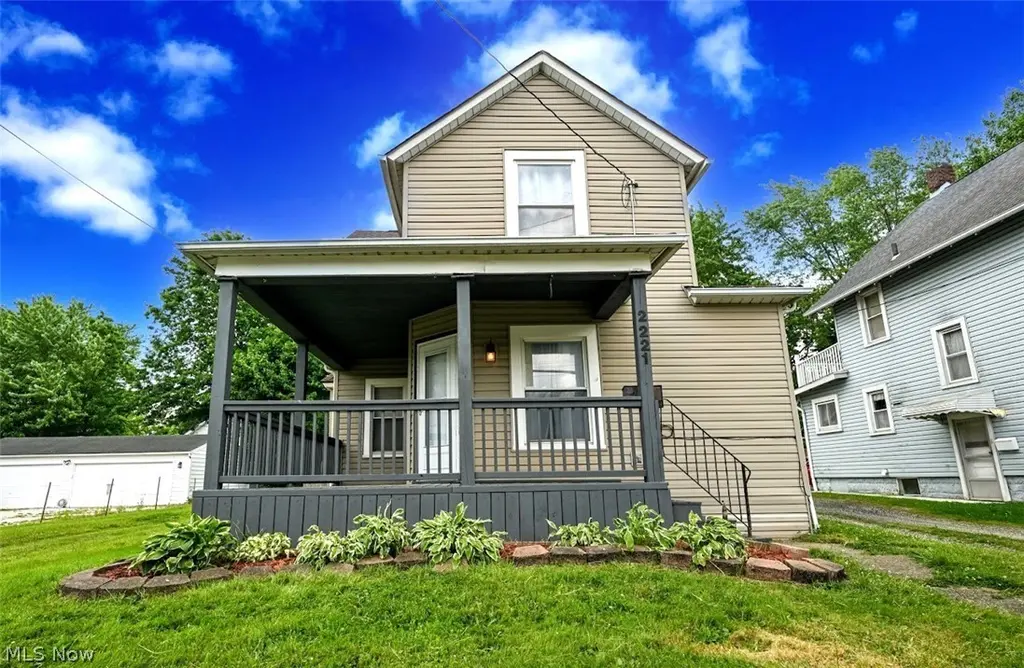
2221 9th St SW · Akron, OH
Flood risk 1/10 · Minimal
- FEMA flood zone
- X (unshaded)
- Chance of flooding over 30 yrs
- 0.0%
- Est. flood insurance / yr
- $473 – $860
Fire risk 1/10 · Minimal
- Est. fire insurance / yr
- $713 – $1,323
Heat risk 3/10 · Minor
- Hot days now (above 96°F)
- 7 days/yr
- Hot days in 30 yrs
- 17 days/yr
Wind risk 1/10 · Minimal
- Chance of severe wind over 30 yrs
- —
Air-quality risk 2/10 · Minimal
- Unhealthy air days now
- 0 days/yr
- Unhealthy air days in 30 yrs
- 1 days/yr
Risk factors via First Street. Map © Google.
Why this score? — see what drove the B grade
The composite is a weighted blend of 9 inputs, each scored 0–100. Each bar is that input's sub-score; the figure is the points it added to the 100-point composite (weight × sub-score).
- Cash flow +30.0/30.0
- DSCR +10.0/10.0
- 1% rule +9.0/10.0
- ARV discount +9.0/15.0
- Livability +4.0/5.0
- Rent growth +3.5/5.0
- Condition / age +2.5/5.0
- Schools +2.1/10.0
- Appreciation +0.0/10.0
$94,900
🖨 Deal sheet 📄 Offer letter ✓ Due diligence
Listing remarks
* Kenmore Beauty ~ On A DOUBLE LOT, With 2 Driveways, A 2 Car Garage, Fenced In Yard Area W/ Firepit For More Private Gatherings Or Pets & A NEW WRAP AROUND COVERED PORCH * * 1,292 Sq. Ft. Includes 3 Bdrms & 1.5 Bathrms! Full Bathrm On Main Floor! * NEW CENTRAL AIR AND FURNACE 2024 * New White Exterior Doors * Newer Electric Panel * 1st Floor Laundry & Mud Rm * Walk In To A Living Rm W/ Fresh Modern Paint, White Trim, Ceiling Fan & Newer Gray Modern Carpet * LUXURY PLANK FLOORING Throughout * Dedicated Formal Dining Rm W/ Ceiling Fan & Bay Window To Enjoy Family Dinners All The Time. This Could Also Be A Family Rm If Wanted! * Large Kitchen W/ LVP Flo
Key facts
- Fenced in yard area
- Two driveways
- Firepit
Tags
Property features AI
Finance
- Financial info: Annual tax amount listed (2025)
Exterior
- Parking: Detached 2-car garage; Driveway access
- Utilities: Public water; Public sewer
- Home design: Two-story home; Above-grade finished living area approximately 1,292 (source: assessor)
- Construction: Aluminum siding; Asphalt/fiberglass shingle roof; Year built per public records
- Exterior features: Lot recorded at approximately 0.1188 acres
Interior
- Bedrooms: Total of 10 rooms (bedrooms included) — see room layout for specifics
- Bathrooms: One full bathroom; One half bathroom; One bathroom located on the main level
- Heating & cooling: Forced air heating (gas); Central air conditioning
- Interior features: Updated/remodeled condition; Unfinished basement
- Laundry & utility: Main-level laundry
Neighborhood map
What this means for you Summary
Snapshot
- This is a 3-bed/1.5-bath single-family listed at $95k.
Deal economics
- At list price, monthly cash flow is $434 ($5k/yr) — positive.
- The deal already cash-flows at list — no discount required.
- Meets the 1% rule at list price ($1k rent vs $95k).
- Cap rate 11.8% vs local median 6.6% in Akron — top-decile yield for the area; either an underpriced asset or a hidden risk that comps aren't pricing in. Stress-test before assuming the spread holds.
Location & tenants
- Location reads 81/100 on livability (#104 in OH, #1,591 nationally) — a professional / high-income tenant draw. Strengths: amenities A+, commute A+, cost of living A+; Watch: crime F, employment F.
- Akron City (urban): math 22% / reading 30% proficiency, ranked #602 of 656 in OH (top 92%) — low school quality limits family demand, transient renter base, plan for 1-2y turnover; 66% free/reduced lunch — lower-income household profile, screen leases tightly.
- Market conditions: Rents rising (+3.9%/yr); 104 active listings in the ZIP; 29 comparable units currently listed for rent nearby; rentals at typical pace (median 24d on market — plan ~3-4 weeks tenant-placement turnaround); 1,114 units permitted in Summit County in 2024 (397 in 5+ unit buildings).
- This rent runs 34% of the median local income ($47k/yr) — at the standard rent-burdened threshold; future hikes will face affordability resistance.
Forward outlook
- Local home prices are declining (-3.0%/yr); year-one equity from $656 of loan paydown is wiped out by about $3k of value loss. Plan a longer hold.
- Summit County population projected to shrink 6% by 2050 — rents likely to lag national; underwrite the cash flow, not the appreciation.
- At projected returns (-3.0% appreciation + 3.9% rent growth), your $27k cash investment doubles in ~6 years — after that, you're playing with house money.
Negotiation context
- Only 3 days on market — expect competitive offers; lowballing is unlikely to land.
Risks & watch-outs
- Watch-outs: built in 1884 — expect roof / HVAC / electrical / plumbing capex.
Questions for the listing agent
- Built in 1884 — when were the roof, HVAC, electrical panel, plumbing, and water heater last replaced?
- Is there a deadline driving the sale (1031 exchange, divorce, estate, relocation)? That informs how much negotiation room exists.
- Crime grade is F in this area — have there been break-ins, vandalism, or insurance claims at this property in the last 3 years? What carrier currently insures it and at what premium?
- What's the average days-on-market for RENTAL listings here right now (not sales)? A rising rental-DOM trend means longer vacancies and softer asking-rent achievability than the comps imply.
- What's the recent tenant-quality profile in this submarket — average credit score on applications, eviction rate, late-payment / NSF rate, and stable-employment percentage? A property-management company in the area should have these aggregated.
- How much new for-sale + rental construction is in the pipeline within 1–3 miles? Heavy new supply typically softens prices + rents 12–24 months out; constrained supply supports both.
Investment metrics
- 1% rule
- 1.40% ✓
- Cap rate
- 11.78%
- Cash-on-cash
- 19.59%
- DSCR
- 1.87
- GRM
- 6.0
CMA / ARV
- ARV (on-the-fly)
- $98,192
- Comps found
- 12
Show comp detail 12 sales within ~0.75 mi
| Address | Dist | Beds/Ba | Sqft | Sold | Price | $/sf | Match |
|---|---|---|---|---|---|---|---|
| 2186 5th St SW | 0.20mi | 3/1.0 | 1,288 (-0%) | 5mo | $82,000 | $64 | 84 |
| 2134 7th St SW | 0.19mi | 3/2.0 | 1,256 (-3%) | 4mo | $95,000 | $76 | 82 |
| 600 Florida Ave | 0.25mi | 3/1.5 | 1,368 (+6%) | 4mo | $120,000 | $88 | 76 |
| 2342 16th St SW | 0.46mi | 4/1.0 (+1) | 1,303 (+1%) | 2mo | $77,000 | $59 | 69 |
| 575 Flora Ave | 0.42mi | 3/2.0 | 1,208 (-6%) | 3mo | $120,000 | $99 | 65 |
| 773 Montana Ave | 0.27mi | 3/1.5 | 1,128 (-13%) | 4mo | $83,000 | $74 | 63 |
| 2351 13th St SW | 0.32mi | 3/1.0 | 1,142 (-12%) | 2mo | $55,000 | $48 | 62 |
| 2083 17th St SW | 0.51mi | 3/1.0 | 1,175 (-9%) | 4mo | $114,000 | $97 | 56 |
| 962 Iona Ave | 0.59mi | 3/1.0 | 1,443 (+12%) | 2mo | $132,000 | $91 | 49 |
| 780 Silvercrest Ave | 0.50mi | 3/1.0 | 1,109 (-14%) | 3mo | $140,000 | $126 | 49 |
| 918 Silvercrest Ave | 0.60mi | 3/1.0 | 1,152 (-11%) | 5mo | $80,000 | $69 | 48 |
| 603 Indian Trl | 0.66mi | 3/1.0 | 1,100 (-15%) | 2mo | $83,000 | $75 | 41 |
Match score weights: distance 35% · size 25% · config 20% · recency 20%. Top-matched comps best support the ARV.
Projected returns pro-forma
-3.0% appreciation · 3.91% rent growth · sell at horizon
- IRR
- 12.6%
- Equity multiple
- 1.51×
- Total profit
- $13,468
- Equity at exit
- $14,150
- IRR
- 22.2%
- Equity multiple
- 2.97×
- Total profit
- $52,403
- Equity at exit
- $8,205
Cash invested: $26,572 (down + closing). Projections, not guarantees.
Landlord ↔ Tenant lean methodology
- Overall (STATE)
- 73 Landlord-Friendly
- State Ohio
- 73 Landlord-Friendly · R+6
- County
- — inherits STATE
- City
- — inherits STATE
ZIP-level market 44314
- Rents YoY
- 3.9%
- Active inventory
- 104
- Price-to-rent
- 6.0×
Monthly cashflow live
- Estimated rent
- $1,327 high interval (Pro) →
- Mortgage (P&I)
- −$498
- Tax from tax record
- −$78 /mo · $930/yr
- Insurance
- −$40
- HOA
- −$0
- Vacancy / Maint / Mgmt
- −$279
- Net cashflow
- $434
Break-even live
UW: 25.0% down · 7.5% · 30yr · 1.5% tax · 5.0% vac · 8.0% maint · 8.0% mgmt
Financing live
Cash to close
- Down payment
- $23,725
- Closing costs
- $2,847
- Reserves months
- —
- Total cash needed
- —
Loan-product check · same deal, 3 products live
Conventional
25% down · 7.5% · 30yr
- Down + closing
- —
- Monthly P&I
- —
- Monthly cashflow
- —
- DSCR
- —
- Eligible?
- —
Personal DTI + credit; lowest rate.
DSCR
20% down · 8.5% · 30yr
- Down + closing
- —
- Monthly P&I
- —
- Monthly cashflow
- —
- DSCR
- —
- Eligible?
- —
No personal income docs; deal must DSCR.
Hard money
10% down · 12.0% · 12mo
- Down + closing
- —
- Monthly P&I
- —
- Monthly cashflow
- —
- DSCR
- —
- Eligible?
- —
Short-term bridge; refi at stabilization.
Rent comps 29 comps
| Address | Beds | Baths | Sqft | Rent | $/sqft | DOM | Units | Dist |
|---|---|---|---|---|---|---|---|---|
| 720 Florida Ave Akron, OH | 4.0 | 1.0 | 1124 | $1,500 | $1.33 | 14d | 1 | 0.07mi |
| 2250 11th St SW Akron, OH | 3.0 | 1.0 | 1308 | $1,350 | $1.03 | 14d | 1 | 0.14mi |
| 2222 12th St SW Akron, OH | 3.0 | 1.5 | 1270 | $1,050 | $0.83 | 43d | 1 | 0.19mi |
| 2160 12th St SW Akron, OH | 3.0 | 1.0 | 1445 | $1,300 | $0.90 | 43d | 1 | 0.22mi |
| 2163 13th St SW Akron, OH | 3.0 | 2.5 | 1480 | $1,150 | $0.78 | 43d | 1 | 0.24mi |
| 773 Montana Ave Akron, OH | 3.0 | 1.5 | 1128 | $1,195 | $1.06 | 23d | 1 | 0.27mi |
| 721 Polk Ave Akron, OH | 3.0 | 1.5 | 1500 | $1,600 | $1.07 | 23d | 1 | 0.31mi |
| 2211 18th St SW Akron, OH | 3.0 | 1.0 | 1332 | $1,250 | $0.94 | 14d | 1 | 0.49mi |
| 2139 18th St SW Akron, OH | 2.0 | 1.0 | 992 | $1,100 | $1.11 | 43d | 1 | 0.52mi |
| 875 Harrison Ave Akron, OH | 3.0 | 1.0 | 1157 | $1,150 | $0.99 | 14d | 1 | 0.53mi |
| 1029 Harpster Ave Akron, OH | 4.0 | 1.0 | 1403 | $1,250 | $0.89 | 14d | 1 | 0.60mi |
| 527 Brady Ave Akron, OH | 3.0 | 1.5 | 1416 | $1,395 | $0.99 | 43d | 1 | 0.75mi |
| 760 Lakewood Blvd Akron, OH | 3.0 | 2.0 | 1398 | $1,150 | $0.82 | 23d | 1 | 0.88mi |
| 960 Jason Ave Akron, OH | 3.0 | 1.5 | 935 | $1,095 | $1.17 | 21d | 1 | 0.89mi |
| 2138 East Ave Akron, OH | 3.0 | 1.0 | 990 | $1,100 | $1.11 | 23d | 1 | 0.99mi |
| 1138 Kohler Ave Akron, OH | 3.0 | 1.0 | 1000 | $1,250 | $1.25 | 14d | 1 | 1.10mi |
| 1292 W Wilbeth Rd Akron, OH | 3.0 | 1.0 | 1248 | $1,200 | $0.96 | 21d | 1 | 1.11mi |
| 1304 Kellogg Ave Akron, OH | 2.0 | 2.0 | 1148 | $2,000 | $1.74 | 14d | 1 | 1.12mi |
| 1127 Victory St Unit 1129 Akron, OH | 3.0 | 1.0 | 1368 | $950 | $0.69 | 43d | 1 | 1.21mi |
| 36 W Wilbeth Rd Akron, OH | 3.0 | 1.0 | 1382 | $1,150 | $0.83 | 14d | 1 | 1.31mi |
| 1171 La Croix Ave Unit 2 Akron, OH | 2.0 | 1.0 | 1267 | $975 | $0.77 | 43d | 1 | 1.35mi |
| 1453 Woodbirch Ave Akron, OH | 3.0 | 2.0 | 1008 | $1,500 | $1.49 | 43d | 1 | 1.36mi |
| 1455 Woodbirch Ave Akron, OH | 3.0 | 2.0 | 1008 | $1,500 | $1.49 | 21d | 1 | 1.36mi |
| 1161 La Croix Ave Akron, OH | 3.0 | 1.0 | 1452 | $1,200 | $0.83 | 23d | 1 | 1.36mi |
| 1313 Manchester Rd Akron, OH | 3.0 | 1.0 | 1221 | $1,200 | $0.98 | 21d | 1 | 1.39mi |
| 685 Longview Ave Akron, OH | 3.0 | 1.0 | 1100 | $1,150 | $1.05 | 43d | 1 | 1.42mi |
| 44 E Brookside Ave Akron, OH | 2.0 | 1.0 | 1762 | $900 | $0.51 | 14d | 1 | 1.43mi |
| 67 E Archwood Ave Unit A Akron, OH | 2.0 | 1.0 | 1000 | $850 | $0.85 | 43d | 1 | 1.49mi |
| 67 E Archwood Ave Unit B Akron, OH | 4.0 | 1.0 | 1200 | $1,050 | $0.88 | 43d | 1 | 1.49mi |
Listing history 4 events
-
2026-06-13statusdays on market $94,900 Pending 3 DOM
-
2026-06-10days on market $94,900 Active 2 DOM
-
2026-06-09remarks 679-char remark
-
2026-06-09$94,900 Active 1 DOM
ⓘ Source: listings_history table (triggers on properties + properties_extension) + one-shot
backfill from property_details.listing_events for pre-trigger history.
Tax reassessment forecast OH · Partial reset (capped growth)
- Current annual tax
- $930 · $78/mo
- Projected year-2 tax
- $1,205 · $100/mo
- Expected delta
- +$275/yr (+$23/mo · 29.6%)
ⓘ Screening estimate from a state-policy table — verify with the county assessor before closing.
Climate risk First Street
- Flood 1/10 Low FEMA zone X (unshaded) · 0% chance over 30 yrs
- Wildfire 1/10 Low
- Heat 3/10 Moderate 7 d/yr ≥96°F today · 17 d/yr by 30 yrs out
- Wind 1/10 Low
- Air quality 2/10 Low 0 unhealthy d/yr today · 1 by 30 yrs out
Nearby sold comps map
Loading sold comps map…
Walkable amenities ~0.75 mi
Loading nearby amenities…
Taxation est. · year 1
- Rental income
- $15,926
- − Mortgage interest
- −$5,316
- − Property taxes
- −$930
- − Insurance
- −$474
- − Repairs & maintenance
- −$1,274
- − Management
- −$1,274
- − Depreciation
- −$2,761
- Taxable income
- $3,897
- Est. tax owed @ 24.0%
- −$935
- After-tax cash flow
- $4,270/yr
For passive investors: Depreciation is non-cash, so a rental often shows a tax loss while cash-flowing — sheltering income. Rental losses are passive: they offset passive income freely, and up to $25,000/yr can offset ordinary (W-2) income if you actively participate and your MAGI is under $100k (phasing out to $0 by $150k); unused losses carry forward. On sale, claimed depreciation is recaptured at up to 25%, and gains may owe capital-gains tax (a 1031 exchange can defer both). Figures are a year-1 estimate at your 24.0% rate — not tax advice; consult a CPA.
Schools (NCES district)
- District
- Akron City
- NCES district ID
- 3904348
- Math proficiency
- 22% ▼ -17.00%
- Reading proficiency
- 30% ▼ -12.00%
- Median HH income
- $33,811
- Composite
- 21.31/100
- National rank
- #8383
- State rank
- #602 of 656 in OH
Livability — Akron
- Score
- 81/100
- State rank
- #104
- US rank
- #1591
Category grades
Schools grade is shown separately in the Schools card above.
Census & demographics
- Census place
- Akron, OH
- County
- Summit County · 440,783 people
- City population
- 174,375
- Metro
- Akron, OH
- Population (ZIP)
- 17,885
- Household income
- $47,468
- Rent vs Own
- Severe rent burden
- 975.0
Population outlook (Summit County) Hauer SSP2
- Today (2025)
- 546,583 people
- By 2030
- 544,028 · -0.5%
- By 2040
- 531,363 · -2.8%
- By 2050
- 514,923 · -5.8%
- By 2075
- 481,765 · -11.9%
- By 2100
- 432,265 · -20.9%
Race, ethnicity, and origin ACS 2023
- Neighborhood character
- Predominantly White (69%)
- Race & ethnicity
- White 69% Black 16% Two or more races 12% Hispanic / Latino 3% Asian 3%
- Common ancestry
- Slovak 2% Romanian 2% Lithuanian 1%
- Foreign-born
- 3% · India, Canada, Philippines
- Languages at home
- 96% English-only · Chinese 2% Russian/Polish/Slavic 1% Spanish 1%
Political lean MEDSL · Summit
- 2024 margin
- Lean D (+7.0) · D 53.0% · R 46.0%
- 2008→2024 swing
- -9.6pp toward R · 2008: 16.6pp · 2024: 7.0pp
- All cycles
- 2024: D+7.0 2020: D+9.6 2016: D+8.2 2012: D+14.8 2008: D+16.6
Not yet ingested
- Civics
- —
Market trends
- HPI YoY
- ▼ -166.61%
- Current HPI
- 151.066
- Rent YoY
- ▲ 3.91%
- Metro
- Akron, OH
- State GDP YoY
- ▲ 1.98%
- F500 in state
- 48
Industry mix (Fortune 500 HQ in OH)
| Industry | F500 HQs | Revenue |
|---|---|---|
| Insurance | 3 | $145B |
|
||
| Industrial Machinery | 3 | $49B |
|
||
| Financial Services | 3 | $24B |
|
||
| Consumer Goods | 2 | $93B |
|
||
| Aerospace / Defense | 2 | $47B |
|
||
| Utilities | 2 | $33B |
|
||
Price history
1 event — show timeline
- 2026-06-08 Listed $94,900 MLSNOW
Property tax history
+5.5%/yrLatest (2025): $930 · -2.1% YoY. Source: county tax records.
Cash-flow waterfall
monthlySold comps — $/sqft
last 12 mo · ≤1 miLoading sold comps…