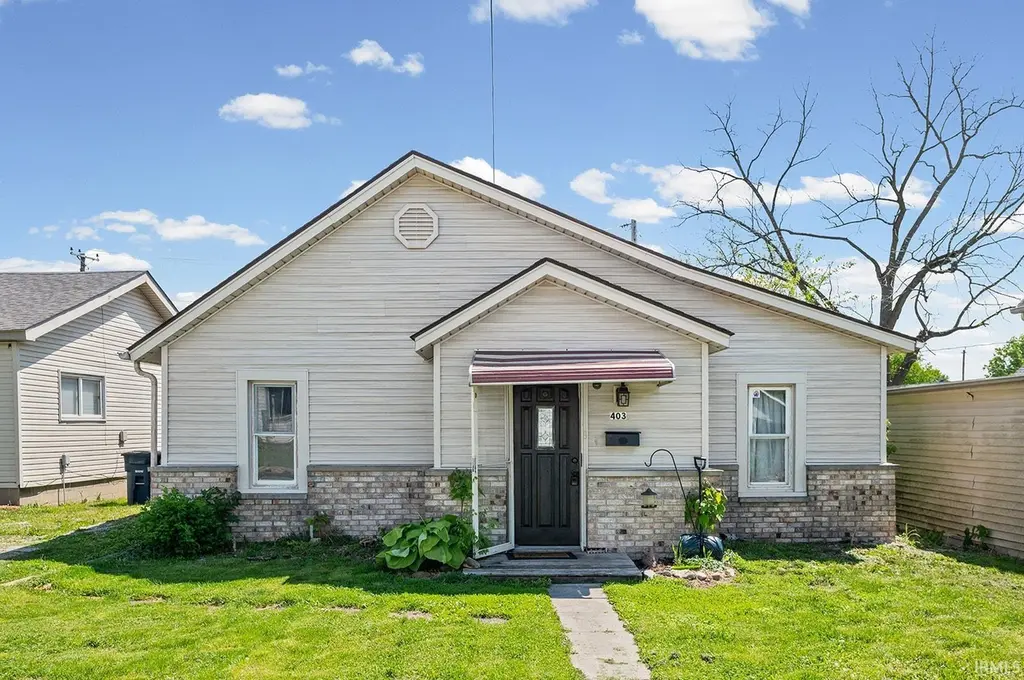
403 Beard St · Frankfort, IN
Flood risk 1/10 · Minimal
- FEMA flood zone
- X (unshaded)
- Chance of flooding over 30 yrs
- 0.0%
- Est. flood insurance / yr
- $507 – $1,088
Fire risk 1/10 · Minimal
- Est. fire insurance / yr
- $717 – $1,331
Heat risk 3/10 · Minor
- Hot days now (above 101°F)
- 7 days/yr
- Hot days in 30 yrs
- 18 days/yr
Wind risk 2/10 · Minimal
- Chance of severe wind over 30 yrs
- —
Air-quality risk 3/10 · Minor
- Unhealthy air days now
- 2 days/yr
- Unhealthy air days in 30 yrs
- 3 days/yr
Risk factors via First Street. Map © Google.
Why this score? — see what drove the C- grade
The composite is a weighted blend of 9 inputs, each scored 0–100. Each bar is that input's sub-score; the figure is the points it added to the 100-point composite (weight × sub-score).
- Cash flow +17.5/30.0
- ARV discount +15.0/15.0
- DSCR +5.5/10.0
- 1% rule +4.2/10.0
- Livability +3.7/5.0
- Rent growth +2.5/5.0
- Condition / age +2.5/5.0
- Schools +2.4/10.0
- Appreciation +0.0/10.0
$115,000
🖨 Deal sheet (PDF) 📄 Offer letter ✓ Due diligence
Listing remarks
Charming 3 bedroom home in Frankfort offering a warm and inviting layout with thoughtful features throughout. The spacious dining room showcases built-in bookshelves and durable laminate flooring, creating both function and character. A comfortable living room provides easy access to the deck, perfect for relaxing or entertaining during the summer months. Outside, you will find a fully fenced backyard along with an oversized one-car detached garage and additional street parking for guests.
Key facts
- Built-in bookshelves
- 5,837 sq ft lot
- Garage
Tags
Property features AI
Exterior
- Parking: Detached garage; Approximately 1.5 garage spaces; Off-street parking
- Security: Smoke detectors
- Utilities: Public water; Public sewer; Electric water heater
- Home design: Single-family residence; Site-built home; One story
- Construction: Vinyl siding; Wood siding; Crawl space foundation; Built as site-built construction
- Exterior features: Deck; Covered porch; Porch; Landscaped lot; Lake frontage
Interior
- Kitchen: Gas cooktop and gas range; Dishwasher; Refrigerator; Disposal; Exhaust fan; Laminate counters
- Bedrooms: Total of 7 rooms (bedroom count not specified)
- Flooring: Not specified
- Bathrooms: 1 full bathroom (main level)
- Heating & cooling: Forced air heating; Central air conditioning; Ceiling fans
- Interior features: Ceiling fans; Laminate countertops; Disposal; Dishwasher; Refrigerator; Gas cooktop; Exhaust fan; Gas range; Electric water heater
- Laundry & utility: Electric dryer hookup on the main level
Neighborhood map
What this means for you Summary
Snapshot
- This is a 3-bed/1.0-bath single-family listed at $115k.
Deal economics
- At list price, monthly cash flow is $88 ($1k/yr) — positive.
- The deal already cash-flows at list — no discount required.
- To meet the 1% rule (rent ≥ 1% of price), the offer needs to be $106k (8.2% below list).
- Recommended offer: $106k (8.2% below list) — sets the bar for 1% rule.
- Cap rate 7.2% vs local median 3.9% in Frankfort — top-decile yield for the area; either an underpriced asset or a hidden risk that comps aren't pricing in. Stress-test before assuming the spread holds.
Location & tenants
- Location reads 73/100 on livability (#107 in IN) — a middle-class / working-renter tenant base. Strengths: crime A+, cost of living A+, housing A+; Watch: amenities F, commute F, employment D-.
- Community Schools Of Frankfort (rural): math 27% / reading 30% proficiency, ranked #251 of 301 in IN (top 83%) — low school quality limits family demand, transient renter base, plan for 1-2y turnover; 68% free/reduced lunch — lower-income household profile, screen leases tightly.
- Zoned schools: Suncrest Elementary School (math 35% / reading 29%, grade F, #652 of 994 statewide, top 68%, 560 students, 85% FRL); Frankfort Middle School (math 19% / reading 27%, grade F, #263 of 330 statewide, top 80%, 706 students, 83% FRL); Frankfort High School (math 8% / reading 42%, grade F, #323 of 369 statewide, top 88%, 895 students, 75% FRL).
- Market conditions: 129 active listings in the ZIP; 12 comparable units currently listed for rent nearby; rentals at typical pace (median 14d on market — plan ~3-4 weeks tenant-placement turnaround); 59 units permitted in Clinton County in 2024 (0 in 5+ unit buildings).
Forward outlook
- Local home prices are declining (-3.0%/yr); year-one equity from $795 of loan paydown is wiped out by about $3k of value loss. Plan a longer hold.
- Clinton County population projected at -15% by 2050 — secular population decline; favor cash flow + early exit over multi-decade hold.
Negotiation context
- It's been on market 17 days — a 2% lower offer ($113k) is reasonable based on typical stale-listing flexibility.
- 5 sale attempts since 12y ago; this cycle's ask has dropped $25k (18%) from the opening price — seller is motivated, your offer sets the floor, not the list.
- Current owner paid $66k; list at $115k implies a 73% gain — meaningful room to come down on a strong offer.
Risks & watch-outs
- Watch-outs: built in 1880 — expect roof / HVAC / electrical / plumbing capex.
Questions for the listing agent
- Built in 1880 — when were the roof, HVAC, electrical panel, plumbing, and water heater last replaced?
- Is there a deadline driving the sale (1031 exchange, divorce, estate, relocation)? That informs how much negotiation room exists.
- Schools are F-rated, which usually means shorter tenancies and higher turnover. Who's the typical renter profile here, and what's been the actual vacancy rate?
- What's the average days-on-market for RENTAL listings here right now (not sales)? A rising rental-DOM trend means longer vacancies and softer asking-rent achievability than the comps imply.
- What's the recent tenant-quality profile in this submarket — average credit score on applications, eviction rate, late-payment / NSF rate, and stable-employment percentage? A property-management company in the area should have these aggregated.
- How much new for-sale + rental construction is in the pipeline within 1–3 miles? Heavy new supply typically softens prices + rents 12–24 months out; constrained supply supports both.
Investment metrics
- 1% rule
- 0.92% ✗
- Cap rate
- 7.21%
- Cash-on-cash
- 3.27%
- DSCR
- 1.15
- GRM
- 9.1
CMA / ARV
- ARV (median comp)
- $145,015
- List price
- $115,000
- Delta
- -20.70%
- Verdict
- UNDERPRICED
- Comps
- 20 within 1.0 mi
Show comp detail 12 sales within ~0.75 mi
| Address | Dist | Beds/Ba | Sqft | Sold | Price | $/sf | Match |
|---|---|---|---|---|---|---|---|
| 521 N Young St | 0.08mi | 2/1.0 (-1) | 1,204 (-2%) | 6mo | $176,000 | $146 | 82 |
| 1303 E Ohio St | 0.13mi | 3/1.0 | 1,120 (-9%) | 2mo | $195,000 | $174 | 78 |
| 405 Beard St | 0.01mi | 3/1.0 | 1,368 (+11%) | 5mo | $179,900 | $132 | 77 |
| 1455 E Ohio St | 0.16mi | 3/1.0 | 1,112 (-10%) | 1mo | $193,900 | $174 | 75 |
| 359 Center Dr | 0.44mi | 3/1.0 | 1,248 (+1%) | 5mo | $198,000 | $159 | 73 |
| 1259 E Washington St | 0.19mi | 3/2.0 | 1,148 (-7%) | 6mo | $211,000 | $184 | 70 |
| 1501 E Walnut St | 0.35mi | 3/1.0 | 1,176 (-5%) | 8mo | $230,000 | $196 | 69 |
| 600 N Crescent Dr | 0.46mi | 3/1.0 | 1,152 (-7%) | 4mo | $190,000 | $165 | 64 |
| 609 Maple Dr | 0.62mi | 2/2.0 (-1) | 1,196 (-3%) | 1mo | $215,000 | $180 | 56 |
| 261 N Crescent Dr | 0.36mi | 2/1.0 (-1) | 1,083 (-12%) | 2mo | $100,000 | $92 | 56 |
| 700 Mapleleaf Dr | 0.44mi | 3/2.0 | 1,050 (-15%) | 5mo | $210,000 | $200 | 47 |
| 855 E Boone St | 0.58mi | 4/2.0 (+1) | 1,064 (-14%) | 0mo | $313,000 | $294 | 41 |
Match score weights: distance 35% · size 25% · config 20% · recency 20%. Top-matched comps best support the ARV.
Projected returns pro-forma
-3.0% appreciation · 3.0% rent growth · sell at horizon
- IRR
- -11.2%
- Equity multiple
- 0.59×
- Total profit
- $-13,067
- Equity at exit
- $17,147
- IRR
- -1.9%
- Equity multiple
- 0.87×
- Total profit
- $-4,246
- Equity at exit
- $9,943
Cash invested: $32,200 (down + closing). Projections, not guarantees.
Landlord ↔ Tenant lean methodology
- Overall (STATE)
- 90 Strongly Landlord-Friendly
- State Indiana
- 90 Strongly Landlord-Friendly · R+11
- County
- — inherits STATE
- City
- — inherits STATE
ZIP-level market 46041
- Home prices YoY
- -17.8%
- Active inventory
- 129
- Price-to-rent
- 9.1×
Monthly cashflow live
- Estimated rent
- $1,056 high interval (Pro) →
- Mortgage (P&I)
- −$603
- Tax from tax record
- −$96 /mo · $1,148/yr
- Insurance
- −$48
- HOA
- −$0
- Vacancy / Maint / Mgmt
- −$222
- Net cashflow
- $88
Break-even live
Sensitivity live
| Price | -10% $153 | -5% $120 | +0% $88 | +5% $55 | +10% $23 |
|---|---|---|---|---|---|
| Rent | -10% $4 | -5% $46 | +0% $88 | +5% $129 | +10% $171 |
| Rate | -1.0pp $146 | -0.5pp $117 | base $88 | +0.5pp $58 | +1.0pp $28 |
UW: 25.0% down · 7.5% · 30yr · 1.5% tax · 5.0% vac · 8.0% maint · 8.0% mgmt
Financing live
Cash to close
- Down payment
- $28,750
- Closing costs
- $3,450
- Reserves months
- —
- Total cash needed
- —
Loan-product check · same deal, 3 products live
Conventional
25% down · 7.5% · 30yr
- Down + closing
- —
- Monthly P&I
- —
- Monthly cashflow
- —
- DSCR
- —
- Eligible?
- —
Personal DTI + credit; lowest rate.
DSCR
20% down · 8.5% · 30yr
- Down + closing
- —
- Monthly P&I
- —
- Monthly cashflow
- —
- DSCR
- —
- Eligible?
- —
No personal income docs; deal must DSCR.
Hard money
10% down · 12.0% · 12mo
- Down + closing
- —
- Monthly P&I
- —
- Monthly cashflow
- —
- DSCR
- —
- Eligible?
- —
Short-term bridge; refi at stabilization.
Rent comps 12 comps
| Address | Beds | Baths | Sqft | Rent | $/sqft | DOM | Units | Dist |
|---|---|---|---|---|---|---|---|---|
| 402 E Green St Frankfort, IN | 3.0 | 1.0 | 1100 | $1,000 | $0.91 | 45d | 1 | 0.62mi |
| 701 Stone Ridge Dr Frankfort, IN | 1.0–3.0 | 1.0–2.0 | 860 | $1,200 | $1.40 | 14d | 5 | 0.65mi |
| 350 N Main St Unit 3C Frankfort, IN | 2.0 | 2.0 | 970 | $1,200 | $1.24 | 6d | 1 | 0.76mi |
| 1152 N Jackson St Frankfort, IN | 2.0 | 1.0 | 950 | $1,049 | $1.10 | 14d | 1 | 0.83mi |
| 1152 N Jackson St Unit 2 Frankfort, IN | 2.0 | 1.0 | 950 | $1,049 | $1.10 | 16d | 1 | 0.83mi |
| 501 S Main St Unit 2 Frankfort, IN | 3.0 | 1.0 | 700 | $850 | $1.21 | 22d | 1 | 0.87mi |
| 201 W Palmer St Frankfort, IN | 2.0 | 1.0 | 850 | $990 | $1.16 | 5d | 1 | 0.89mi |
| 201 W Palmer St Frankfort, IN | 2.0 | 1.0 | 950 | $1,049 | $1.10 | 45d | 1 | 0.89mi |
| 201 W Palmer St Frankfort, IN | 2.0 | 1.0 | 950 | $1,049 | $1.10 | 14d | 1 | 0.89mi |
| 458 W Clinton St Unit 02 Frankfort, IN | 2.0 | 1.0 | 780 | $725 | $0.93 | 6d | 1 | 0.99mi |
| 1052 John St Frankfort, IN | 3.0 | 1.0 | 900 | $1,395 | $1.55 | 15d | 1 | 1.03mi |
| 1053 S Jackson St Frankfort, IN | 1.0–2.0 | 1.0 | 850 | $995 | $1.17 | 14d | 2 | 1.05mi |
Listing history 8 events
-
2026-05-18price $115,000 494-char remark
-
2026-05-13status Active 494-char remark
-
2026-05-11status Pending 494-char remark
-
2026-05-01$140,000 Active 494-char remark
-
2017-07-14soldstatus $66,500
-
2017-02-13$67,900
-
2016-04-22$66,000
-
2014-11-17$71,000
ⓘ Source: listings_history table (triggers on properties + properties_extension) + one-shot
backfill from property_details.listing_events for pre-trigger history.
Tax reassessment forecast IN · Partial reset (capped growth)
- Current annual tax
- $1,148 · $96/mo
- Projected year-2 tax
- $1,148 · $96/mo
- Expected delta
- $0/yr ($0/mo · 0.0%)
ⓘ Screening estimate from a state-policy table — verify with the county assessor before closing.
Climate risk First Street
- Flood 1/10 Low FEMA zone X (unshaded) · 0% chance over 30 yrs
- Wildfire 1/10 Low
- Heat 3/10 Moderate 7 d/yr ≥101°F today · 18 d/yr by 30 yrs out
- Wind 2/10 Low
- Air quality 3/10 Moderate 2 unhealthy d/yr today · 3 by 30 yrs out
Nearby sold comps map
Loading sold comps map…
Walkable amenities ~0.75 mi
Loading nearby amenities…
Taxation est. · year 1
- Rental income
- $12,673
- − Mortgage interest
- −$6,442
- − Property taxes
- −$1,148
- − Insurance
- −$575
- − Repairs & maintenance
- −$1,014
- − Management
- −$1,014
- − Depreciation
- −$3,345
- Taxable loss
- −$865
- Est. tax savings @ 24.0%
- +$208
- After-tax cash flow
- $1,259/yr
For passive investors: Depreciation is non-cash, so a rental often shows a tax loss while cash-flowing — sheltering income. Rental losses are passive: they offset passive income freely, and up to $25,000/yr can offset ordinary (W-2) income if you actively participate and your MAGI is under $100k (phasing out to $0 by $150k); unused losses carry forward. On sale, claimed depreciation is recaptured at up to 25%, and gains may owe capital-gains tax (a 1031 exchange can defer both). Figures are a year-1 estimate at your 24.0% rate — not tax advice; consult a CPA.
Schools (NCES district)
- District
- Community Schools Of Frankfort
- NCES district ID
- 1803660
- Math proficiency
- 27% ▼ -3.00%
- Reading proficiency
- 30% ▼ -6.00%
- Median HH income
- $42,144
- Composite
- 24.2/100
- National rank
- #7728
- State rank
- #251 of 301 in IN
Livability — Frankfort
- Score
- 73/100
- State rank
- #107
- US rank
- #5623
Category grades
Schools grade is shown separately in the Schools card above.
Census & demographics
- Census place
- Frankfort, IN
- Population (ZIP)
- 23,359
Population outlook (Clinton County) Hauer SSP2
- Today (2025)
- 31,197 people
- By 2030
- 30,257 · -3.0%
- By 2040
- 28,383 · -9.0%
- By 2050
- 26,644 · -14.6%
- By 2075
- 23,858 · -23.5%
- By 2100
- 22,236 · -28.7%
Race, ethnicity, and origin ACS 2023
- Neighborhood character
- Predominantly White (73%)
- Race & ethnicity
- White 73% Hispanic / Latino 24% Two or more races 11%
- Hispanic origin (detail)
- Mexican 22%
- Common ancestry
- Iranian 1% Italian 1% Slovak 1%
- Foreign-born
- 11% · Canada, Philippines
- Languages at home
- 86% English-only · Spanish 14%
Political lean MEDSL · Clinton
- 2024 margin
- Solid R (+48.0) · D 25.2% · R 73.2% · Other 1.6%
- 2008→2024 swing
- -35.0pp toward R · 2008: -13.0pp · 2024: -48.0pp
- All cycles
- 2024: R+48.0 2020: R+46.1 2016: R+48.0 2012: R+30.7 2008: R+13.0
Not yet ingested
- Civics
- —
Market trends
- HPI YoY
- ▼ -57.02%
- Current HPI
- 263.2258
- Rent YoY
- —
- Metro
- —
- State GDP YoY
- ▲ 2.90%
- F500 in state
- 18
Industry mix (Fortune 500 HQ in IN)
| Industry | F500 HQs | Revenue |
|---|---|---|
| Industrial Machinery | 2 | $37B |
|
||
| Healthcare | 1 | $177B |
|
||
| Pharmaceuticals | 1 | $45B |
|
||
| Metals / Steel | 1 | $18B |
|
||
| Agriculture | 1 | $17B |
|
||
| Packaging | 1 | $12B |
|
||
Price history
+62.0% since first listed9 events — show timeline
- 2026-05-20 Pending — IRMLS
- 2026-05-18 Price Changed $115,000 IRMLS
- 2026-05-13 Relisted — IRMLS
- 2026-05-11 Pending — IRMLS
- 2026-05-01 Listed $140,000 IRMLS
- 2017-07-14 Sold (MLS) $66,500 IRMLS
- 2017-02-13 Listed $67,900 IRMLS
- 2016-04-22 Listed $66,000 IRMLS
- 2014-11-17 Listed $71,000 IRMLS
Property tax history
+10.8%/yrLatest (2024): $1,148 · +12.8% YoY. Source: county tax records.
Cash-flow waterfall
monthlySold comps — $/sqft
last 12 mo · ≤1 miLoading sold comps…