 🏗️ New Construction
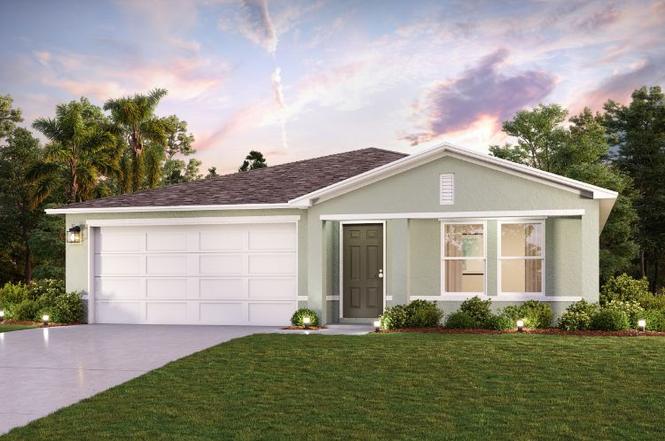
228 Locust Pass Cir · Silver Springs Shores, FL
Flood risk 1/10 · Minimal
- FEMA flood zone
- X (unshaded)
- Chance of flooding over 30 yrs
- 0.0%
- Est. flood insurance / yr
- $507 – $1,088
Fire risk 5/10 · Moderate
- Est. fire insurance / yr
- $947 – $1,759
Heat risk 8/10 · Major
- Hot days now (above 108°F)
- 7 days/yr
- Hot days in 30 yrs
- 23 days/yr
Wind risk 9/10 · Severe
- Chance of severe wind over 30 yrs
- 99.0%
Air-quality risk 3/10 · Minor
- Unhealthy air days now
- 3 days/yr
- Unhealthy air days in 30 yrs
- 4 days/yr
Risk factors via First Street. Map © Google.
Why this score? — see what drove the D- grade
The composite is a weighted blend of 9 inputs, each scored 0–100. Each bar is that input's sub-score; the figure is the points it added to the 100-point composite (weight × sub-score).
- Appreciation +8.0/10.0
- ARV discount +7.5/15.0
- Cash flow +6.3/30.0
- Schools +3.6/10.0
- Livability +3.4/5.0
- Rent growth +2.5/5.0
- Condition / age +2.5/5.0
- 1% rule +1.5/10.0
- DSCR +0.6/10.0
$263,888
🖨 Deal sheet (PDF) 📄 Offer letter ✓ Due diligence
Listing remarks MLS
4 bed | 2-bath | 2-bay | 1666 sq. ft.
Key facts
- Open living room
- Private bath
- Dining area
Tags
Property features AI
Finance
- Other: Zoning: R1; Property type: Residential — Single Family Residence; Living area reported by builder: 1,666 sq ft; Total rooms: 6
- HOA & community: Community clubhouse; Community pool; Pets allowed; Association amenities include clubhouse and pool; association fee includes pool, management and other items
Exterior
- Parking: Driveway; Attached garage with garage door opener; 2-car garage
- Security: Smoke detector(s)
- Utilities: Public water; Public sewer; Electricity connected; Water connected; Sewer connected
- Home design: Single-family residence; One story; Under construction (projected completion: 2026-05-29); Faces southeast
- Construction: Block and stucco construction; Shingle roof; Slab foundation; New construction; Builder: WJHFL LLC (Model: QUAIL RIDGE); Builder license number CGC1517458; Permit number 2025101201; Lot size approximately 0.23 acres
- Exterior features: Paved road access; Other exterior features
Interior
- Kitchen: Dishwasher; Range; Microwave; Electric water heater
- Bedrooms: 4 bedrooms
- Flooring: Carpet
- Bathrooms: 2 full bathrooms
- Heating & cooling: Central heating (electric, heat pump); Central air conditioning
- Interior features: Open floor plan; Thermostat; Walk-in closet(s); Double-pane, insulated thermal windows; Other
- Laundry & utility: Washer hookup; Electric dryer hookup; Indoor laundry
Neighborhood map
What this means for you Summary
Snapshot
- This is a 4-bed/2.0-bath single-family listed at $264k.
Deal economics
- At list price, monthly cash flow is $-526 ($-6k/yr) — negative.
- To cash-flow at today's rent, offer at most $217k (17.7% below list).
- To meet the 1% rule (rent ≥ 1% of price), the offer needs to be $190k (28.0% below list).
- Recommended offer: $190k (28.0% below list) — sets the bar for 1% rule.
Location & tenants
- Location reads 68/100 on livability (#527 in FL) — a middle-class / working-renter tenant base. Strengths: cost of living A+, housing A+, health & safety A-; Watch: crime C-, employment D, amenities F.
- Marion (rural): math 42% / reading 43% proficiency, ranked #61 of 73 in FL (top 84%) — families likely to look elsewhere, expect single-tenant / working-renter base with shorter leases; 61% free/reduced lunch — lower-income household profile, screen leases tightly.
- Zoned schools: Emerald Shores Elementary School (math 30% / reading 34%, grade F, #1,797 of 2,144 statewide, top 86%, 666 students, 74% FRL); Lake Weir Middle School (math 37% / reading 33%, grade F, #416 of 571 statewide, top 74%, 1,207 students, 76% FRL); Lake Weir High School (math 23% / reading 34%, grade F, #458 of 667 statewide, top 69%, 1,483 students, 68% FRL).
- Market conditions: Rents flat; 683 active listings in the ZIP; 6 comparable units currently listed for rent nearby; rentals at typical pace (median 16d on market — plan ~3-4 weeks tenant-placement turnaround); 7,071 units permitted in Marion County in 2024 (534 in 5+ unit buildings).
- This rent runs 35% of the median local income ($64k/yr) — at the standard rent-burdened threshold; future hikes will face affordability resistance.
Forward outlook
- In year one you build about $19k of equity ($2k loan paydown + $17k appreciation (5.9% local appreciation)).
- Marion County population projected at +13% by 2050 — modest demand growth; plan on rents tracking national, not racing it.
- By year 2, paydown + projected appreciation supports a ~$31k cash-out refi (75% LTV) — recoverable capital for the next deal without selling this one.
Negotiation context
- It's been on market 113 days — a 9% lower offer ($240k) is reasonable based on typical stale-listing flexibility.
- 4 sale attempts with the ask held roughly flat each time — persistent listings suggest the price (not the market) is what's stuck; bring a comps-based counter.
Risks & watch-outs
- Climate carrying-cost: severe wind risk, 99% chance of damaging wind over 30y; moderate wildfire risk; extreme-heat days projected 7→23/yr by 2055 (HVAC capex compounding) — expect insurance premiums to compound above CPI over the hold.
Questions for the listing agent
- What do current leases actually rent for vs. the listed asking? Can we see a recent rent roll and the last 12 months of T-12 income?
- It's been on market 113 days. Have you received any prior offers? Is the seller open to a 28% concession, seller financing, or rate buy-down credit?
- Why hasn't it sold? Are there any deal-killer items the seller is aware of (foundation, flood, title, zoning, code violations)?
- Is there a deadline driving the sale (1031 exchange, divorce, estate, relocation)? That informs how much negotiation room exists.
- Schools are F-rated, which usually means shorter tenancies and higher turnover. Who's the typical renter profile here, and what's been the actual vacancy rate?
- The area grade is low — what's the realistic commute time and amenity access for the typical tenant pool here? Any planned neighborhood developments (good or bad) we should know about?
- What's the average days-on-market for RENTAL listings here right now (not sales)? A rising rental-DOM trend means longer vacancies and softer asking-rent achievability than the comps imply.
- What's the recent tenant-quality profile in this submarket — average credit score on applications, eviction rate, late-payment / NSF rate, and stable-employment percentage? A property-management company in the area should have these aggregated.
- How much new for-sale + rental construction is in the pipeline within 1–3 miles? Heavy new supply typically softens prices + rents 12–24 months out; constrained supply supports both.
Investment metrics
- 1% rule
- 0.65% ✗
- Cap rate
- 4.14%
- Cash-on-cash
- -7.69%
- DSCR
- 0.66
- GRM
- 12.9
CMA / ARV
- ARV (on-the-fly)
- $293,216
- Comps found
- 4
Show comp detail 4 sales within ~0.75 mi
| Address | Dist | Beds/Ba | Sqft | Sold | Price | $/sf | Match |
|---|---|---|---|---|---|---|---|
| 275 Emerald Rd | 0.06mi | 4/2.0 | 1,683 (+1%) | 22mo | $296,000 | $176 | 77 |
| 311 Oak Track Dr | 0.39mi | 3/2.0 (-1) | 1,806 (+8%) | 9mo | $206,000 | $114 | 55 |
| 235 Oak Lane Loop | 0.12mi | 3/2.0 (-1) | 1,445 (-13%) | 15mo | $155,000 | $107 | 55 |
| 226 Locust Ln | 0.45mi | 3/2.0 (-1) | 1,550 (-7%) | 10mo | $287,000 | $185 | 54 |
Match score weights: distance 35% · size 25% · config 20% · recency 20%. Top-matched comps best support the ARV.
Projected returns pro-forma
5.93% appreciation · 0.17% rent growth · sell at horizon
- IRR
- 8.1%
- Equity multiple
- 1.55×
- Total profit
- $44,755
- Equity at exit
- $183,079
- IRR
- 9.1%
- Equity multiple
- 2.81×
- Total profit
- $148,736
- Equity at exit
- $330,933
Cash invested: $82,100 (down + closing). Projections, not guarantees.
Landlord ↔ Tenant lean methodology
- Overall (STATE)
- 87 Strongly Landlord-Friendly
- State Florida
- 87 Strongly Landlord-Friendly · R+3
- County
- — inherits STATE
- City
- — inherits STATE
ZIP-level market 34472
- Home prices YoY
- 2.4%
- Rents YoY
- 0.2%
- Active inventory
- 683
- Price-to-rent
- 11.6×
Monthly cashflow live
- Estimated rent
- $1,899 high interval (Pro) →
- Mortgage (P&I)
- −$1,538
- Tax est. 1.5%
- −$367 /mo · $4,398/yr
- Insurance
- −$122
- HOA
- −$0
- Vacancy / Maint / Mgmt
- −$399
- Net cashflow
- $-526
Break-even live
Sensitivity live
| Price | -10% $-323 | -5% $-425 | +0% $-526 | +5% $-627 | +10% $-729 |
|---|---|---|---|---|---|
| Rent | -10% $-676 | -5% $-601 | +0% $-526 | +5% $-451 | +10% $-376 |
| Rate | -1.0pp $-378 | -0.5pp $-451 | base $-526 | +0.5pp $-602 | +1.0pp $-679 |
UW: 25.0% down · 7.5% · 30yr · 1.5% tax · 5.0% vac · 8.0% maint · 8.0% mgmt
Financing live
Cash to close
- Down payment
- $73,304
- Closing costs
- $8,796
- Reserves months
- —
- Total cash needed
- —
Loan-product check · same deal, 3 products live
Conventional
25% down · 7.5% · 30yr
- Down + closing
- —
- Monthly P&I
- —
- Monthly cashflow
- —
- DSCR
- —
- Eligible?
- —
Personal DTI + credit; lowest rate.
DSCR
20% down · 8.5% · 30yr
- Down + closing
- —
- Monthly P&I
- —
- Monthly cashflow
- —
- DSCR
- —
- Eligible?
- —
No personal income docs; deal must DSCR.
Hard money
10% down · 12.0% · 12mo
- Down + closing
- —
- Monthly P&I
- —
- Monthly cashflow
- —
- DSCR
- —
- Eligible?
- —
Short-term bridge; refi at stabilization.
Rent comps 6 comps
| Address | Beds | Baths | Sqft | Rent | $/sqft | DOM | Units | Dist |
|---|---|---|---|---|---|---|---|---|
| 217 Locust Pass Crse Ocala, FL | 3.0 | 2.0 | 1232 | $1,650 | $1.34 | 15d | 1 | 0.17mi |
| 202 Oak Lane Cir Ocala, FL | 3.0 | 2.0 | 1232 | $1,650 | $1.34 | 15d | 1 | 0.30mi |
| 219 Locust Ln Ocala, FL | 3.0 | 2.0 | 1232 | $1,650 | $1.34 | 15d | 1 | 0.49mi |
| 325 Oak Track Ct Ocala, FL | 3.0 | 2.0 | 1163 | $1,550 | $1.33 | 22d | 1 | 0.65mi |
| 342 Locust Pass Ocala, FL | 3.0 | 2.0 | 1232 | $1,650 | $1.34 | 15d | 1 | 0.90mi |
| 27 Sapphire Run Ocala, FL | 3.0 | 2.0 | 1255 | $1,500 | $1.20 | 22d | 1 | 1.23mi |
Listing history 9 events
-
2026-06-22days on market $263,888 Active 113 DOM
-
2026-06-18days on market $263,888 Active 110 DOM
-
2026-06-17days on market $263,888 Active 109 DOM
-
2026-06-16days on market $263,888 Active 108 DOM
-
2026-06-15days on market $263,888 Active 107 DOM
-
2026-06-14days on market $263,888 Active 105 DOM
-
2026-06-13pricestatusdays on market $263,888 Active 104 DOM
-
2026-06-07remarks 699-char remark
-
2026-06-07$274,990 Pending 102 DOM
ⓘ Source: listings_history table (triggers on properties + properties_extension) + one-shot
backfill from property_details.listing_events for pre-trigger history.
Climate risk First Street
- Flood 1/10 Low FEMA zone X (unshaded) · 0% chance over 30 yrs
- Wildfire 5/10 Major
- Heat 8/10 Severe 7 d/yr ≥108°F today · 23 d/yr by 30 yrs out
- Wind 9/10 Extreme 99% chance of damaging wind over 30 yrs
- Air quality 3/10 Moderate 3 unhealthy d/yr today · 4 by 30 yrs out
Nearby sold comps map
Loading sold comps map…
Walkable amenities ~0.75 mi
Loading nearby amenities…
Taxation est. · year 1
- Rental income
- $22,791
- − Mortgage interest
- −$16,425
- − Property taxes
- −$4,398
- − Insurance
- −$1,466
- − Repairs & maintenance
- −$1,823
- − Management
- −$1,823
- − Depreciation
- −$8,530
- Taxable loss
- −$11,675
- Est. tax savings @ 24.0%
- +$2,802
- After-tax cash flow
- $-3,510/yr
For passive investors: Depreciation is non-cash, so a rental often shows a tax loss while cash-flowing — sheltering income. Rental losses are passive: they offset passive income freely, and up to $25,000/yr can offset ordinary (W-2) income if you actively participate and your MAGI is under $100k (phasing out to $0 by $150k); unused losses carry forward. On sale, claimed depreciation is recaptured at up to 25%, and gains may owe capital-gains tax (a 1031 exchange can defer both). Figures are a year-1 estimate at your 24.0% rate — not tax advice; consult a CPA.
Schools (NCES district)
- District
- Marion
- NCES district ID
- 1201260
- Math proficiency
- 42% ▼ -7.00%
- Reading proficiency
- 43% ▼ -4.00%
- Median HH income
- $40,015
- Composite
- 35.61/100
- National rank
- #4890
- State rank
- #61 of 73 in FL
Livability — Silver Springs Shores
- Score
- 68/100
- State rank
- #527
- US rank
- #9854
Category grades
Schools grade is shown separately in the Schools card above.
Census & demographics
- Census place
- Silver Springs Shores, FL
- County
- Marion County · 315,796 people
- City population
- 34,665
- Metro
- Ocala, FL
- Population (ZIP)
- 35,851
- Household income
- $64,208
- Rent vs Own
- Severe rent burden
- 655.0
Population outlook (Marion County) Hauer SSP2
- Today (2025)
- 365,905 people
- By 2030
- 376,768 · +3.0%
- By 2040
- 396,555 · +8.4%
- By 2050
- 412,723 · +12.8%
- By 2075
- 446,090 · +21.9%
- By 2100
- 436,193 · +19.2%
Race, ethnicity, and origin ACS 2023
- Neighborhood character
- Diverse neighborhood (Simpson 0.65)
- Race & ethnicity
- White 50% Hispanic / Latino 25% Black 21% Two or more races 18% Asian 2%
- Hispanic origin (detail)
- Mexican 2% Puerto Rican 14% Cuban 3%
- Common ancestry
- Romanian 2% Iranian 1% Lithuanian 1%
- Foreign-born
- 11% · Canada, Jamaica, China
- Languages at home
- 78% English-only · Spanish 19% Other Indo-European 1%
Political lean MEDSL · Marion
- 2024 margin
- Solid R (+31.6) · D 33.8% · R 65.5%
- 2008→2024 swing
- -20.0pp toward R · 2008: -11.6pp · 2024: -31.6pp
- All cycles
- 2024: R+31.6 2020: R+25.9 2016: R+26.2 2012: R+16.2 2008: R+11.6
Not yet ingested
- Civics
- —
Market trends
- HPI YoY
- ▲ 5.93%
- Current HPI
- 255.0714
- Rent YoY
- ▲ 0.17%
- Metro
- Ocala, FL
- State GDP YoY
- ▲ 3.28%
- F500 in state
- 36
Industry mix (Fortune 500 HQ in FL)
| Industry | F500 HQs | Revenue |
|---|---|---|
| Industrial Technology | 2 | $29B |
|
||
| Insurance | 2 | $17B |
|
||
| Retail | 1 | $60B |
|
||
| Technology Distribution | 1 | $58B |
|
||
| Homebuilding | 1 | $35B |
|
||
| Technology Manufacturing | 1 | $35B |
|
||
Price history
+1.9% since first listed13 events — show timeline
- 2026-06-05 Price Changed $274,990 Zillow
- 2026-06-05 Relisted — Zillow
- 2026-06-01 Pending — Stellar MLS as Distributed by MLS Grid
- 2026-05-31 Delisted — Zillow
- 2026-05-31 Price Changed $274,990 Stellar MLS as Distributed by MLS Grid
- 2026-05-27 Price Changed $250,888 Zillow
- 2026-05-26 Price Changed $250,888 Stellar MLS as Distributed by MLS Grid
- 2026-03-25 Relisted — Zillow
- 2026-03-22 Delisted — Zillow
- 2026-02-25 Price Changed $274,990 Stellar MLS as Distributed by MLS Grid
- 2026-02-25 Price Changed $274,990 Zillow
- 2026-02-20 Listed $269,990 Zillow
- 2026-02-19 Listed $269,990 Stellar MLS as Distributed by MLS Grid
Cash-flow waterfall
monthlySold comps — $/sqft
last 12 mo · ≤1 miLoading sold comps…