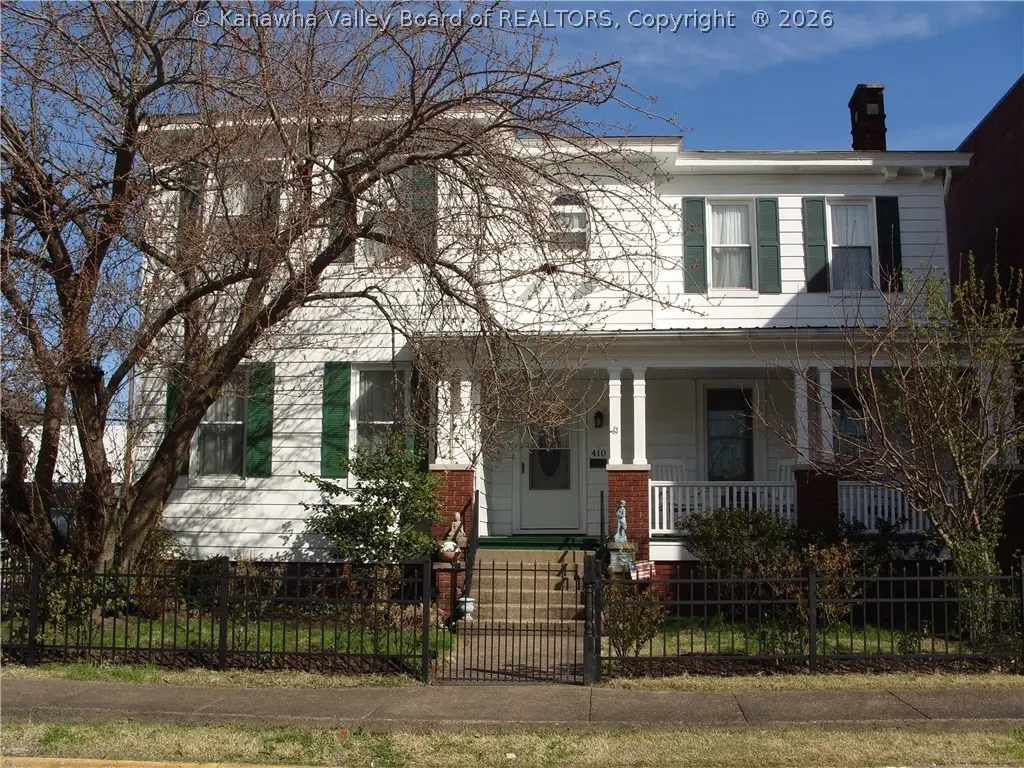
410 Ferry St · Montgomery, WV
Flood risk 9/10 · Severe
- FEMA flood zone
- X (unshaded)
- Chance of flooding over 30 yrs
- 0.99%
- Est. flood insurance / yr
- $507 – $1,088
Fire risk 4/10 · Minor
- Est. fire insurance / yr
- $787 – $1,461
Heat risk 6/10 · Moderate
- Hot days now (above 98°F)
- 9 days/yr
- Hot days in 30 yrs
- 24 days/yr
Wind risk 1/10 · Minimal
- Chance of severe wind over 30 yrs
- 1.0%
Air-quality risk 1/10 · Minimal
- Unhealthy air days now
- 0 days/yr
- Unhealthy air days in 30 yrs
- 0 days/yr
Risk factors via First Street. Map © Google.
Why this score? — see what drove the C- grade
The composite is a weighted blend of 9 inputs, each scored 0–100. Each bar is that input's sub-score; the figure is the points it added to the 100-point composite (weight × sub-score).
- Cash flow +15.9/30.0
- ARV discount +12.4/15.0
- DSCR +4.9/10.0
- Appreciation +4.7/10.0
- 1% rule +3.0/10.0
- Livability +2.7/5.0
- Rent growth +2.5/5.0
- Condition / age +2.5/5.0
- Schools +2.0/10.0
$149,900
🖨 Deal sheet (PDF) 📄 Offer letter ✓ Due diligence
Listing remarks
THIS BEAUTIFUL HOME HAS BEEN CAREFULLY RESTORED TO CAPTURE ITS ORIGINAL CHARM. ARCHED DOORWAYS, INTRICATE WOODWORK, GLISTENING HARDWOOD FLOORS, GORGEOUS SPIRAL STAIRCASE, AND FIVE FIREPLACES (NONE WOODBURNING) ENHANCE ITS HISTORIC VALUE. RELAX IN THE SWING ON THE LARGE FRONT PORCH OR ENJOY THE BACK PORCH OVERLOOKING A BEAUTIFUL BACK YARD WHICH RESEMBLES A COURT YARD. A "REAL FIND" IN THE UPPER KANAWHA VALLEY. CALL FOR AN APPOINTMENT TO SEE IT TODAY!
Key facts
- Large front porch
- Five fireplaces
- Arched doorways
Tags
Neighborhood map
What this means for you Summary
Snapshot
- This is a 3-bed/2.0-bath single-family listed at $150k.
Deal economics
- At list price, monthly cash flow is $4 ($48/yr) — positive.
- The deal already cash-flows at list — no discount required.
- To meet the 1% rule (rent ≥ 1% of price), the offer needs to be $120k (20.1% below list).
- Recommended offer: $120k (20.1% below list) — sets the bar for 1% rule.
Location & tenants
- Location reads 53/100 on livability (#308 in WV) — a working-class tenant base; expect higher turnover. Strengths: cost of living A+, housing B+; Watch: crime F, amenities F, commute F.
- Fayette County Schools (suburban): math 17% / reading 31% proficiency, ranked #51 of 55 in WV (top 93%) — low school quality limits family demand, transient renter base, plan for 1-2y turnover.
- Zoned schools: Valley Pk-8 (math 13%, 530 students, 0% FRL); Oak Hill Middle School (math 14% / reading 26%, grade F, #104 of 109 statewide, top 96%, 656 students, 0% FRL) — zoned schools average 0% FRL vs 54% district-wide (54 pts lower); this property's tenant base skews higher-income than the district average.
- Market conditions: 12 active listings in the ZIP; 26 units permitted in Fayette County in 2024 (0 in 5+ unit buildings).
Forward outlook
- In year one you build about $276 of equity ($1k loan paydown + $-760 appreciation (-0.5% local appreciation)).
- Fayette County population projected at -23% by 2050 — secular population decline; favor cash flow + early exit over multi-decade hold.
Negotiation context
- It's been on market 25 days — a 2% lower offer ($148k) is reasonable based on typical stale-listing flexibility.
- 5 sale attempts since 13y ago with the ask held roughly flat each time — persistent listings suggest the price (not the market) is what's stuck; bring a comps-based counter.
- Current owner paid $60k; list at $150k implies a 150% gain — meaningful room to come down on a strong offer.
Risks & watch-outs
- Watch-outs: flood insurance adds $66/mo; built in 1900 — expect roof / HVAC / electrical / plumbing capex.
- Climate carrying-cost: severe flood risk; extreme-heat days projected 9→24/yr by 2055 (HVAC capex compounding) — expect insurance premiums to compound above CPI over the hold.
Questions for the listing agent
- Built in 1900 — when were the roof, HVAC, electrical panel, plumbing, and water heater last replaced?
- What's the actual annual flood-insurance premium (NFIP or private), and is the property in a SFHA with mandatory coverage?
- Is there a deadline driving the sale (1031 exchange, divorce, estate, relocation)? That informs how much negotiation room exists.
- Schools are F-rated, which usually means shorter tenancies and higher turnover. Who's the typical renter profile here, and what's been the actual vacancy rate?
- Crime grade is F in this area — have there been break-ins, vandalism, or insurance claims at this property in the last 3 years? What carrier currently insures it and at what premium?
- What's the average days-on-market for RENTAL listings here right now (not sales)? A rising rental-DOM trend means longer vacancies and softer asking-rent achievability than the comps imply.
- What's the recent tenant-quality profile in this submarket — average credit score on applications, eviction rate, late-payment / NSF rate, and stable-employment percentage? A property-management company in the area should have these aggregated.
- How much new for-sale + rental construction is in the pipeline within 1–3 miles? Heavy new supply typically softens prices + rents 12–24 months out; constrained supply supports both.
Investment metrics
- 1% rule
- 0.80% ✗
- Cap rate
- 6.86%
- Cash-on-cash
- 2.02%
- DSCR
- 1.09
- GRM
- 10.4
CMA / ARV
- ARV (on-the-fly)
- $168,150
- Comps found
- 2
Show comp detail 2 sales within ~0.75 mi
| Address | Dist | Beds/Ba | Sqft | Sold | Price | $/sf | Match |
|---|---|---|---|---|---|---|---|
| 410 Ferry St | 0.00mi | 3/2.0 | 1,770 (0%) | 1mo | $149,900 | $85 | 99 |
| 718 Fifth Ave | 0.42mi | 4/2.0 (+1) | 1,904 (+8%) | 12mo | $180,000 | $95 | 53 |
Match score weights: distance 35% · size 25% · config 20% · recency 20%. Top-matched comps best support the ARV.
Projected returns pro-forma
-0.51% appreciation · 3.0% rent growth · sell at horizon
- IRR
- -4.1%
- Equity multiple
- 0.82×
- Total profit
- $-7,706
- Equity at exit
- $39,763
- IRR
- 2.2%
- Equity multiple
- 1.22×
- Total profit
- $9,218
- Equity at exit
- $44,889
Cash invested: $41,972 (down + closing). Projections, not guarantees.
Landlord ↔ Tenant lean methodology
- Overall (STATE)
- 83 Strongly Landlord-Friendly
- State West Virginia
- 83 Strongly Landlord-Friendly · R+22
- County
- — inherits STATE
- City
- — inherits STATE
ZIP-level market 25136
- Home prices YoY
- -0.4%
- Active inventory
- 12
- Price-to-rent
- 10.4×
Monthly cashflow live
- Estimated rent
- $1,197 medium interval (Pro) →
- Mortgage (P&I)
- −$786
- Tax from tax record
- −$27 /mo · $321/yr
- Insurance
- −$62
- Flood insurance flood zone
- −$66 /mo · $798/yr
- HOA
- −$0
- Vacancy / Maint / Mgmt
- −$251
- Net cashflow
- $4
Break-even live
Sensitivity live
| Price | -10% $89 | -5% $46 | +0% $4 | +5% $-38 | +10% $-260 |
|---|---|---|---|---|---|
| Rent | -10% $-91 | -5% $-43 | +0% $4 | +5% $51 | +10% $99 |
| Rate | -1.0pp $80 | -0.5pp $42 | base $4 | +0.5pp $-35 | +1.0pp $-74 |
UW: 25.0% down · 7.5% · 30yr · 1.5% tax · 5.0% vac · 8.0% maint · 8.0% mgmt
Financing live
Cash to close
- Down payment
- $37,475
- Closing costs
- $4,497
- Reserves months
- —
- Total cash needed
- —
Loan-product check · same deal, 3 products live
Conventional
25% down · 7.5% · 30yr
- Down + closing
- —
- Monthly P&I
- —
- Monthly cashflow
- —
- DSCR
- —
- Eligible?
- —
Personal DTI + credit; lowest rate.
DSCR
20% down · 8.5% · 30yr
- Down + closing
- —
- Monthly P&I
- —
- Monthly cashflow
- —
- DSCR
- —
- Eligible?
- —
No personal income docs; deal must DSCR.
Hard money
10% down · 12.0% · 12mo
- Down + closing
- —
- Monthly P&I
- —
- Monthly cashflow
- —
- DSCR
- —
- Eligible?
- —
Short-term bridge; refi at stabilization.
Listing history 10 events
-
2026-04-23status Pending
-
2026-04-03status Active
-
2026-03-31status Pending
-
2026-03-23$149,900 Active
-
2019-05-01soldstatus $59,860
-
2016-07-15$112,900
-
2016-05-09$112,900
-
2014-11-04soldstatus $90,500
-
2013-12-09$95,000
-
1998-08-10soldstatus $68,000
ⓘ Source: listings_history table (triggers on properties + properties_extension) + one-shot
backfill from property_details.listing_events for pre-trigger history.
Tax reassessment forecast WV · Resets to sale price
- Current annual tax
- $321 · $27/mo
- Projected year-2 tax
- $884 · $74/mo
- Expected delta
- +$563/yr (+$47/mo · 175.2%)
ⓘ Screening estimate from a state-policy table — verify with the county assessor before closing.
Climate risk First Street
- Flood 9/10 Extreme FEMA zone X (unshaded) · 99% chance over 30 yrs
- Wildfire 4/10 Moderate
- Heat 6/10 Major 9 d/yr ≥98°F today · 24 d/yr by 30 yrs out
- Wind 1/10 Low 100% chance of damaging wind over 30 yrs
- Air quality 1/10 Low 0 unhealthy d/yr today · 0 by 30 yrs out
Nearby sold comps map
Loading sold comps map…
Walkable amenities ~0.75 mi
Loading nearby amenities…
Taxation est. · year 1
- Rental income
- $14,367
- − Mortgage interest
- −$8,397
- − Property taxes
- −$321
- − Insurance
- −$1,547
- − Repairs & maintenance
- −$1,149
- − Management
- −$1,149
- − Depreciation
- −$4,361
- Taxable loss
- −$2,558
- Est. tax savings @ 24.0%
- +$614
- After-tax cash flow
- $662/yr
For passive investors: Depreciation is non-cash, so a rental often shows a tax loss while cash-flowing — sheltering income. Rental losses are passive: they offset passive income freely, and up to $25,000/yr can offset ordinary (W-2) income if you actively participate and your MAGI is under $100k (phasing out to $0 by $150k); unused losses carry forward. On sale, claimed depreciation is recaptured at up to 25%, and gains may owe capital-gains tax (a 1031 exchange can defer both). Figures are a year-1 estimate at your 24.0% rate — not tax advice; consult a CPA.
Schools (NCES district)
- District
- Fayette County Schools
- NCES district ID
- 5400300
- Math proficiency
- 17% ▼ -12.00%
- Reading proficiency
- 31% ▼ -4.00%
- Median HH income
- $35,293
- Composite
- 19.77/100
- National rank
- #8706
- State rank
- #51 of 55 in WV
Livability — Montgomery
- Score
- 53/100
- State rank
- #308
- US rank
- #24681
Category grades
Schools grade is shown separately in the Schools card above.
Census & demographics
- Census place
- Montgomery, WV
- Population (ZIP)
- 1,749
Population outlook (Fayette County) Hauer SSP2
- Today (2025)
- 41,745 people
- By 2030
- 39,758 · -4.8%
- By 2040
- 35,751 · -14.4%
- By 2050
- 32,223 · -22.8%
- By 2075
- 24,307 · -41.8%
- By 2100
- 16,671 · -60.1%
Race, ethnicity, and origin ACS 2023
- Neighborhood character
- Predominantly White (71%)
- Race & ethnicity
- White 71% Two or more races 16% Black 12% Hispanic / Latino 1%
- Common ancestry
- Slovak 2% Romanian 2% Serbian 1%
- Foreign-born
- 1% · Canada
- Languages at home
- 98% English-only · Spanish 1%
Political lean MEDSL · Fayette
- 2024 margin
- Solid R (+41.8) · D 28.1% · R 69.8% · Other 2.1%
- 2008→2024 swing
- -39.0pp toward R · 2008: -2.7pp · 2024: -41.8pp
- All cycles
- 2024: R+41.8 2020: R+38.6 2016: R+39.6 2012: R+21.0 2008: R+2.7
Not yet ingested
- Civics
- —
Market trends
- HPI YoY
- ▼ -0.51%
- Current HPI
- 130.7827
- Rent YoY
- —
- Metro
- —
- State GDP YoY
- —
- F500 in state
- 0
Price history
+120.4% since first listed10 events — show timeline
- 2026-04-23 Pending — KVBOR
- 2026-04-03 Relisted — KVBOR
- 2026-03-31 Pending — KVBOR
- 2026-03-23 Listed $149,900 KVBOR
- 2019-05-01 Sold (Public Records) $59,860 Public Records
- 2016-07-15 Listed $112,900 KVBOR
- 2016-05-09 Listed $112,900 KVBOR
- 2014-11-04 Sold (MLS) $90,500 KVBOR
- 2013-12-09 Listed $95,000 KVBOR
- 1998-08-10 Sold (Public Records) $68,000 Public Records
Property tax history
-7.9%/yrLatest (2025): $321 · +5.1% YoY. Source: county tax records.
Cash-flow waterfall
monthlySold comps — $/sqft
last 12 mo · ≤1 miLoading sold comps…