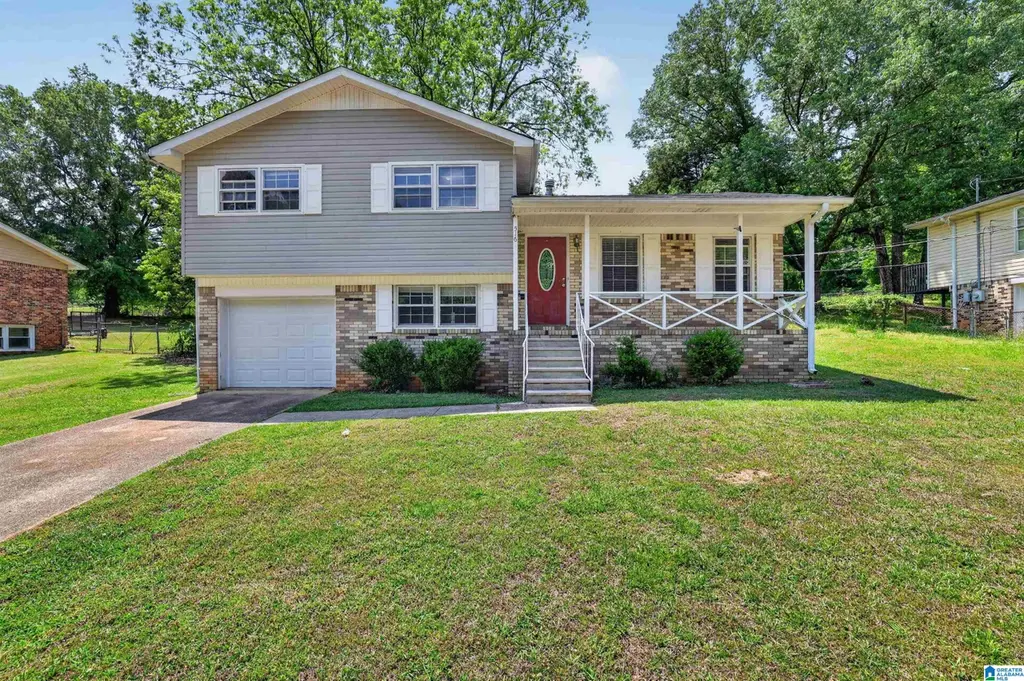
516 Argonne Dr NE · Center Point, AL
Flood risk 1/10 · Minimal
- FEMA flood zone
- X (unshaded)
- Chance of flooding over 30 yrs
- 0.0%
- Est. flood insurance / yr
- $473 – $860
Fire risk 2/10 · Minimal
- Est. fire insurance / yr
- $916 – $1,700
Heat risk 6/10 · Moderate
- Hot days now (above 105°F)
- 7 days/yr
- Hot days in 30 yrs
- 19 days/yr
Wind risk 6/10 · Moderate
- Chance of severe wind over 30 yrs
- 27.0%
Air-quality risk 5/10 · Moderate
- Unhealthy air days now
- 7 days/yr
- Unhealthy air days in 30 yrs
- 9 days/yr
Risk factors via First Street. Map © Google.
Why this score? — see what drove the D- grade
The composite is a weighted blend of 9 inputs, each scored 0–100. Each bar is that input's sub-score; the figure is the points it added to the 100-point composite (weight × sub-score).
- Cash flow +15.0/30.0
- DSCR +4.6/10.0
- 1% rule +3.7/10.0
- Rent growth +3.3/5.0
- Livability +3.2/5.0
- ARV discount +3.1/15.0
- Condition / age +2.5/5.0
- Schools +1.8/10.0
- Appreciation +0.0/10.0
$149,900
🖨 Deal sheet 📄 Offer letter ✓ Due diligence
Listing remarks
516 Argonne Dr NE offers the perfect blend of classic 1960s durability and modern comfort. Step inside this 1306 sqft tri-level home find a spacious, light-filled living area featuring stylish flooring that flows throughout the main level. The first floor features a one car garage, 12x12 family room and a full bath. On the second level, you'll find the living room, a functional kitchen and a cozy formal dining area, making meal prep and entertaining a breeze. This home features 3 generous bedrooms and one shared full bathroom on the 3rd floor, including a primary suite. Situated on a large, level lot of over a quarter-acre, the expansive and fully fenced backyard is an outdoor enthusiast's
Key facts
- One car garage
- Large level lot
- Easy highway access
Tags
Property features AI
Finance
- Other: Lot size approximately 0.27 acres; Flood plain: No; Subdivision: BROOKWAY PARK
- Financial info: Down payment assistance available
- HOA & community: No association fee
Exterior
- Parking: Attached garage with front entry; 1 total garage space
- Utilities: Public water; Connected sewer; Gas water heater; Internet availability unknown
- Home design: Existing single-family property; Tri-level layout not indicated; Not a log home
- Construction: Vinyl siding; Crawl space foundation
- Exterior features: Open patio; Porch
Interior
- Kitchen: Solid surface countertops; Built-in dishwasher; Self-cleaning range/oven; Refrigerator included
- Bedrooms: Master bedroom on upper level; Additional bedrooms on upper level; Bedroom sizes include 11x13, 13x10, 10x10
- Flooring: Brick flooring; Carpet; Vinyl
- Bathrooms: Two full bathrooms (one on main level, one on upper level); Bathroom is shared
- Heating & cooling: Central heating; Central air conditioning
- Interior features: 9+ ft. ceilings; No special interior features listed
- Laundry & utility: Laundry located on upper level; Washer hookup available; Electric dryer hookup
Neighborhood map
What this means for you Summary
Snapshot
- This is a 3-bed/2.0-bath single-family listed at $150k.
Deal economics
- At list price, monthly cash flow is $47 ($568/yr) — positive.
- The deal already cash-flows at list — no discount required.
- To meet the 1% rule (rent ≥ 1% of price), the offer needs to be $131k (12.8% below list).
- Recommended offer: $131k (12.8% below list) — sets the bar for 1% rule.
Location & tenants
- Location reads 63/100 on livability (#193 in AL) — a middle-class / working-renter tenant base. Strengths: cost of living A+, commute A, housing A; Watch: crime D, amenities F, employment F.
- Jefferson County (suburban): math 9% / reading 32% proficiency, ranked #104 of 129 in AL (top 81%) — low school quality limits family demand, transient renter base, plan for 1-2y turnover.
- Zoned schools: Center Point Elementary School (618 students, 82% FRL); Center Point High School (math 2% / reading 2%, grade F, #291 of 305 statewide, top 100%, 774 students, 91% FRL) — zoned schools average 86% FRL vs 49% district-wide (38 pts higher); higher-poverty schools than district average — tighter screening recommended.
- Zoned-school proficiency averages 2% at this address vs 20% district-wide (-18 pts) — the specific schools serving this property underperform the Jefferson County average; the district grade overstates school quality for this exact location.
- Market conditions: Rents rising (+3.0%/yr); 334 active listings in the ZIP; 40 comparable units currently listed for rent nearby; rentals at typical pace (median 24d on market — plan ~3-4 weeks tenant-placement turnaround); 2,114 units permitted in Jefferson County in 2024 (556 in 5+ unit buildings).
Forward outlook
- Local home prices are declining (-3.0%/yr); year-one equity from $1k of loan paydown is wiped out by about $4k of value loss. Plan a longer hold.
- Jefferson County population projected to shrink 4% by 2050 — rents likely to lag national; underwrite the cash flow, not the appreciation.
Negotiation context
- Only 6 days on market — expect competitive offers; lowballing is unlikely to land.
Risks & watch-outs
- Climate carrying-cost: major wind risk, 27% chance of damaging wind over 30y; extreme-heat days projected 7→19/yr by 2055 (HVAC capex compounding) — expect insurance premiums to compound above CPI over the hold.
Questions for the listing agent
- Built in 1967 — when were the roof, HVAC, electrical panel, plumbing, and water heater last replaced?
- Is there a deadline driving the sale (1031 exchange, divorce, estate, relocation)? That informs how much negotiation room exists.
- Schools are F-rated, which usually means shorter tenancies and higher turnover. Who's the typical renter profile here, and what's been the actual vacancy rate?
- Crime grade is D in this area — have there been break-ins, vandalism, or insurance claims at this property in the last 3 years? What carrier currently insures it and at what premium?
- The area grade is low — what's the realistic commute time and amenity access for the typical tenant pool here? Any planned neighborhood developments (good or bad) we should know about?
- What's the average days-on-market for RENTAL listings here right now (not sales)? A rising rental-DOM trend means longer vacancies and softer asking-rent achievability than the comps imply.
- What's the recent tenant-quality profile in this submarket — average credit score on applications, eviction rate, late-payment / NSF rate, and stable-employment percentage? A property-management company in the area should have these aggregated.
- How much new for-sale + rental construction is in the pipeline within 1–3 miles? Heavy new supply typically softens prices + rents 12–24 months out; constrained supply supports both.
Investment metrics
- 1% rule
- 0.87% ✗
- Cap rate
- 6.67%
- Cash-on-cash
- 1.35%
- DSCR
- 1.06
- GRM
- 9.6
CMA / ARV
- ARV (on-the-fly)
- $136,416
- Comps found
- 12
Show comp detail 12 sales within ~0.75 mi
| Address | Dist | Beds/Ba | Sqft | Sold | Price | $/sf | Match |
|---|---|---|---|---|---|---|---|
| 1705 Lake Park Cir | 0.25mi | 2/2.0 (-1) | 1,339 (-4%) | 1mo | $125,000 | $93 | 76 |
| 1632 Bobolink Ln NE | 0.20mi | 3/2.0 | 1,327 (-5%) | 9mo | $130,000 | $98 | 76 |
| 1736 Reed Rd NE | 0.45mi | 3/2.0 | 1,469 (+6%) | 1mo | $190,000 | $129 | 69 |
| 1637 1st St NE | 0.22mi | 3/1.0 | 1,296 (-7%) | 9mo | $115,300 | $89 | 66 |
| 432 Argonne Dr NE | 0.14mi | 3/2.0 | 1,566 (+12%) | 8mo | $101,700 | $65 | 66 |
| 504 Lakeside Cir | 0.17mi | 2/2.0 (-1) | 1,555 (+12%) | 2mo | $210,000 | $135 | 66 |
| 1341 Hatfield Ln | 0.42mi | 3/1.5 | 1,318 (-5%) | 6mo | $100,500 | $76 | 64 |
| 550 Lakeside Cir | 0.19mi | 2/2.0 (-1) | 1,526 (+10%) | 7mo | $209,900 | $138 | 64 |
| 512 Lakeside Cir | 0.18mi | 2/2.0 (-1) | 1,520 (+9%) | 11mo | $210,000 | $138 | 62 |
| 1517 NW 3rd St | 0.69mi | 3/2.0 | 1,377 (-1%) | 8mo | $86,000 | $62 | 60 |
| 852 Twin Lake Dr NE | 0.69mi | 3/1.5 | 1,364 (-2%) | 6mo | $115,000 | $84 | 57 |
| 25 NW 19th Ave | 0.63mi | 3/2.0 | 1,232 (-12%) | 9mo | $175,000 | $142 | 44 |
Match score weights: distance 35% · size 25% · config 20% · recency 20%. Top-matched comps best support the ARV.
Projected returns pro-forma
-3.0% appreciation · 3.04% rent growth · sell at horizon
- IRR
- -14.1%
- Equity multiple
- 0.49×
- Total profit
- $-21,235
- Equity at exit
- $22,351
- IRR
- -5.3%
- Equity multiple
- 0.66×
- Total profit
- $-14,441
- Equity at exit
- $12,961
Cash invested: $41,972 (down + closing). Projections, not guarantees.
Landlord ↔ Tenant lean methodology
- Overall (STATE)
- 90 Strongly Landlord-Friendly
- State Alabama
- 90 Strongly Landlord-Friendly · R+15
- County
- — inherits STATE
- City
- — inherits STATE
ZIP-level market 35215
- Home prices YoY
- -34.4%
- Rents YoY
- 3.0%
- Active inventory
- 334
- Price-to-rent
- 9.6×
Monthly cashflow live
- Estimated rent
- $1,307 high interval (Pro) →
- Mortgage (P&I)
- −$786
- Tax from tax record
- −$137 /mo · $1,644/yr
- Insurance
- −$62
- HOA
- −$0
- Vacancy / Maint / Mgmt
- −$275
- Net cashflow
- $47
Break-even live
UW: 25.0% down · 7.5% · 30yr · 1.5% tax · 5.0% vac · 8.0% maint · 8.0% mgmt
Financing live
Cash to close
- Down payment
- $37,475
- Closing costs
- $4,497
- Reserves months
- —
- Total cash needed
- —
Loan-product check · same deal, 3 products live
Conventional
25% down · 7.5% · 30yr
- Down + closing
- —
- Monthly P&I
- —
- Monthly cashflow
- —
- DSCR
- —
- Eligible?
- —
Personal DTI + credit; lowest rate.
DSCR
20% down · 8.5% · 30yr
- Down + closing
- —
- Monthly P&I
- —
- Monthly cashflow
- —
- DSCR
- —
- Eligible?
- —
No personal income docs; deal must DSCR.
Hard money
10% down · 12.0% · 12mo
- Down + closing
- —
- Monthly P&I
- —
- Monthly cashflow
- —
- DSCR
- —
- Eligible?
- —
Short-term bridge; refi at stabilization.
Rent comps 40 comps
| Address | Beds | Baths | Sqft | Rent | $/sqft | DOM | Units | Dist |
|---|---|---|---|---|---|---|---|---|
| 213 Meadwood Dr NE Center Point, AL | 3.0 | 1.0 | 1194 | $995 | $0.83 | 43d | 1 | 0.20mi |
| 1628 1st St NE Center Point, AL | 3.0 | 1.0 | 1027 | $1,165 | $1.13 | 43d | 1 | 0.21mi |
| 1720 2nd St NE Center Point, AL | 3.0 | 2.0 | 1100 | $1,400 | $1.27 | 43d | 1 | 0.23mi |
| 341 Argonne Dr NE Center Point, AL | 3.0 | 1.0 | 1040 | $1,300 | $1.25 | 2d | 1 | 0.31mi |
| 1541 Charter East Cir NE Birmingham, AL | 1.0–2.0 | 1.0–1.5 | 807 | $1,095 | $1.36 | 1d | 8 | 0.31mi |
| 241 Lake Drive Cir NE Birmingham, AL | 2.0 | 1.0 | 1358 | $1,025 | $0.75 | 1d | 1 | 0.34mi |
| 239 Lake Drive Cir NE Birmingham, AL | 3.0 | 1.0 | 1159 | $1,125 | $0.97 | 3d | 1 | 0.34mi |
| 1629 1st St NW Center Point, AL | 3.0 | 1.0 | 900 | $1,025 | $1.14 | 23d | 1 | 0.39mi |
| 1628 1st St NW Center Point, AL | 3.0 | 1.0 | 1124 | $1,150 | $1.02 | 43d | 1 | 0.42mi |
| 1700 Serene Dr Birmingham, AL | 4.0 | 1.5 | 1543 | $1,630 | $1.06 | 1d | 1 | 0.56mi |
| 224 13th Ave NE Birmingham, AL | 3.0 | 1.5 | 1213 | $1,273 | $1.05 | 21d | 1 | 0.57mi |
| 113 19th Ave NW Center Point, AL | 3.0 | 2.0 | 1407 | $1,250 | $0.89 | 11d | 1 | 0.64mi |
| 107 Sterling Ct NW Center Point, AL | 2.0 | 1.5–2.0 | 1026 | $1,062 | $1.04 | 2d | 4 | 0.69mi |
| 1617 3rd Pl NW Center Point, AL | 3.0 | 2.0 | 1404 | $1,150 | $0.82 | 23d | 1 | 0.69mi |
| 1340 Orlando Cir NE Birmingham, AL | 3.0 | 2.0 | 1329 | $1,166 | $0.88 | 23d | 1 | 0.71mi |
| 1905 2nd St NW Center Point, AL | 3.0 | 1.0 | 1258 | $1,395 | $1.11 | 43d | 1 | 0.71mi |
| 305 18th Ct NW Center Point, AL | 3.0 | 1.5 | 1270 | $1,100 | $0.87 | 43d | 1 | 0.71mi |
| 1360 Orlando Cir NE Birmingham, AL | 3.0 | 2.0 | 1489 | $1,455 | $0.98 | 23d | 1 | 0.74mi |
| 405 18th Ave NW Center Point, AL | 3.0 | 2.0 | 1162 | $1,299 | $1.12 | 43d | 1 | 0.77mi |
| 428 15th Ter NW Center Point, AL | 3.0 | 2.0 | 1528 | $1,795 | $1.17 | 2d | 1 | 0.83mi |
| 1845 Stonehenge Dr Birmingham, AL | 3.0 | 2.0 | 1358 | $1,323 | $0.97 | 14d | 1 | 0.84mi |
| 434 15th Ter NW Center Point, AL | 3.0 | 2.0 | 1053 | $1,200 | $1.14 | 43d | 1 | 0.87mi |
| 108 13th Ave NW Center Point, AL | 4.0 | 2.0 | 1444 | $1,265 | $0.88 | 23d | 1 | 0.87mi |
| 1259 Huffman Rd Center Point, AL | 3.0 | 2.0 | 1662 | $1,556 | $0.94 | 43d | 1 | 0.87mi |
| 1700 4th Pl NW Center Point, AL | 3.0 | 1.0 | 914 | $1,075 | $1.18 | 23d | 1 | 0.88mi |
| 1712 4th Pl NW Center Point, AL | 3.0 | 1.0 | 1182 | $1,150 | $0.97 | 23d | 1 | 0.88mi |
| 1761 Big Mountain Dr Birmingham, AL | 4.0 | 2.0 | 1632 | $1,575 | $0.97 | 44d | 1 | 0.90mi |
| 324 13th Ter NW Center Point, AL | 3.0 | 1.5 | 1418 | $1,295 | $0.91 | 23d | 1 | 0.93mi |
| 413 20th Ct NE Center Point, AL | 3.0 | 1.5 | 1540 | $1,375 | $0.89 | 43d | 1 | 0.94mi |
| 509 20th Ave NE Center Point, AL | 3.0 | 1.5 | 1008 | $1,200 | $1.19 | 23d | 1 | 0.95mi |
| 405 13th Ct NW Center Point, AL | 4.0 | 1.5 | 1248 | $1,415 | $1.13 | 21d | 1 | 0.98mi |
| 1237 Linwood St Birmingham, AL | 3.0 | 1.5 | 1066 | $995 | $0.93 | 43d | 1 | 1.01mi |
| 2229 3rd St NE Center Point, AL | 3.0 | 1.0 | 1215 | $1,125 | $0.93 | 23d | 1 | 1.01mi |
| 1612 Glenwood St NW Center Point, AL | 4.0 | 3.0 | 1344 | $1,480 | $1.10 | 23d | 1 | 1.07mi |
| 744 Vaughn Cir Birmingham, AL | 4.0 | 2.0 | 1516 | $1,561 | $1.03 | 23d | 1 | 1.07mi |
| 500 15th Ave NW Center Point, AL | 3.0 | 1.0 | 1079 | $1,050 | $0.97 | 2d | 1 | 1.07mi |
| 1225 Birchwood St Birmingham, AL | 3.0 | 2.0 | 1092 | $1,175 | $1.08 | 3d | 1 | 1.08mi |
| 1935 Springlake Ct Unit 1 Birmingham, AL | 2.0 | 1.5 | 1152 | $1,095 | $0.95 | 43d | 1 | 1.10mi |
| 1153 Linwood St Birmingham, AL | 3.0 | 2.0 | 1250 | $1,295 | $1.04 | 2d | 1 | 1.10mi |
| 424 Tupelo Way Center Point, AL | 4.0 | 2.0 | 1233 | $1,300 | $1.05 | 43d | 1 | 1.10mi |
Listing history 7 events
-
2026-04-30status Pending
-
2026-04-24$149,900 Active
-
2024-03-11soldstatus $405,066,000
-
2016-04-06soldstatus $12,676,500
-
2015-04-13soldstatus $66,000
-
2008-04-25soldstatus $116,000
-
2000-05-08soldstatus $87,900
ⓘ Source: listings_history table (triggers on properties + properties_extension) + one-shot
backfill from property_details.listing_events for pre-trigger history.
Tax reassessment forecast AL · Resets to sale price
- Current annual tax
- $1,644 · $137/mo
- Projected year-2 tax
- $1,644 · $137/mo
- Expected delta
- $0/yr ($0/mo · 0.0%)
ⓘ Screening estimate from a state-policy table — verify with the county assessor before closing.
Climate risk First Street
- Flood 1/10 Low FEMA zone X (unshaded) · 0% chance over 30 yrs
- Wildfire 2/10 Low
- Heat 6/10 Major 7 d/yr ≥105°F today · 19 d/yr by 30 yrs out
- Wind 6/10 Major 27% chance of damaging wind over 30 yrs
- Air quality 5/10 Major 7 unhealthy d/yr today · 9 by 30 yrs out
Nearby sold comps map
Loading sold comps map…
Walkable amenities ~0.75 mi
Loading nearby amenities…
Taxation est. · year 1
- Rental income
- $15,689
- − Mortgage interest
- −$8,397
- − Property taxes
- −$1,644
- − Insurance
- −$750
- − Repairs & maintenance
- −$1,255
- − Management
- −$1,255
- − Depreciation
- −$4,361
- Taxable loss
- −$1,972
- Est. tax savings @ 24.0%
- +$473
- After-tax cash flow
- $1,041/yr
For passive investors: Depreciation is non-cash, so a rental often shows a tax loss while cash-flowing — sheltering income. Rental losses are passive: they offset passive income freely, and up to $25,000/yr can offset ordinary (W-2) income if you actively participate and your MAGI is under $100k (phasing out to $0 by $150k); unused losses carry forward. On sale, claimed depreciation is recaptured at up to 25%, and gains may owe capital-gains tax (a 1031 exchange can defer both). Figures are a year-1 estimate at your 24.0% rate — not tax advice; consult a CPA.
Schools (NCES district)
- District
- Jefferson County
- NCES district ID
- 0101920
- Math proficiency
- 9% ▼ -24.00%
- Reading proficiency
- 32% ▼ -5.00%
- Median HH income
- $51,712
- Composite
- 18.4/100
- National rank
- #8937
- State rank
- #104 of 129 in AL
Livability — Center Point
- Score
- 63/100
- State rank
- #193
- US rank
- #15671
Category grades
Schools grade is shown separately in the Schools card above.
Census & demographics
- County
- Jefferson County · 527,445 people
- City population
- 43,903
- Metro
- Birmingham-Hoover, AL
- Population (ZIP)
- 43,903
- Household income
- $52,793
- Rent vs Own
- Severe rent burden
- 1729.0
Population outlook (Jefferson County) Hauer SSP2
- Today (2025)
- 669,185 people
- By 2030
- 669,694 · +0.1%
- By 2040
- 661,388 · -1.2%
- By 2050
- 643,086 · -3.9%
- By 2075
- 577,267 · -13.7%
- By 2100
- 474,758 · -29.1%
Race, ethnicity, and origin ACS 2023
- Neighborhood character
- Predominantly Black (75%)
- Race & ethnicity
- Black 75% White 15% Hispanic / Latino 7% Two or more races 3%
- Hispanic origin (detail)
- Mexican 4%
- Common ancestry
- Lithuanian 1% Italian 1% Slovak 1%
- Foreign-born
- 4% · Canada
- Languages at home
- 92% English-only · Spanish 7%
Political lean MEDSL · Jefferson
- 2024 margin
- D (+10.4) · D 54.6% · R 44.2% · Other 1.2%
- 2008→2024 swing
- +5.4pp toward D · 2008: 5.1pp · 2024: 10.4pp
- All cycles
- 2024: D+10.4 2020: D+13.2 2016: D+7.2 2012: D+6.0 2008: D+5.1
Not yet ingested
- Civics
- —
Market trends
- HPI YoY
- ▼ -112.97%
- Current HPI
- 215.0607
- Rent YoY
- ▲ 3.04%
- Metro
- Birmingham-Hoover, AL
- State GDP YoY
- ▲ 2.94%
- F500 in state
- 4
Industry mix (Fortune 500 HQ in AL)
| Industry | F500 HQs | Revenue |
|---|---|---|
| Financial Services | 1 | $8B |
|
||
| Healthcare | 1 | $5B |
|
||
Price history
+70.5% since first listed7 events — show timeline
- 2026-04-30 Pending — Greater Alabama MLS
- 2026-04-24 Listed $149,900 Greater Alabama MLS
- 2024-03-11 Sold (Public Records) $405,066,000 Public Records
- 2016-04-06 Sold (Public Records) $12,676,500 Public Records
- 2015-04-13 Sold (Public Records) $66,000 Public Records
- 2008-04-25 Sold (Public Records) $116,000 Public Records
- 2000-05-08 Sold (Public Records) $87,900 Public Records
Property tax history
+8.2%/yrLatest (2025): $1,644 · +16.3% YoY. Source: county tax records.
Cash-flow waterfall
monthlySold comps — $/sqft
last 12 mo · ≤1 miLoading sold comps…