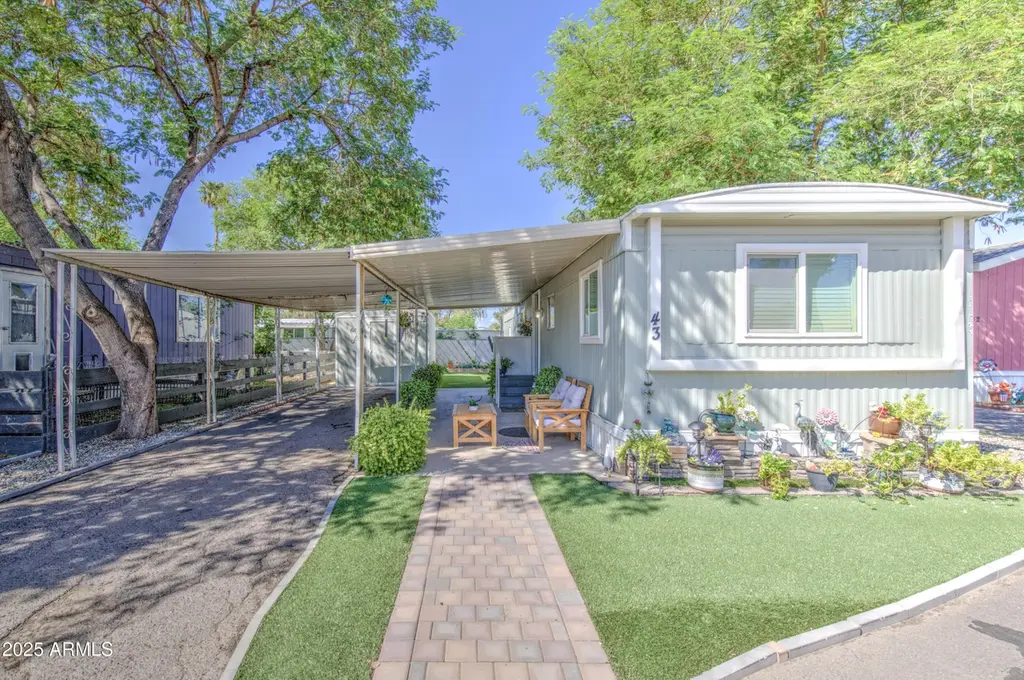
1304 E Bell Rd #43 · Phoenix, AZ
Flood risk 1/10 · Minimal
- FEMA flood zone
- X (shaded)
- Chance of flooding over 30 yrs
- 0.0%
- Est. flood insurance / yr
- $507 – $1,088
Fire risk 4/10 · Minor
- Est. fire insurance / yr
- $610 – $1,132
Heat risk 8/10 · Major
- Hot days now (above 110°F)
- 6 days/yr
- Hot days in 30 yrs
- 15 days/yr
Wind risk 1/10 · Minimal
- Chance of severe wind over 30 yrs
- —
Air-quality risk 3/10 · Minor
- Unhealthy air days now
- 3 days/yr
- Unhealthy air days in 30 yrs
- 4 days/yr
Risk factors via First Street. Map © Google.
Why this score? — see what drove the B grade
The composite is a weighted blend of 9 inputs, each scored 0–100. Each bar is that input's sub-score; the figure is the points it added to the 100-point composite (weight × sub-score).
- Cash flow +30.0/30.0
- 1% rule +10.0/10.0
- DSCR +10.0/10.0
- ARV discount +7.5/15.0
- Condition / age +4.0/5.0
- Schools +3.8/10.0
- Livability +3.8/5.0
- Rent growth +2.2/5.0
- Appreciation +0.0/10.0
$65,000
🖨 Deal sheet 📄 Offer letter ✓ Due diligence
Listing remarks MLS
Welcome to your cozy new home in the heart of a vibrant, amenity-rich community! This charming 2-bedroom, 1-bath residence offers low-maintenance living at its best — perfect for first-time buyers, downsizers, or anyone seeking comfort and convenience. Enjoy access to a sparkling community pool and a welcoming clubhouse, ideal for relaxing or social gatherings. The home is move-in ready and waiting for your personal touch. Don't miss this opportunity to own a piece of peace — come see it today!
Key facts
- 4 parking spots
- Community pool
- Built 1972
Neighborhood map
What this means for you Summary
Snapshot
- This is a 2-bed/1.0-bath manufactured listed at $65k. Condition is rated good.
Deal economics
- At list price, monthly cash flow is $794 ($10k/yr) — positive.
- The deal already cash-flows at list — no discount required.
- Meets the 1% rule at list price ($2k rent vs $65k).
- Recommended offer: $57k (12.0% below list) — sets the bar for market timing.
- Cap rate 20.9% vs local median 3.3% in Phoenix — top-decile yield for the area; either an underpriced asset or a hidden risk that comps aren't pricing in. Stress-test before assuming the spread holds.
Location & tenants
- Location reads 75/100 on livability (#16 in AZ, #3,924 nationally) — a middle-class / working-renter tenant base. Strengths: amenities A+, commute A+, housing A+; Watch: health & safety C-, crime F.
- Paradise Valley Unified District (4241) (urban): math 39% / reading 46% proficiency, ranked #56 of 249 in AZ (top 22%) — families likely to look elsewhere, expect single-tenant / working-renter base with shorter leases.
- Market conditions: Rents soft (-1.2%/yr); 282 active listings in the ZIP; 38 comparable units currently listed for rent nearby; rentals leasing fast (median 8d on market — plan ~1-2 weeks tenant-placement turnaround); 36,011 units permitted in Maricopa County in 2024 (12,801 in 5+ unit buildings).
Forward outlook
- Local home prices are declining (-3.0%/yr); year-one equity from $449 of loan paydown is wiped out by about $2k of value loss. Plan a longer hold.
- Maricopa County population projected at +38% by 2050 — long-run rental-demand tailwind backs the buy-and-hold thesis.
- At projected returns (-3.0% appreciation + 0.0% rent growth), your $18k cash investment doubles in ~3 years — after that, you're playing with house money.
Negotiation context
- It's been on market 237 days — a 12% lower offer ($57k) is reasonable based on typical stale-listing flexibility.
Risks & watch-outs
- Climate carrying-cost: extreme-heat days projected 6→15/yr by 2055 (HVAC capex compounding) — expect insurance premiums to compound above CPI over the hold.
Questions for the listing agent
- It's been on market 237 days. Have you received any prior offers? Is the seller open to a 12% concession, seller financing, or rate buy-down credit?
- Built in 1972 — when were the roof, HVAC, electrical panel, plumbing, and water heater last replaced?
- Why hasn't it sold? Are there any deal-killer items the seller is aware of (foundation, flood, title, zoning, code violations)?
- Is there a deadline driving the sale (1031 exchange, divorce, estate, relocation)? That informs how much negotiation room exists.
- Crime grade is F in this area — have there been break-ins, vandalism, or insurance claims at this property in the last 3 years? What carrier currently insures it and at what premium?
- What's the average days-on-market for RENTAL listings here right now (not sales)? A rising rental-DOM trend means longer vacancies and softer asking-rent achievability than the comps imply.
- What's the recent tenant-quality profile in this submarket — average credit score on applications, eviction rate, late-payment / NSF rate, and stable-employment percentage? A property-management company in the area should have these aggregated.
- How much new for-sale + rental construction is in the pipeline within 1–3 miles? Heavy new supply typically softens prices + rents 12–24 months out; constrained supply supports both.
Investment metrics
- 1% rule
- 2.42% ✓
- Cap rate
- 20.95%
- Cash-on-cash
- 52.33%
- DSCR
- 3.33
- GRM
- 3.4
CMA / ARV
- ARV (median comp)
- $142,691
- List price
- $65,000
- Delta
- -54.45%
- Verdict
- UNDERPRICED
- Comps
- 2 within 1.0 mi
Show comp detail 3 sales within ~0.75 mi
| Address | Dist | Beds/Ba | Sqft | Sold | Price | $/sf | Match |
|---|---|---|---|---|---|---|---|
| 1304 E Bell Rd #100 | 0.10mi | 2/2.0 | 780 (+4%) | 17mo | $35,000 | $45 | 71 |
| 17843 N 16th Pl | 0.60mi | 2/1.0 | 799 (+6%) | 23mo | $9,000 | $11 | 42 |
| 17825 N 7th St #105 | 0.74mi | 2/2.0 | 840 (+12%) | 1mo | $35,000 | $42 | 41 |
Match score weights: distance 35% · size 25% · config 20% · recency 20%. Top-matched comps best support the ARV.
Projected returns pro-forma
-3.0% appreciation · 0.0% rent growth · sell at horizon
- IRR
- 46.9%
- Equity multiple
- 2.95×
- Total profit
- $35,434
- Equity at exit
- $9,692
- IRR
- 51.3%
- Equity multiple
- 5.30×
- Total profit
- $78,229
- Equity at exit
- $5,620
Cash invested: $18,200 (down + closing). Projections, not guarantees.
Landlord ↔ Tenant lean methodology
- Overall (STATE)
- 87 Strongly Landlord-Friendly
- State Arizona
- 87 Strongly Landlord-Friendly · R+3
- County
- — inherits STATE
- City
- — inherits STATE
ZIP-level market 85022
- Rents YoY
- -1.2%
- Active inventory
- 282
- Price-to-rent
- 3.4×
Monthly cashflow live
- Estimated rent
- $1,573 high interval (Pro) →
- Mortgage (P&I)
- −$341
- Tax est. 1.5%
- −$81 /mo · $975/yr
- Insurance
- −$27
- HOA
- −$0
- Vacancy / Maint / Mgmt
- −$330
- Net cashflow
- $794
Break-even live
UW: 25.0% down · 7.5% · 30yr · 1.5% tax · 5.0% vac · 8.0% maint · 8.0% mgmt
Financing live
Cash to close
- Down payment
- $16,250
- Closing costs
- $1,950
- Reserves months
- —
- Total cash needed
- —
Loan-product check · same deal, 3 products live
Conventional
25% down · 7.5% · 30yr
- Down + closing
- —
- Monthly P&I
- —
- Monthly cashflow
- —
- DSCR
- —
- Eligible?
- —
Personal DTI + credit; lowest rate.
DSCR
20% down · 8.5% · 30yr
- Down + closing
- —
- Monthly P&I
- —
- Monthly cashflow
- —
- DSCR
- —
- Eligible?
- —
No personal income docs; deal must DSCR.
Hard money
10% down · 12.0% · 12mo
- Down + closing
- —
- Monthly P&I
- —
- Monthly cashflow
- —
- DSCR
- —
- Eligible?
- —
Short-term bridge; refi at stabilization.
Rent comps 38 comps
| Address | Beds | Baths | Sqft | Rent | $/sqft | DOM | Units | Dist |
|---|---|---|---|---|---|---|---|---|
| 1450 E Bell Rd Phoenix, AZ | 1.0–3.0 | 1.0–2.0 | 957 | $1,555 | $1.62 | 2d | 93 | 0.17mi |
| 17017 N 12th St Phoenix, AZ | 1.0–2.0 | 1.0 | 910 | $2,500 | $2.75 | 24d | 2 | 0.17mi |
| 1100 E Bell Rd Phoenix, AZ | 1.0–3.0 | 1.0–2.0 | 987 | $1,822 | $1.85 | 1d | 26 | 0.22mi |
| 16601 N 12th St Phoenix, AZ | 1.0–3.0 | 1.0–2.0 | 1242 | $1,697 | $1.37 | 1d | 21 | 0.29mi |
| 17617 N 9th St Phoenix, AZ | 1.0–3.0 | 1.0–2.0 | 956 | $1,513 | $1.58 | 1d | 35 | 0.43mi |
| 1130 E Grovers Ave Phoenix, AZ | 2.0 | 2.0 | 934 | $1,336 | $1.43 | 1d | 12 | 0.51mi |
| 17249 N 7th St Phoenix, AZ | 1.0–3.0 | 1.0–2.0 | 956 | $1,518 | $1.59 | 1d | 37 | 0.54mi |
| 1750 E Bell Rd Phoenix, AZ | 1.0–2.0 | 1.0 | 700 | $1,349 | $1.93 | 24d | 1 | 0.56mi |
| 1814 E Bell Rd Phoenix, AZ | 1.0–2.0 | 1.0–2.0 | 1003 | $1,637 | $1.63 | 1d | 12 | 0.62mi |
| 17625 N 7th St Phoenix, AZ | 1.0–3.0 | 1.0–2.0 | 925 | $1,369 | $1.48 | 3d | 7 | 0.65mi |
| 1032 E Villa Maria Dr Phoenix, AZ | 2.0 | 2.0 | 1097 | $1,850 | $1.69 | 19d | 1 | 0.74mi |
| 1032 E Villa Maria Dr Phoenix, AZ | 2.0 | 2.0 | 1097 | $1,850 | $1.69 | 7d | 1 | 0.74mi |
| 719 E Lola Dr Phoenix, AZ | 1.0 | 1.0 | 688 | $2,900 | $4.22 | 7d | 1 | 0.84mi |
| 726 E Villa Rita Dr Phoenix, AZ | 2.0 | 2.0 | 1088 | $2,000 | $1.84 | 10d | 1 | 0.87mi |
| 726 E Villa Rita Dr Phoenix, AZ | 2.0 | 2.0 | 1088 | $2,000 | $1.84 | 18d | 1 | 0.87mi |
| 16220 N 7th St Phoenix, AZ | 1.0–2.0 | 1.0–2.0 | 885 | $1,708 | $1.93 | 1d | 35 | 0.98mi |
| 10 E Bell Rd Phoenix, AZ | 2.0 | 1.0–2.0 | 658 | $1,419 | $2.16 | 1d | 33 | 1.10mi |
| 2067 E Charleston Ave Phoenix, AZ | 2.0 | 2.0 | 840 | $1,395 | $1.66 | 24d | 1 | 1.11mi |
| 2077 E Charleston Ave Phoenix, AZ | 2.0 | 1.0 | 720 | $1,295 | $1.80 | 24d | 1 | 1.13mi |
| 11 E Bell Rd Phoenix, AZ | 1.0–2.0 | 1.0–2.0 | 950 | $1,705 | $1.79 | 1d | 11 | 1.13mi |
| 110 E Greenway Pkwy Phoenix, AZ | 1.0–2.0 | 1.0–2.0 | 866 | $1,455 | $1.68 | 1d | 8 | 1.17mi |
| 18217 N 2nd Pl Phoenix, AZ | 2.0 | 1.0 | 833 | $1,300 | $1.56 | 16d | 1 | 1.17mi |
| 110 W Bell Rd Phoenix, AZ | 1.0 | 1.0 | 845 | $1,499 | $1.77 | 7d | 1 | 1.23mi |
| 16609 N 1st Ave Phoenix, AZ | 2.0 | 1.0 | 910 | $1,350 | $1.48 | 1d | 1 | 1.24mi |
| 110 W Bell Rd Unit 1 Phoenix, AZ | 1.0 | 1.0 | 739 | $1,299 | $1.76 | 24d | 1 | 1.24mi |
| 110 W Bell Rd Unit 2 Phoenix, AZ | 2.0 | 2.0 | 980 | $1,649 | $1.68 | 24d | 1 | 1.24mi |
| 110 W Bell Rd Unit 12 Phoenix, AZ | 1.0 | 1.0 | 856 | $1,399 | $1.63 | 24d | 1 | 1.24mi |
| 17602 N Cave Creek Rd Phoenix, AZ | 2.0 | 1.0–2.0 | 650 | $1,625 | $2.50 | 2d | 13 | 1.28mi |
| 2201 E Kathleen Rd Phoenix, AZ | 3.0 | 2.0 | 1068 | $2,405 | $2.25 | 24d | 1 | 1.32mi |
| 220 W Bell Rd Phoenix, AZ | 1.0–3.0 | 1.0–2.0 | 1082 | $1,564 | $1.45 | 1d | 32 | 1.35mi |
| 18202 N Cave Creek Rd Phoenix, AZ | 1.0–3.0 | 1.0–2.0 | 722 | $1,148 | $1.59 | 3d | 7 | 1.45mi |
| 2424 E Grandview Rd Apt 310 Phoenix, AZ | 2.0 | 1.0 | 700 | $942 | $1.35 | 24d | 1 | 1.46mi |
| 2424 E Grandview Rd Unit 107 Phoenix, AZ | 2.0 | 1.0 | 700 | $829 | $1.18 | 24d | 1 | 1.46mi |
| 2424 E Grandview Rd Unit 312 Phoenix, AZ | 1.0 | 1.0 | 550 | $856 | $1.56 | 21d | 1 | 1.46mi |
| 2424 E Grandview Rd Unit 112 Phoenix, AZ | 1.0 | 1.0 | 550 | $856 | $1.56 | 24d | 1 | 1.46mi |
| 2424 E Grandview Rd Phoenix, AZ | 2.0 | 1.0 | 700 | $942 | $1.35 | 21d | 1 | 1.46mi |
| 2424 E Grandview Rd Phoenix, AZ | 2.0 | 1.0 | 700 | $1,159 | $1.66 | 24d | 1 | 1.46mi |
| 2424 E Grandview Rd Phoenix, AZ | 2.0 | 1.0 | 575 | $942 | $1.64 | 4d | 6 | 1.46mi |
Listing history 16 events
-
2026-06-18days on market $65,000 Active 237 DOM
-
2026-06-17days on market $65,000 Active 236 DOM
-
2026-06-16days on market $65,000 Active 235 DOM
-
2026-06-15days on market $65,000 Active 234 DOM
-
2026-06-13days on market $65,000 Active 232 DOM
-
2026-06-13days on market $65,000 Active 231 DOM
-
2026-06-09days on market $65,000 Active 228 DOM
-
2026-06-08days on market $65,000 Active 227 DOM
-
2026-06-07days on market $65,000 Active 226 DOM
-
2026-06-04days on market $65,000 Active 223 DOM
-
2026-06-03days on market $65,000 Active 222 DOM
-
2026-06-02days on market $65,000 Active 221 DOM
-
2026-06-01days on market $65,000 Active 220 DOM
-
2026-05-31days on market $65,000 Active 219 DOM
-
2025-11-10price $65,000 511-char remark
Show marketing remark (511 chars)
Welcome to your cozy new home in the heart of a vibrant, amenity-rich community! This charming 2-bedroom, 1-bath residence offers low-maintenance living at its best — perfect for first-time buyers, downsizers, or anyone seeking comfort and convenience. Enjoy access to a sparkling community pool and a welcoming clubhouse, ideal for relaxing or social gatherings. The home is move-in ready and waiting for your personal touch. Don't miss this opportunity to own a piece of peace — come see it today!
-
2025-10-24$70,000 Active 511-char remark
Show marketing remark (511 chars)
Welcome to your cozy new home in the heart of a vibrant, amenity-rich community! This charming 2-bedroom, 1-bath residence offers low-maintenance living at its best — perfect for first-time buyers, downsizers, or anyone seeking comfort and convenience. Enjoy access to a sparkling community pool and a welcoming clubhouse, ideal for relaxing or social gatherings. The home is move-in ready and waiting for your personal touch. Don't miss this opportunity to own a piece of peace — come see it today!
ⓘ Source: listings_history table (triggers on properties + properties_extension) + one-shot
backfill from property_details.listing_events for pre-trigger history.
Climate risk First Street
- Flood 1/10 Low FEMA zone X (shaded) · 0% chance over 30 yrs
- Wildfire 4/10 Moderate
- Heat 8/10 Severe 6 d/yr ≥110°F today · 15 d/yr by 30 yrs out
- Wind 1/10 Low
- Air quality 3/10 Moderate 3 unhealthy d/yr today · 4 by 30 yrs out
Nearby sold comps map
Loading sold comps map…
Walkable amenities ~0.75 mi
Loading nearby amenities…
Taxation est. · year 1
- Rental income
- $18,880
- − Mortgage interest
- −$3,641
- − Property taxes
- −$975
- − Insurance
- −$325
- − Repairs & maintenance
- −$1,510
- − Management
- −$1,510
- − Depreciation
- −$1,891
- Taxable income
- $9,027
- Est. tax owed @ 24.0%
- −$2,167
- After-tax cash flow
- $7,358/yr
For passive investors: Depreciation is non-cash, so a rental often shows a tax loss while cash-flowing — sheltering income. Rental losses are passive: they offset passive income freely, and up to $25,000/yr can offset ordinary (W-2) income if you actively participate and your MAGI is under $100k (phasing out to $0 by $150k); unused losses carry forward. On sale, claimed depreciation is recaptured at up to 25%, and gains may owe capital-gains tax (a 1031 exchange can defer both). Figures are a year-1 estimate at your 24.0% rate — not tax advice; consult a CPA.
Condition & rehab AI · 9 photos
This move-in ready manufactured home offers a good condition with a good condition score of 80. It has a good kitchen, good bathrooms, good exterior, good flooring, good interior walls/paint, good roof, good windows, good foundation/structure, good HVAC/mechanicals, and good landscaping/curb appeal. The home is ready for a fresh coat of paint, new countertops, new flooring in bathrooms, and new lighting fixtures to further increase its value.
Value-add opportunities
- Both Paint interior walls — Fresh paint can enhance curb appeal and interior aesthetics
- Both Replace countertops — Modern countertops can increase both resale and rental value
- Both Install new flooring in bathrooms — New flooring can improve both resale and rental value
- Both Upgrade lighting fixtures — Modern lighting can enhance the home's appeal and energy efficiency
Renovation cost estimate screening
Value-add ROI direction
- Both Paint interior walls — Fresh paint can enhance curb appeal and interior aesthetics ↑
- Both Replace countertops — Modern countertops can increase both resale and rental value ↑
- Both Install new flooring in bathrooms — New flooring can improve both resale and rental value ↑
- Both Upgrade lighting fixtures — Modern lighting can enhance the home's appeal and energy efficiency ↑
ⓘ Cost ranges are severity-bucket heuristics (US national rule-of-thumb). Get contractor quotes + a written scope before underwriting a rehab budget.
Schools (NCES district)
- District
- Paradise Valley Unified District (4241)
- NCES district ID
- 0405930
- Math proficiency
- 39% ▼ -11.00%
- Reading proficiency
- 46% ▼ -7.00%
- Median HH income
- $64,106
- Composite
- 37.89/100
- National rank
- #4316
- State rank
- #56 of 249 in AZ
Livability — Phoenix
- Score
- 75/100
- State rank
- #16
- US rank
- #3924
Category grades
Schools grade is shown separately in the Schools card above.
Census & demographics
- Census place
- Phoenix, AZ
- County
- Maricopa County · 4,537,380 people
- City population
- 1,500,198
- Metro
- Phoenix-Mesa-Chandler, AZ
- Population (ZIP)
- 53,811
- Household income
- $69,927
- Rent vs Own
- Severe rent burden
- 2976.0
Population outlook (Maricopa County) Hauer SSP2
- Today (2025)
- 4,979,203 people
- By 2030
- 5,378,229 · +8.0%
- By 2040
- 6,156,598 · +23.6%
- By 2050
- 6,872,376 · +38.0%
- By 2075
- 8,401,270 · +68.7%
- By 2100
- 9,247,439 · +85.7%
Race, ethnicity, and origin ACS 2023
- Neighborhood character
- Diverse neighborhood (Simpson 0.59)
- Race & ethnicity
- White 59% Hispanic / Latino 22% Two or more races 11% Black 10% Asian 3% Native American 3%
- Hispanic origin (detail)
- Mexican 18%
- Common ancestry
- Romanian 3% Lithuanian 2% Italian 1%
- Foreign-born
- 14% · Canada, China, Vietnam
- Languages at home
- 79% English-only · Spanish 13% Other Indo-European 2% Russian/Polish/Slavic 1%
Political lean MEDSL · Maricopa
- 2024 margin
- Toss-up / Even · D 47.7% · R 51.2% · Other 1.1%
- 2008→2024 swing
- +7.1pp toward D · 2008: -10.6pp · 2024: -3.5pp
- All cycles
- 2024: R+3.5 2020: D+2.2 2016: R+3.5 2012: R+12.0 2008: R+10.6
Not yet ingested
- Civics
- —
Market trends
- HPI YoY
- ▼ -329.75%
- Current HPI
- 313.5085
- Rent YoY
- ▼ -1.21%
- Metro
- Phoenix-Mesa-Chandler, AZ
- State GDP YoY
- ▲ 4.54%
- F500 in state
- 20
Industry mix (Fortune 500 HQ in AZ)
| Industry | F500 HQs | Revenue |
|---|---|---|
| Technology | 2 | $13B |
|
||
| Mining / Metals | 1 | $23B |
|
||
| Environmental Services | 1 | $16B |
|
||
| Metals / Steel | 1 | $14B |
|
||
| Technology Distribution | 1 | $9B |
|
||
| Homebuilding | 1 | $8B |
|
||
Price history
-7.1% since first listed2 events — show timeline
- 2025-11-10 Price Changed $65,000 ARMLS
- 2025-10-24 Listed $70,000 ARMLS
Cash-flow waterfall
monthlySold comps — $/sqft
last 12 mo · ≤1 miLoading sold comps…