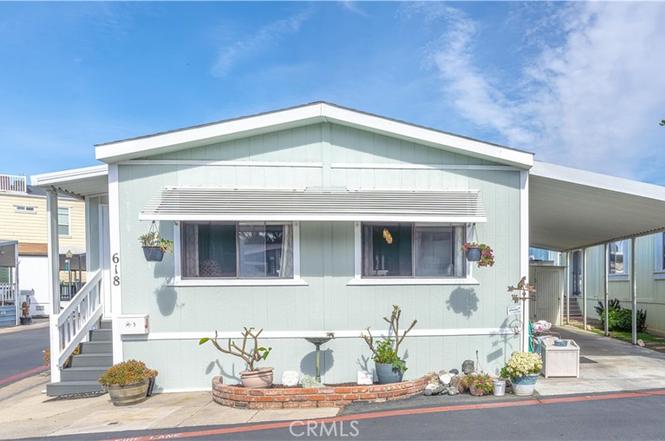
80 Huntington #618 · Huntington Beach, CA
Flood risk No data
- FEMA flood zone
- —
- Chance of flooding over 30 yrs
- —
- Est. flood insurance / yr
- —
Fire risk No data
- Est. fire insurance / yr
- —
Heat risk No data
- Hot days now (above threshold)
- —
- Hot days in 30 yrs
- —
Wind risk No data
- Chance of severe wind over 30 yrs
- —
Air-quality risk No data
- Unhealthy air days now
- —
- Unhealthy air days in 30 yrs
- —
Risk factors via First Street. Map © Google.
Why this score? — see what drove the C grade
The composite is a weighted blend of 9 inputs, each scored 0–100. Each bar is that input's sub-score; the figure is the points it added to the 100-point composite (weight × sub-score).
- Cash flow +15.0/30.0
- ARV discount +15.0/15.0
- Schools +6.5/10.0
- 1% rule +5.0/10.0
- DSCR +5.0/10.0
- Livability +3.4/5.0
- Rent growth +3.2/5.0
- Condition / age +2.5/5.0
- Appreciation +0.0/10.0
$95,000
🖨 Deal sheet 📄 Offer letter ✓ Due diligence
Listing remarks
Surf City Beach Cottages is thrilled to showcase a beautiful 2-bedroom, 2-bathroom coastal retreat. The heart of the home is its elegantly remodeled kitchen, which features an expansive marble island, perfect for casual meals and gatherings, complemented by exquisite marble countertops, a charming farmhouse sink, and a casement window that invites the natural light to pour in. The stylish glass tile backsplash adds a contemporary touch to this gourmet space. This home exudes warmth with luxury vinyl flooring, freshly painted walls, and an inviting atmosphere throughout. Enjoy the practicality of an indoor laundry area that makes everyday tasks a breeze. For relaxation and leisure, you can u
Key facts
- 2,443 sq ft lot
- Community pool
- Built 1986
Property features AI
Finance
- Other: Located in Other (OTHR) subdivision; Directions reference: Huntington Street / Atlanta / PCH; Latitude 33.65576, Longitude -117.993762
- Financial info: Land lease: $3,450 monthly
- HOA & community: Part of an association; Association fees charged monthly; Suburban community
Exterior
- Parking: Covered parking; Carport; Located in Surf City Cottages park
- Utilities: Public sewer; District/Public water
- Home design: Single-story; Mobile home remains; Has a view
- Construction: Mobile home (20' x 48'); Year built per assessor
- Exterior features: Covered porch; Back yard; Association pool
Interior
- Kitchen: Gas range; Gas oven; Appliances included
- Bedrooms: Primary bedroom on the main floor; Additional bedroom on the main floor
- Flooring: Vinyl flooring
- Bathrooms: 2 full bathrooms
- Heating & cooling: Forced air heating
- Interior features: Entry level: 1; Association spa; Main floor primary bedroom; Main floor bedroom; Living room
- Laundry & utility: Laundry inside; Gas dryer hookup; Laundry located in kitchen
Neighborhood map
What this means for you Summary
Snapshot
- This is a 2-bed/2.0-bath manufactured listed at $95k.
Deal economics
- At list price, monthly cash flow is $2k ($30k/yr) — positive.
- The deal already cash-flows at list — no discount required.
- Meets the 1% rule at list price ($4k rent vs $95k).
- Recommended offer: $84k (12.0% below list) — sets the bar for market timing.
- Cap rate 37.8% vs local median 1.6% in Huntington Beach — top-decile yield for the area; either an underpriced asset or a hidden risk that comps aren't pricing in. Stress-test before assuming the spread holds.
Location & tenants
- Location reads 67/100 on livability (#306 in CA) — a middle-class / working-renter tenant base. Strengths: employment A+, commute A-, schools B+; Watch: amenities C-, cost of living F, health & safety F.
- Huntington Beach Union High (suburban): math 65% / reading 82% proficiency, ranked #39 of 517 in CA (top 8%) — strong family-tenant draw, lease renewals of 3-5y typical.
- Market conditions: Rents rising (+2.8%/yr); 135 active listings in the ZIP; 40 comparable units currently listed for rent nearby; rentals leasing fast (median 1d on market — plan ~1-2 weeks tenant-placement turnaround); high-income renter base; 6,974 units permitted in Orange County in 2024 (3,839 in 5+ unit buildings).
- This rent runs 37% of the median local income ($130k/yr) — at the standard rent-burdened threshold; future hikes will face affordability resistance.
Forward outlook
- Local home prices are declining (-3.0%/yr); year-one equity from $657 of loan paydown is wiped out by about $3k of value loss. Plan a longer hold.
- Orange County population projected at +14% by 2050 — modest demand growth; plan on rents tracking national, not racing it.
- At projected returns (-3.0% appreciation + 2.8% rent growth), your $27k cash investment doubles in ~1 year — after that, you're playing with house money.
Negotiation context
- It's been on market 127 days — a 12% lower offer ($84k) is reasonable based on typical stale-listing flexibility.
- 5 sale attempts since 2y ago with the ask held roughly flat each time — persistent listings suggest the price (not the market) is what's stuck; bring a comps-based counter.
Questions for the listing agent
- It's been on market 127 days. Have you received any prior offers? Is the seller open to a 12% concession, seller financing, or rate buy-down credit?
- Why hasn't it sold? Are there any deal-killer items the seller is aware of (foundation, flood, title, zoning, code violations)?
- Is there a deadline driving the sale (1031 exchange, divorce, estate, relocation)? That informs how much negotiation room exists.
- Schools are B-rated — typically a magnet for longer-tenancy family renters. What's the average tenant stay here, and is there a school-zone premium baked into asking?
- What's the average days-on-market for RENTAL listings here right now (not sales)? A rising rental-DOM trend means longer vacancies and softer asking-rent achievability than the comps imply.
- What's the recent tenant-quality profile in this submarket — average credit score on applications, eviction rate, late-payment / NSF rate, and stable-employment percentage? A property-management company in the area should have these aggregated.
- How much new for-sale + rental construction is in the pipeline within 1–3 miles? Heavy new supply typically softens prices + rents 12–24 months out; constrained supply supports both.
Investment metrics
- 1% rule
- 4.19% ✓
- Cap rate
- 37.75%
- Cash-on-cash
- 112.35%
- DSCR
- 6.00
- GRM
- 2.0
CMA / ARV
- ARV (on-the-fly)
- $144,000
- Comps found
- 12
Show comp detail 12 sales within ~0.75 mi
| Address | Dist | Beds/Ba | Sqft | Sold | Price | $/sf | Match |
|---|---|---|---|---|---|---|---|
| 80 Huntington #630 | 0.05mi | 3/2.0 (+1) | 1,251 (+4%) | 2mo | $295,000 | $236 | 84 |
| 80 Huntington #372 | 0.03mi | 2/2.0 | 1,272 (+6%) | 7mo | $73,000 | $57 | 83 |
| 80 Huntington St #646 | 0.07mi | 2/2.0 | 1,152 (-4%) | 10mo | $115,000 | $100 | 82 |
| 80 Huntington St #707 | 0.02mi | 2/2.0 | 1,040 (-13%) | 1mo | $50,000 | $48 | 76 |
| 20701 Beach Blvd #30 | 0.46mi | 3/2.0 (+1) | 1,197 (-0%) | 2mo | $180,000 | $150 | 72 |
| 80 Huntington St #514 | 0.12mi | 2/2.0 | 1,040 (-13%) | 8mo | $58,000 | $56 | 66 |
| 80 Huntington #424 | 0.08mi | 1/1.0 (-1) | 1,038 (-14%) | 3mo | $35,000 | $34 | 63 |
| 20701 Beach Blvd #251 | 0.33mi | 2/2.0 | 1,334 (+11%) | 7mo | $193,500 | $145 | 61 |
| 20701 Beach Blvd #45 | 0.40mi | 2/2.0 | 1,120 (-7%) | 14mo | $199,900 | $178 | 59 |
| 20701 Beach Blvd #280 | 0.39mi | 2/2.0 | 1,349 (+12%) | 11mo | $162,500 | $120 | 52 |
| 20701 Beach Blvd #200 | 0.51mi | 2/2.0 | 1,368 (+14%) | 7mo | $115,000 | $84 | 47 |
| 20701 Beach Blvd #36 | 0.42mi | 3/2.0 (+1) | 1,344 (+12%) | 12mo | $192,000 | $143 | 46 |
Match score weights: distance 35% · size 25% · config 20% · recency 20%. Top-matched comps best support the ARV.
Projected returns pro-forma
-3.0% appreciation · 2.78% rent growth · sell at horizon
- IRR
- —
- Equity multiple
- 6.35×
- Total profit
- $142,408
- Equity at exit
- $14,165
- IRR
- —
- Equity multiple
- 13.21×
- Total profit
- $324,907
- Equity at exit
- $8,214
Cash invested: $26,600 (down + closing). Projections, not guarantees.
Landlord ↔ Tenant lean methodology
- Overall (STATE)
- 18 Strongly Tenant-Friendly
- State California
- 18 Strongly Tenant-Friendly · D+13
- County
- — inherits STATE
- City
- — inherits STATE
ZIP-level market 92648
- Rents YoY
- 2.8%
- Active inventory
- 135
- Price-to-rent
- 2.0×
Monthly cashflow live
- Estimated rent
- $3,984 high interval (Pro) →
- Mortgage (P&I)
- −$498
- Tax est. 1.5%
- −$119 /mo · $1,425/yr
- Insurance
- −$40
- HOA
- −$0
- Vacancy / Maint / Mgmt
- −$837
- Net cashflow
- $2,491
Break-even live
UW: 25.0% down · 7.5% · 30yr · 1.5% tax · 5.0% vac · 8.0% maint · 8.0% mgmt
Financing live
Cash to close
- Down payment
- $23,750
- Closing costs
- $2,850
- Reserves months
- —
- Total cash needed
- —
Loan-product check · same deal, 3 products live
Conventional
25% down · 7.5% · 30yr
- Down + closing
- —
- Monthly P&I
- —
- Monthly cashflow
- —
- DSCR
- —
- Eligible?
- —
Personal DTI + credit; lowest rate.
DSCR
20% down · 8.5% · 30yr
- Down + closing
- —
- Monthly P&I
- —
- Monthly cashflow
- —
- DSCR
- —
- Eligible?
- —
No personal income docs; deal must DSCR.
Hard money
10% down · 12.0% · 12mo
- Down + closing
- —
- Monthly P&I
- —
- Monthly cashflow
- —
- DSCR
- —
- Eligible?
- —
Short-term bridge; refi at stabilization.
Rent comps 40 comps
| Address | Beds | Baths | Sqft | Rent | $/sqft | DOM | Units | Dist |
|---|---|---|---|---|---|---|---|---|
| 80 HUNTINGTON St Huntington Beach, OS | 2.0 | 2.0 | 1276 | $3,825 | $3.00 | 1d | 1 | 0.07mi |
| 7795 Neptune Dr Huntington Beach, CA | 2.0–4.0 | 1.5–2.5 | 1155 | $4,108 | $3.56 | 1d | 3 | 0.14mi |
| 21040 Pacific City Cir Huntington Beach, CA | 1.0–3.0 | 1.0–2.5 | 1137 | $5,989 | $5.27 | 1d | 28 | 0.21mi |
| 229 Atlanta Ave Unit 229 Huntington Beach, CA | 1.0 | 1.0 | 700 | $2,500 | $3.57 | 1d | 1 | 0.23mi |
| 223 Atlanta Ave Huntington Beach, CA | 1.0 | 1.0 | 700 | $2,800 | $4.00 | 1d | 1 | 0.23mi |
| 7946 Waterfall Cir Huntington Beach, CA | 2.0 | 2.5 | 1439 | $4,500 | $3.13 | 1d | 1 | 0.25mi |
| 7623 Bay Dr #103 Huntington Beach, CA | 2.0 | 1.0 | 968 | $3,200 | $3.31 | 1d | 1 | 0.26mi |
| 21270 Beach Blvd Huntington Beach, CA | 2.0 | 1.0–2.0 | 679 | $3,557 | $5.23 | 1d | 12 | 0.33mi |
| 227 1st St Unit 3 Huntington Beach, CA | 2.0 | 2.0 | 1050 | $7,000 | $6.67 | 18d | 1 | 0.34mi |
| 8121 Foxhall Dr Huntington Beach, CA | 3.0 | 1.5 | 1296 | $4,950 | $3.82 | 1d | 1 | 0.42mi |
| 420 Lake St #101 Huntington Beach, CA | 2.0 | 2.0 | 1023 | $4,000 | $3.91 | 19d | 1 | 0.44mi |
| 200 Pacific Coast Hwy Huntington Beach, CA | 1.0–2.0 | 1.0–2.0 | 1064 | $4,900 | $4.61 | 1d | 2 | 0.45mi |
| 200 Pacific Coast Hwy Huntington Beach, CA | 2.0 | 2.0–2.5 | 1299 | $4,575 | $3.52 | 15d | 2 | 0.45mi |
| 509 Delaware St Unit A Huntington Beach, CA | 3.0 | 2.0 | 1200 | $3,200 | $2.67 | 1d | 1 | 0.46mi |
| 430 Lake St #202 Huntington Beach, CA | 2.0 | 2.0 | 1023 | $3,850 | $3.76 | 18d | 1 | 0.47mi |
| 224 Frankfort Ave Huntington Beach, CA | 2.0 | 1.0 | 925 | $3,750 | $4.05 | 1d | 1 | 0.50mi |
| 608 Olive Ave Huntington Beach, CA | 3.0 | 2.0 | 1100 | $4,195 | $3.81 | 15d | 1 | 0.64mi |
| 820 Geneva Ave Unit B Huntington Beach, CA | 2.0 | 1.0 | 750 | $3,200 | $4.27 | 24d | 1 | 0.66mi |
| 626 Lake St #54 Huntington Beach, CA | 3.0 | 3.0 | 1400 | $3,895 | $2.78 | 24d | 1 | 0.70mi |
| 8450 Atlanta Ave Huntington Beach, CA | 1.0–2.0 | 1.0 | 791 | $2,845 | $3.59 | 1d | 9 | 0.72mi |
| 711 Pacific Coast Hwy Huntington Beach, CA | 1.0–3.0 | 1.0–2.0 | 1089 | $6,675 | $6.13 | 1d | 4 | 0.76mi |
| 8461 Lomond Dr Huntington Beach, CA | 3.0 | 1.0 | 950 | $3,800 | $4.00 | 10d | 1 | 0.76mi |
| 711 Pacific Coast Hwy #325 Huntington Beach, CA | 2.0 | 1.0 | 968 | $9,500 | $9.81 | 1d | 1 | 0.76mi |
| 1008 England St Huntington Beach, CA | 3.0 | 2.0 | 1200 | $4,500 | $3.75 | 1d | 1 | 0.77mi |
| 21851 Newland St #104 Huntington Beach, CA | 3.0 | 2.0 | 1248 | $4,000 | $3.21 | 17d | 1 | 0.86mi |
| 8302 Indianapolis Ave Huntington Beach, CA | 3.0 | 2.0 | 1045 | $4,450 | $4.26 | 19d | 1 | 0.89mi |
| 20331 Bluffside Cir #221 Huntington Beach, CA | 1.0 | 1.0 | 767 | $3,000 | $3.91 | 1d | 1 | 0.91mi |
| 20301 Bluffside Cir Unit D110 Huntington Beach, CA | 2.0 | 2.0 | 1101 | $5,250 | $4.77 | 1d | 1 | 0.93mi |
| 403 Memphis Ave Unit 2 Huntington Beach, CA | 2.0 | 1.0 | 900 | $2,500 | $2.78 | 19d | 1 | 0.95mi |
| 311 Memphis Ave Huntington Beach, CA | 2.0 | 1.0 | 820 | $2,595 | $3.16 | 1d | 1 | 0.95mi |
| 220 12th St Unit 17 Huntington Beach, CA | 2.0 | 1.0 | 800 | $2,695 | $3.37 | 6d | 1 | 0.97mi |
| 220 12th St Unit 17 Huntington Beach, CA | 2.0 | 1.0 | 800 | $2,695 | $3.37 | 10d | 1 | 0.97mi |
| 220 12th St Unit 19 Huntington Beach, CA | 1.0 | 1.0 | 756 | $2,595 | $3.43 | 10d | 1 | 0.97mi |
| 308 Nashville Ave Huntington Beach, CA | 2.0 | 1.0 | 1000 | $3,116 | $3.12 | 1d | 1 | 0.99mi |
| 1315 Alabama St Huntington Beach, CA | 3.0 | 2.0 | 1236 | $7,500 | $6.07 | 1d | 1 | 0.99mi |
| 20321 Tidepool Cir Unit 105 Huntington Beach, CA | 2.0 | 2.0 | 1104 | $3,700 | $3.35 | 1d | 1 | 0.99mi |
| 8565 Trinity Cir Unit 821D Huntington Beach, CA | 2.0 | 2.0 | 1077 | $3,450 | $3.20 | 10d | 1 | 1.00mi |
| 8565 Trinity Cir Unit 821D Huntington Beach, CA | 2.0 | 2.0 | 1077 | $3,450 | $3.20 | 1d | 1 | 1.00mi |
| 402 13th St Unit A-D Huntington Beach, CA | 2.0 | 1.0 | 950 | $2,995 | $3.15 | 1d | 1 | 1.02mi |
| 414 13th St Unit C Huntington Beach, CA | 2.0 | 1.0 | 995 | $3,100 | $3.12 | 1d | 1 | 1.03mi |
Listing history 27 events
-
2026-06-18days on market $95,000 Active 127 DOM
-
2026-06-17days on market $95,000 Active 126 DOM
-
2026-06-16days on market $95,000 Active 125 DOM
-
2026-06-15days on market $95,000 Active 124 DOM
-
2026-06-13days on market $95,000 Active 122 DOM
-
2026-06-13days on market $95,000 Active 121 DOM
-
2026-06-09days on market $95,000 Active 118 DOM
-
2026-06-08days on market $95,000 Active 117 DOM
-
2026-06-07days on market $95,000 Active 116 DOM
-
2026-06-04days on market $95,000 Active 113 DOM
-
2026-06-03days on market $95,000 Active 112 DOM
-
2026-06-02days on market $95,000 Active 111 DOM
-
2026-06-01days on market $95,000 Active 110 DOM
-
2026-05-31days on market $95,000 Active 109 DOM
-
2026-02-11$95,000 Active
-
2025-10-02historical
-
2025-08-21status Active
-
2025-08-19status Pending Sale
-
2025-07-22historical Active Under Contract
-
2025-07-01status Active
-
2025-05-02$129,900 Active
-
2024-12-04price $150,000
-
2024-10-21price $165,000
-
2024-09-17price $175,000
-
2024-08-13$189,000 Active
-
2024-08-13price $189,000
-
2024-07-26historical
ⓘ Source: listings_history table (triggers on properties + properties_extension) + one-shot
backfill from property_details.listing_events for pre-trigger history.
Nearby sold comps map
Loading sold comps map…
Walkable amenities ~0.75 mi
Loading nearby amenities…
Taxation est. · year 1
- Rental income
- $47,803
- − Mortgage interest
- −$5,321
- − Property taxes
- −$1,425
- − Insurance
- −$475
- − Repairs & maintenance
- −$3,824
- − Management
- −$3,824
- − Depreciation
- −$2,764
- Taxable income
- $30,169
- Est. tax owed @ 24.0%
- −$7,241
- After-tax cash flow
- $22,645/yr
For passive investors: Depreciation is non-cash, so a rental often shows a tax loss while cash-flowing — sheltering income. Rental losses are passive: they offset passive income freely, and up to $25,000/yr can offset ordinary (W-2) income if you actively participate and your MAGI is under $100k (phasing out to $0 by $150k); unused losses carry forward. On sale, claimed depreciation is recaptured at up to 25%, and gains may owe capital-gains tax (a 1031 exchange can defer both). Figures are a year-1 estimate at your 24.0% rate — not tax advice; consult a CPA.
Schools (NCES district)
- District
- Huntington Beach Union High
- NCES district ID
- 0618060
- Math proficiency
- 65% ▲ 17.00%
- Reading proficiency
- 82% ▲ 8.00%
- Median HH income
- $78,159
- Composite
- 64.9/100
- National rank
- #511
- State rank
- #39 of 517 in CA
Livability — Huntington Beach
- Score
- 67/100
- State rank
- #306
- US rank
- #10298
Category grades
Schools grade is shown separately in the Schools card above.
Census & demographics
- Census place
- Huntington Beach, CA
- County
- Orange County · 3,096,323 people
- City population
- 194,835
- Metro
- Los Angeles-Long Beach-Anaheim, CA
- Population (ZIP)
- 45,827
- Household income
- $130,164
- Rent vs Own
- Severe rent burden
- 2957.0
Population outlook (Orange County) Hauer SSP2
- Today (2025)
- 3,477,456 people
- By 2030
- 3,613,117 · +3.9%
- By 2040
- 3,835,945 · +10.3%
- By 2050
- 3,968,736 · +14.1%
- By 2075
- 4,097,053 · +17.8%
- By 2100
- 3,903,633 · +12.3%
Race, ethnicity, and origin ACS 2023
- Neighborhood character
- Diverse neighborhood (Simpson 0.56)
- Race & ethnicity
- White 63% Hispanic / Latino 16% Two or more races 14% Asian 11%
- Hispanic origin (detail)
- Mexican 11%
- Common ancestry
- Slovak 3% Italian 3% Scotch-Irish 3%
- Foreign-born
- 14% · Canada, Vietnam, China
- Languages at home
- 80% English-only · Spanish 7% Vietnamese 3% Other Indo-European 3%
Political lean MEDSL · Orange
- 2024 margin
- Toss-up / Even · D 49.7% · R 47.1% · Other 3.2%
- 2008→2024 swing
- +5.2pp toward D · 2008: -2.6pp · 2024: 2.6pp
- All cycles
- 2024: D+2.6 2020: D+9.0 2016: D+7.7 2012: R+8.3 2008: R+2.6
Not yet ingested
- Civics
- —
Market trends
- HPI YoY
- ▼ -797.90%
- Current HPI
- 381.1587
- Rent YoY
- ▲ 2.78%
- Metro
- Los Angeles-Long Beach-Anaheim, CA
- State GDP YoY
- ▲ 3.21%
- F500 in state
- 116
Industry mix (Fortune 500 HQ in CA)
| Industry | F500 HQs | Revenue |
|---|---|---|
| Technology | 27 | $1,492B |
|
||
| Financial Services | 3 | $174B |
|
||
| Retail | 3 | $44B |
|
||
| Insurance | 3 | $26B |
|
||
| Media / Entertainment | 2 | $115B |
|
||
| Pharmaceuticals / Biotech | 2 | $62B |
|
||
Price history
-49.7% since first listed13 events — show timeline
- 2026-02-11 Listed $95,000 CRMLS
- 2025-10-02 Listing Removed — CRMLS
- 2025-08-21 Relisted — CRMLS
- 2025-08-19 Pending — CRMLS
- 2025-07-22 Contingent — CRMLS
- 2025-07-01 Relisted — CRMLS
- 2025-05-02 Listed $129,900 CRMLS
- 2024-12-04 Price Changed $150,000 CRMLS
- 2024-10-21 Price Changed $165,000 CRMLS
- 2024-09-17 Price Changed $175,000 CRMLS
- 2024-08-13 Listed $189,000 CRMLS
- 2024-08-13 Price Changed $189,000 CRMLS
- 2024-07-26 Coming Soon — CRMLS
Property tax history
-8.1%/yrLatest (2025): $44 · -0.3% YoY. Source: county tax records.
Cash-flow waterfall
monthlySold comps — $/sqft
last 12 mo · ≤1 miLoading sold comps…