4600 Cinderella Dr · Oklahoma City, OK
Flood risk 1/10 · Minimal
- FEMA flood zone
- X (unshaded)
- Chance of flooding over 30 yrs
- 0.0%
- Est. flood insurance / yr
- $507 – $1,088
Fire risk 2/10 · Minimal
- Est. fire insurance / yr
- $2,463 – $4,575
Heat risk 6/10 · Moderate
- Hot days now (above 107°F)
- 7 days/yr
- Hot days in 30 yrs
- 19 days/yr
Wind risk 2/10 · Minimal
- Chance of severe wind over 30 yrs
- 4.0%
Air-quality risk 1/10 · Minimal
- Unhealthy air days now
- 0 days/yr
- Unhealthy air days in 30 yrs
- 0 days/yr
Risk factors via First Street. Map © Google.
Why this score? — see what drove the C+ grade
The composite is a weighted blend of 9 inputs, each scored 0–100. Each bar is that input's sub-score; the figure is the points it added to the 100-point composite (weight × sub-score).
- Cash flow +22.6/30.0
- ARV discount +12.1/15.0
- DSCR +7.2/10.0
- Appreciation +5.9/10.0
- 1% rule +5.5/10.0
- Livability +4.0/5.0
- Rent growth +2.5/5.0
- Condition / age +2.5/5.0
- Schools +0.7/10.0
$120,000
🖨 Deal sheet 📄 Offer letter ✓ Due diligence
Listing remarks MLS
***Beautiful home in SE Oklahoma City*** 3 bed 1 1/2 bath with converted garage, updated windows, and beautiful modern look. You will love the tile entry room as you walk into the home and the large living space next to it. The kitchen area has a lovely view of the backyard through the large sliding doors. Each bathroom has its own unique touch to it. 1/2 bath is trimmed in shiplapp and full bath has a newly updated tub. Enjoy all the shade that comes with this backyard.*****Down payment Assistance available with Community Action up to $14,999****** ****Multiple Offers, Best due Saturday, September 12 at 5 pm****
Key facts
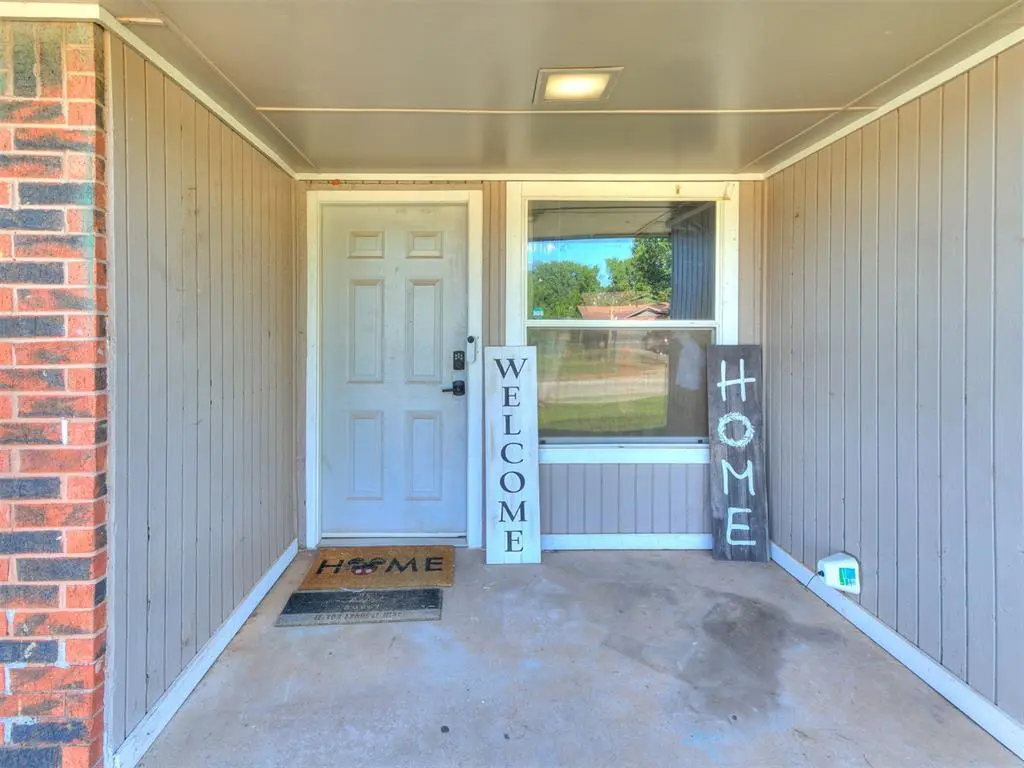
- Private back porch
- Unique tile entryway
- 6,874 sq ft lot
Tags
Property features AI
Finance
- Other: Property listed as vacant; Current price listed (MLS data); Tax amount available (excluded per instructions)
- Financial info: Not assumable
- HOA & community: No mandatory association dues
Exterior
- Home design: Single family residence; One-story; Existing property
- Construction: Brick and frame construction; Composition roof (replaced/updated 2024); Slab foundation
- Exterior features: Porch; Interior lot
Interior
- Bedrooms: 3 bedrooms
- Bathrooms: 1 full bath; 1 half bath
- Interior features: One living area; No fireplace
Neighborhood map
What this means for you Summary
Snapshot
- This is a 3-bed/2.0-bath single-family listed at $120k.
Deal economics
- At list price, monthly cash flow is $203 ($2k/yr) — positive.
- The deal already cash-flows at list — no discount required.
- Meets the 1% rule at list price ($1k rent vs $120k).
- Cap rate 8.3% vs local median 3.7% in Oklahoma City — top-decile yield for the area; either an underpriced asset or a hidden risk that comps aren't pricing in. Stress-test before assuming the spread holds.
Location & tenants
- Location reads 80/100 on livability (#3 in OK, #1,635 nationally) — a professional / high-income tenant draw. Strengths: amenities A+, commute A+, cost of living A+; Watch: crime F.
- Oklahoma City (urban): math 7% / reading 10% proficiency, ranked #254 of 270 in OK (top 94%) — low school quality limits family demand, transient renter base, plan for 1-2y turnover; 82% free/reduced lunch — lower-income household profile, screen leases tightly.
- Zoned schools: Bodine Es (math 2% / reading 2%, grade F, #802 of 845 statewide, top 100%, 638 students, 0% FRL); Capitol Hill Hs (math 2% / reading 4%, grade F, #444 of 447 statewide, top 99%, 1,455 students, 0% FRL) — zoned schools average 0% FRL vs 82% district-wide (82 pts lower); this property's tenant base skews higher-income than the district average.
- Market conditions: 83 active listings in the ZIP; 27 comparable units currently listed for rent nearby; rentals at typical pace (median 21d on market — plan ~3-4 weeks tenant-placement turnaround); 5,365 units permitted in Oklahoma County in 2024 (569 in 5+ unit buildings).
- This rent runs 32% of the median local income ($47k/yr) — at the standard rent-burdened threshold; future hikes will face affordability resistance.
Forward outlook
- In year one you build about $3k of equity ($830 loan paydown + $2k appreciation (1.8% local appreciation)).
- Oklahoma County population projected at +41% by 2050 — long-run rental-demand tailwind backs the buy-and-hold thesis.
- At projected returns (1.8% appreciation + 3.0% rent growth), your $34k cash investment doubles in ~6 years — after that, you're playing with house money.
Negotiation context
- Only 1 days on market — expect competitive offers; lowballing is unlikely to land.
- 8 sale attempts since 9y ago with the ask held roughly flat each time — persistent listings suggest the price (not the market) is what's stuck; bring a comps-based counter.
- Current owner paid $98k; 23% above their basis — modest negotiation headroom, anchor on the comps not their cost.
Risks & watch-outs
- Climate carrying-cost: extreme-heat days projected 7→19/yr by 2055 (HVAC capex compounding) — expect insurance premiums to compound above CPI over the hold.
Questions for the listing agent
- Built in 1977 — when were the roof, HVAC, electrical panel, plumbing, and water heater last replaced?
- Is there a deadline driving the sale (1031 exchange, divorce, estate, relocation)? That informs how much negotiation room exists.
- Schools are F-rated, which usually means shorter tenancies and higher turnover. Who's the typical renter profile here, and what's been the actual vacancy rate?
- Crime grade is F in this area — have there been break-ins, vandalism, or insurance claims at this property in the last 3 years? What carrier currently insures it and at what premium?
- What's the average days-on-market for RENTAL listings here right now (not sales)? A rising rental-DOM trend means longer vacancies and softer asking-rent achievability than the comps imply.
- What's the recent tenant-quality profile in this submarket — average credit score on applications, eviction rate, late-payment / NSF rate, and stable-employment percentage? A property-management company in the area should have these aggregated.
- How much new for-sale + rental construction is in the pipeline within 1–3 miles? Heavy new supply typically softens prices + rents 12–24 months out; constrained supply supports both.
Investment metrics
- 1% rule
- 1.05% ✓
- Cap rate
- 8.33%
- Cash-on-cash
- 7.26%
- DSCR
- 1.32
- GRM
- 7.9
CMA / ARV
- ARV (on-the-fly)
- $133,527
- Comps found
- 12
Show comp detail 12 sales within ~0.75 mi
| Address | Dist | Beds/Ba | Sqft | Sold | Price | $/sf | Match |
|---|---|---|---|---|---|---|---|
| 2417 SW 47th St | 0.12mi | 3/1.0 | 946 (-0%) | 11mo | $143,000 | $151 | 81 |
| 3100 Dentwood Ter | 0.62mi | 3/1.5 | 924 (-2%) | 0mo | $150,000 | $162 | 65 |
| 3101 Dentwood Ter | 0.65mi | 3/1.5 | 948 (+0%) | 9mo | $143,000 | $151 | 60 |
| 3029 Dentwood Ter | 0.64mi | 3/1.5 | 926 (-2%) | 7mo | $128,000 | $138 | 59 |
| 2804 SE 47th St | 0.35mi | 3/1.5 | 892 (-6%) | 16mo | $77,000 | $86 | 58 |
| 4913 S Madera Ter | 0.31mi | 3/1.5 | 1,035 (+9%) | 12mo | $92,500 | $89 | 58 |
| 3013 Chetwood Dr | 0.68mi | 3/1.0 | 959 (+1%) | 8mo | $89,000 | $93 | 55 |
| 3117 Lazy Ln | 0.73mi | 3/1.5 | 978 (+3%) | 9mo | $138,000 | $141 | 51 |
| 3124 Lazy Ln | 0.71mi | 3/1.0 | 918 (-3%) | 12mo | $130,000 | $142 | 47 |
| 3000 Chetwood Dr | 0.64mi | 3/1.5 | 1,064 (+12%) | 3mo | $100,000 | $94 | 45 |
| 3033 Neighbors Ln | 0.68mi | 2/1.0 (-1) | 884 (-7%) | 14mo | $94,500 | $107 | 37 |
| 3008 Overland Dr | 0.69mi | 3/1.5 | 1,071 (+13%) | 12mo | $175,000 | $163 | 34 |
Match score weights: distance 35% · size 25% · config 20% · recency 20%. Top-matched comps best support the ARV.
Projected returns pro-forma
1.75% appreciation · 3.0% rent growth · sell at horizon
- IRR
- 11.0%
- Equity multiple
- 1.58×
- Total profit
- $19,635
- Equity at exit
- $45,697
- IRR
- 14.1%
- Equity multiple
- 2.84×
- Total profit
- $61,940
- Equity at exit
- $64,572
Cash invested: $33,600 (down + closing). Projections, not guarantees.
Landlord ↔ Tenant lean methodology
- Overall (STATE)
- 83 Strongly Landlord-Friendly
- State Oklahoma
- 83 Strongly Landlord-Friendly · R+20
- County
- — inherits STATE
- City
- — inherits STATE
ZIP-level market 73129
- Home prices YoY
- 0.7%
- Active inventory
- 83
- Price-to-rent
- 7.9×
Monthly cashflow live
- Estimated rent
- $1,260 high interval (Pro) →
- Mortgage (P&I)
- −$629
- Tax from tax record
- −$113 /mo · $1,357/yr
- Insurance
- −$50
- HOA
- −$0
- Vacancy / Maint / Mgmt
- −$265
- Net cashflow
- $203
Break-even live
UW: 25.0% down · 7.5% · 30yr · 1.5% tax · 5.0% vac · 8.0% maint · 8.0% mgmt
Financing live
Cash to close
- Down payment
- $30,000
- Closing costs
- $3,600
- Reserves months
- —
- Total cash needed
- —
Loan-product check · same deal, 3 products live
Conventional
25% down · 7.5% · 30yr
- Down + closing
- —
- Monthly P&I
- —
- Monthly cashflow
- —
- DSCR
- —
- Eligible?
- —
Personal DTI + credit; lowest rate.
DSCR
20% down · 8.5% · 30yr
- Down + closing
- —
- Monthly P&I
- —
- Monthly cashflow
- —
- DSCR
- —
- Eligible?
- —
No personal income docs; deal must DSCR.
Hard money
10% down · 12.0% · 12mo
- Down + closing
- —
- Monthly P&I
- —
- Monthly cashflow
- —
- DSCR
- —
- Eligible?
- —
Short-term bridge; refi at stabilization.
Rent comps 27 comps
| Address | Beds | Baths | Sqft | Rent | $/sqft | DOM | Units | Dist |
|---|---|---|---|---|---|---|---|---|
| 4816 S Fairmont Ave Oklahoma City, OK | 3.0 | 2.0 | 1091 | $1,275 | $1.17 | 23d | 1 | 0.19mi |
| 4909 Cinderella Dr Oklahoma City, OK | 3.0 | 2.0 | 1113 | $1,150 | $1.03 | 2d | 1 | 0.23mi |
| 2621 SE 50th St Oklahoma City, OK | 3.0 | 1.5 | 1022 | $1,150 | $1.13 | 1d | 1 | 0.38mi |
| 2908 SE 47th St Oklahoma City, OK | 3.0 | 1.0 | 1100 | $1,350 | $1.23 | 2d | 1 | 0.44mi |
| 3005 SE 51st St Oklahoma City, OK | 2.0 | 1.0 | 842 | $995 | $1.18 | 43d | 1 | 0.70mi |
| 3305 Neighbors Ln Oklahoma City, OK | 3.0 | 1.0 | 945 | $1,250 | $1.32 | 2d | 1 | 0.78mi |
| 5024 Brookdale St Oklahoma City, OK | 3.0 | 1.5 | 1039 | $1,550 | $1.49 | 21d | 1 | 0.78mi |
| 5216 Foster Dr Oklahoma City, OK | 3.0 | 1.5 | 894 | $995 | $1.11 | 43d | 1 | 0.80mi |
| 1528 SE 47th Pl Oklahoma City, OK | 3.0 | 1.0 | 1092 | $1,300 | $1.19 | 3d | 1 | 0.93mi |
| 5316 S Briarwood Dr Oklahoma City, OK | 3.0 | 2.0 | 980 | $1,149 | $1.17 | 23d | 1 | 0.96mi |
| 3205 SE 55th St Oklahoma City, OK | 3.0 | 1.5 | 1119 | $1,300 | $1.16 | 43d | 1 | 0.98mi |
| 1528 SE 49th Ter Oklahoma City, OK | 3.0 | 1.0 | 912 | $1,100 | $1.21 | 23d | 1 | 0.98mi |
| 3451 SE 44th St Oklahoma City, OK | 1.0–3.0 | 1.0–2.0 | 974 | $950 | $0.98 | 11d | 4 | 0.98mi |
| 3451 SE 44th St Unit 269 Del City, OK | 2.0 | 1.0 | 924 | $850 | $0.92 | 2d | 1 | 0.98mi |
| 1501 SE 52nd St Oklahoma City, OK | 3.0 | 2.0 | 1012 | $1,200 | $1.19 | 23d | 1 | 1.11mi |
| 3409 Parker Dr Oklahoma City, OK | 3.0 | 1.0 | 918 | $1,250 | $1.36 | 3d | 1 | 1.13mi |
| 3424 Parker Dr Oklahoma City, OK | 3.0 | 1.0 | 1125 | $450 | $0.40 | 43d | 1 | 1.14mi |
| 1413 SE 39th St Oklahoma City, OK | 3.0 | 1.0 | 1004 | $1,125 | $1.12 | 43d | 1 | 1.16mi |
| 4004 SE 45th Ter Oklahoma City, OK | 3.0 | 1.0 | 1006 | $995 | $0.99 | 23d | 1 | 1.27mi |
| 4008 SE 47th St Oklahoma City, OK | 3.0 | 1.5 | 1082 | $1,145 | $1.06 | 2d | 1 | 1.32mi |
| 4104 SE 45th Ter Oklahoma City, OK | 4.0 | 1.5 | 1111 | $1,275 | $1.15 | 1d | 1 | 1.34mi |
| 4101 SE 48th St Oklahoma City, OK | 3.0 | 1.0 | 974 | $1,245 | $1.28 | 16d | 1 | 1.34mi |
| 4917 S Karen St Oklahoma City, OK | 3.0 | 1.5 | 960 | $1,100 | $1.15 | 23d | 1 | 1.35mi |
| 4128 SE 43rd St Oklahoma City, OK | 3.0 | 1.0 | 620 | $1,275 | $2.06 | 23d | 1 | 1.37mi |
| 3925 SE 59th St Oklahoma City, OK | 2.0 | 1.5 | 993 | $1,211 | $1.22 | 21d | 1 | 1.40mi |
| 3224 SE 24th St Oklahoma City, OK | 3.0 | 1.0 | 1122 | $1,195 | $1.07 | 4d | 1 | 1.45mi |
| 4217 SE 48th Ter Oklahoma City, OK | 3.0 | 1.5 | 1043 | $1,295 | $1.24 | 23d | 1 | 1.49mi |
Listing history 3 events
-
2026-06-05status $120,000 Pending 1 DOM
-
2026-06-03remarks 344-char remark
-
2026-06-03$120,000 Active 1 DOM
ⓘ Source: listings_history table (triggers on properties + properties_extension) + one-shot
backfill from property_details.listing_events for pre-trigger history.
Tax reassessment forecast OK · Resets to sale price
- Current annual tax
- $1,357 · $113/mo
- Projected year-2 tax
- $1,357 · $113/mo
- Expected delta
- $0/yr ($0/mo · 0.0%)
ⓘ Screening estimate from a state-policy table — verify with the county assessor before closing.
Climate risk First Street
- Flood 1/10 Low FEMA zone X (unshaded) · 0% chance over 30 yrs
- Wildfire 2/10 Low
- Heat 6/10 Major 7 d/yr ≥107°F today · 19 d/yr by 30 yrs out
- Wind 2/10 Low 4% chance of damaging wind over 30 yrs
- Air quality 1/10 Low 0 unhealthy d/yr today · 0 by 30 yrs out
Nearby sold comps map
Loading sold comps map…
Walkable amenities ~0.75 mi
Loading nearby amenities…
Taxation est. · year 1
- Rental income
- $15,124
- − Mortgage interest
- −$6,722
- − Property taxes
- −$1,357
- − Insurance
- −$600
- − Repairs & maintenance
- −$1,210
- − Management
- −$1,210
- − Depreciation
- −$3,491
- Taxable income
- $534
- Est. tax owed @ 24.0%
- −$128
- After-tax cash flow
- $2,311/yr
For passive investors: Depreciation is non-cash, so a rental often shows a tax loss while cash-flowing — sheltering income. Rental losses are passive: they offset passive income freely, and up to $25,000/yr can offset ordinary (W-2) income if you actively participate and your MAGI is under $100k (phasing out to $0 by $150k); unused losses carry forward. On sale, claimed depreciation is recaptured at up to 25%, and gains may owe capital-gains tax (a 1031 exchange can defer both). Figures are a year-1 estimate at your 24.0% rate — not tax advice; consult a CPA.
Schools (NCES district)
- District
- Oklahoma City
- NCES district ID
- 4022770
- Math proficiency
- 7% ▼ -5.00%
- Reading proficiency
- 10% ▼ -6.00%
- Median HH income
- $35,606
- Composite
- 7.0/100
- National rank
- #9970
- State rank
- #254 of 270 in OK
Livability — Oklahoma City
- Score
- 80/100
- State rank
- #3
- US rank
- #1635
Category grades
Schools grade is shown separately in the Schools card above.
Census & demographics
- Census place
- Oklahoma City, OK
- County
- Oklahoma County · 771,644 people
- City population
- 498,656
- Metro
- Oklahoma City, OK
- Population (ZIP)
- 20,014
- Household income
- $46,670
- Rent vs Own
- Severe rent burden
- 611.0
Population outlook (Oklahoma County) Hauer SSP2
- Today (2025)
- 911,875 people
- By 2030
- 982,413 · +7.7%
- By 2040
- 1,130,468 · +24.0%
- By 2050
- 1,288,422 · +41.3%
- By 2075
- 1,711,482 · +87.7%
- By 2100
- 2,088,448 · +129.0%
Race, ethnicity, and origin ACS 2023
- Neighborhood character
- Diverse neighborhood (Simpson 0.61)
- Race & ethnicity
- Hispanic / Latino 57% Two or more races 26% White 26% Black 9% Native American 7% Asian 1%
- Hispanic origin (detail)
- Mexican 53%
- Common ancestry
- Italian 1% Lithuanian 1% Slovak 1%
- Foreign-born
- 24% · Canada, Dominican Republic
- Languages at home
- 54% English-only · Spanish 44% Other Asian/Pacific 1% Vietnamese 1%
Political lean MEDSL · Oklahoma
- 2024 margin
- Toss-up / Even · D 48.0% · R 49.7% · Other 2.3%
- 2008→2024 swing
- +15.1pp toward D · 2008: -16.8pp · 2024: -1.7pp
- All cycles
- 2024: R+1.7 2020: R+1.1 2016: R+10.5 2012: R+16.7 2008: R+16.8
Not yet ingested
- Civics
- —
Market trends
- HPI YoY
- ▲ 1.75%
- Current HPI
- 250.8581
- Rent YoY
- —
- Metro
- Oklahoma City, OK
- State GDP YoY
- ▲ 1.55%
- F500 in state
- 6
Industry mix (Fortune 500 HQ in OK)
| Industry | F500 HQs | Revenue |
|---|---|---|
| Energy | 3 | $48B |
|
||
Price history
+380.0% since first listed25 events — show timeline
- 2026-06-03 Listed $120,000 MLSOK
- 2020-10-23 Sold (MLS) $97,500 MLSOK
- 2020-09-14 Pending — MLSOK
- 2020-09-11 Relisted — MLSOK
- 2020-09-09 Pending — MLSOK
- 2020-09-08 Listed $95,000 MLSOK
- 2018-10-01 Sold (Public Records) $85,000 Public Records
- 2018-10-01 Sold (MLS) $85,000 MLSOK
- 2018-08-13 Pending — MLSOK
- 2018-08-10 Price Changed $89,900 MLSOK
- 2018-08-01 Listed $95,000 MLSOK
- 2018-04-02 Sold (MLS) $41,000 MLSOK
- 2018-03-29 Pending — MLSOK
- 2018-03-03 Price Changed $59,500 MLSOK
- 2018-02-27 Price Changed $63,500 MLSOK
- 2018-02-19 Price Changed $64,500 MLSOK
- 2018-02-19 Price Changed $62,500 MLSOK
- 2018-02-19 Relisted — MLSOK
- 2018-02-05 Listing Removed — MLSOK
- 2018-02-01 Relisted — MLSOK
- 2017-12-31 Listing Removed — MLSOK
- 2017-12-28 Relisted — MLSOK
- 2017-12-20 Listing Removed — MLSOK
- 2017-12-08 Listed $59,000 MLSOK
- 1988-12-01 Sold (Public Records) $25,000 Public Records
Property tax history
+5.8%/yrLatest (2025): $1,357 · +4.4% YoY. Source: county tax records.
Cash-flow waterfall
monthlySold comps — $/sqft
last 12 mo · ≤1 miLoading sold comps…