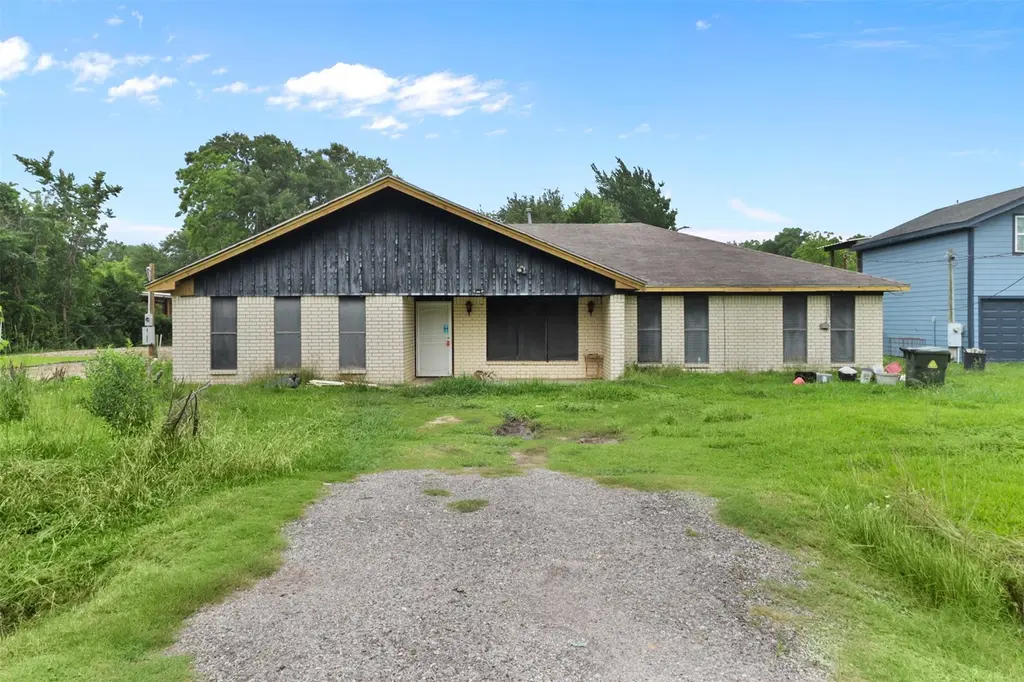
4717 17th St · Bacliff, TX
Flood risk 7/10 · Major
- FEMA flood zone
- X (shaded)
- Chance of flooding over 30 yrs
- 0.76%
- Est. flood insurance / yr
- $507 – $1,088
Fire risk 4/10 · Minor
- Est. fire insurance / yr
- $1,222 – $2,270
Heat risk 10/10 · Severe
- Hot days now (above 109°F)
- 7 days/yr
- Hot days in 30 yrs
- 26 days/yr
Wind risk 9/10 · Severe
- Chance of severe wind over 30 yrs
- 99.0%
Air-quality risk 2/10 · Minimal
- Unhealthy air days now
- 1 days/yr
- Unhealthy air days in 30 yrs
- 1 days/yr
Risk factors via First Street. Map © Google.
Why this score? — see what drove the B+ grade
The composite is a weighted blend of 9 inputs, each scored 0–100. Each bar is that input's sub-score; the figure is the points it added to the 100-point composite (weight × sub-score).
- Cash flow +30.0/30.0
- ARV discount +15.0/15.0
- 1% rule +10.0/10.0
- DSCR +10.0/10.0
- Schools +3.5/10.0
- Livability +2.9/5.0
- Rent growth +2.5/5.0
- Condition / age +2.5/5.0
- Appreciation +0.0/10.0
$130,000
🖨 Deal sheet (PDF) 📄 Offer letter ✓ Due diligence
Listing remarks MLS
Great opportunity on this fixer upper. Large single story home 3 bedrooms 2 bathrooms with a possibility of a 3 rd bathroom. Oversized indoor Utility room. 20 minutes to Galveston and 30 minutes from Downtown Houston.
Key facts
- Spacious floor plan
- Large kitchen
- 9,374 sq ft lot
Tags
Property features AI
Exterior
- Utilities: Public water; Public sewer
- Home design: Residential property; Single-story layout; Slab foundation
- Construction: Brick and wood siding exterior; Composition roof; Built in 1967
- Exterior features: Cleared lot in a subdivision
Interior
- Kitchen: Dishwasher; Gas oven
- Bedrooms: Primary bedroom on the first floor (approx. 14 x 17); Three additional first-floor bedrooms (each approx. 12 x 12)
- Bathrooms: Two full bathrooms; One half bathroom
- Heating & cooling: Central heating (gas); Window unit heating options; Central air conditioning; Window unit(s) for cooling; Gas for cooling
- Interior features: Tub with shower; Seller disclosure available
- Laundry & utility: Washer hookup; Electric dryer hookup
Neighborhood map
What this means for you Summary
Snapshot
- This is a 4-bed/2.5-bath single-family listed at $130k.
Deal economics
- At list price, monthly cash flow is $477 ($6k/yr) — positive.
- The deal already cash-flows at list — no discount required.
- Meets the 1% rule at list price ($2k rent vs $130k).
- Cap rate 11.3% vs local median 5.1% in Bacliff — top-decile yield for the area; either an underpriced asset or a hidden risk that comps aren't pricing in. Stress-test before assuming the spread holds.
Location & tenants
- Location reads 57/100 on livability (#1,252 in TX) — a working-class tenant base; expect higher turnover. Strengths: cost of living A+, housing A+; Watch: employment D+, crime D, amenities F.
- Dickinson ISD (suburban): math 39% / reading 40% proficiency, ranked #366 of 826 in TX (top 44%) — families likely to look elsewhere, expect single-tenant / working-renter base with shorter leases; 60% free/reduced lunch — lower-income household profile, screen leases tightly.
- Zoned schools: Kenneth E Little El (math 32% / reading 25%, grade F, #2,706 of 4,322 statewide, top 63%, 648 students, 88% FRL); Dunbar Middle (math 25% / reading 20%, grade F, #1,341 of 1,662 statewide, top 82%, 654 students, 78% FRL); Dickinson H S (math 30% / reading 46%, grade F, #880 of 1,632 statewide, top 54%, 3,619 students, 64% FRL) — zoned schools average 77% FRL vs 60% district-wide (16 pts higher); higher-poverty schools than district average — tighter screening recommended.
- Market conditions: 62 active listings in the ZIP; 4 comparable units currently listed for rent nearby; rentals leasing fast (median 13d on market — plan ~1-2 weeks tenant-placement turnaround); 3,258 units permitted in Galveston County in 2024 (0 in 5+ unit buildings).
- At $2,224/mo this rent would consume 52% of the median local household income ($51k/yr) (locally 672% of renters already pay >50% of income on rent) — very limited rent-growth headroom before tenants either downsize or default.
Forward outlook
- Local home prices are declining (-3.0%/yr); year-one equity from $899 of loan paydown is wiped out by about $4k of value loss. Plan a longer hold.
- Galveston County population projected at +43% by 2050 — long-run rental-demand tailwind backs the buy-and-hold thesis.
- At projected returns (-3.0% appreciation + 3.0% rent growth), your $36k cash investment doubles in ~8 years — after that, you're playing with house money.
Negotiation context
- Only 14 days on market — expect competitive offers; lowballing is unlikely to land.
- 8 sale attempts since 9y ago; this cycle's ask has dropped $10k (7%) from the opening price — seller is motivated, your offer sets the floor, not the list.
Risks & watch-outs
- Watch-outs: property tax is 4.4% of price; flood insurance adds $66/mo.
- Climate carrying-cost: major flood risk; severe wind risk, 99% chance of damaging wind over 30y; extreme-heat days projected 7→26/yr by 2055 (HVAC capex compounding) — expect insurance premiums to compound above CPI over the hold.
Questions for the listing agent
- Built in 1967 — when were the roof, HVAC, electrical panel, plumbing, and water heater last replaced?
- Property tax is high relative to price — has the assessment been appealed recently, and will the sale trigger a re-assessment?
- What's the actual annual flood-insurance premium (NFIP or private), and is the property in a SFHA with mandatory coverage?
- Is there a deadline driving the sale (1031 exchange, divorce, estate, relocation)? That informs how much negotiation room exists.
- Schools are F-rated, which usually means shorter tenancies and higher turnover. Who's the typical renter profile here, and what's been the actual vacancy rate?
- Crime grade is D in this area — have there been break-ins, vandalism, or insurance claims at this property in the last 3 years? What carrier currently insures it and at what premium?
- What's the average days-on-market for RENTAL listings here right now (not sales)? A rising rental-DOM trend means longer vacancies and softer asking-rent achievability than the comps imply.
- What's the recent tenant-quality profile in this submarket — average credit score on applications, eviction rate, late-payment / NSF rate, and stable-employment percentage? A property-management company in the area should have these aggregated.
- How much new for-sale + rental construction is in the pipeline within 1–3 miles? Heavy new supply typically softens prices + rents 12–24 months out; constrained supply supports both.
Investment metrics
- 1% rule
- 1.71% ✓
- Cap rate
- 11.31%
- Cash-on-cash
- 17.92%
- DSCR
- 1.80
- GRM
- 4.9
CMA / ARV
- ARV (median comp)
- $236,956
- List price
- $130,000
- Delta
- -45.14%
- Verdict
- UNDERPRICED
- Comps
- 20 within 1.0 mi
Show comp detail 12 sales within ~0.75 mi
| Address | Dist | Beds/Ba | Sqft | Sold | Price | $/sf | Match |
|---|---|---|---|---|---|---|---|
| 4717 17th St | 0.00mi | 4/2.5 | 2,130 (0%) | 0mo | $130,000 | $61 | 100 |
| 827 Chase View Dr | 0.26mi | 4/3.0 | 1,993 (-6%) | 3mo | $239,000 | $120 | 73 |
| 4807 Chase Court Dr | 0.26mi | 4/3.5 | 1,999 (-6%) | 6mo | $230,000 | $115 | 69 |
| 3025 Myrtle Beach Ln | 0.50mi | 4/2.0 | 2,081 (-2%) | 8mo | $391,990 | $188 | 65 |
| 3027 Myrtle Beach Ln | 0.49mi | 4/3.0 | 2,229 (+5%) | 7mo | $397,990 | $179 | 61 |
| 4922 Blue Pearl Ln | 0.49mi | 5/3.0 (+1) | 2,190 (+3%) | 6mo | $399,990 | $183 | 61 |
| 3005 Myrtle Beach Ln | 0.57mi | 3/2.0 (-1) | 2,056 (-4%) | 3mo | $396,990 | $193 | 58 |
| 4908 Blue Pearl Ln | 0.54mi | 4/3.0 | 1,984 (-7%) | 4mo | $369,990 | $186 | 58 |
| 3015 Myrtle Beach Ln | 0.53mi | 3/2.0 (-1) | 2,033 (-5%) | 8mo | $329,990 | $162 | 54 |
| 3017 Myrtle Beach Ln | 0.52mi | 3/2.0 (-1) | 2,009 (-6%) | 7mo | $356,990 | $178 | 53 |
| 3021 Myrtle Beach Ln | 0.51mi | 3/2.0 (-1) | 1,891 (-11%) | 7mo | $347,990 | $184 | 44 |
| 3011 Coral Rae Ct | 0.57mi | 3/2.0 (-1) | 1,832 (-14%) | 7mo | $339,900 | $186 | 37 |
Match score weights: distance 35% · size 25% · config 20% · recency 20%. Top-matched comps best support the ARV.
Projected returns pro-forma
-3.0% appreciation · 3.0% rent growth · sell at horizon
- IRR
- 6.7%
- Equity multiple
- 1.26×
- Total profit
- $9,597
- Equity at exit
- $19,383
- IRR
- 16.2%
- Equity multiple
- 2.33×
- Total profit
- $48,582
- Equity at exit
- $11,240
Cash invested: $36,400 (down + closing). Projections, not guarantees.
Landlord ↔ Tenant lean methodology
- Overall (STATE)
- 87 Strongly Landlord-Friendly
- State Texas
- 87 Strongly Landlord-Friendly · R+5
- County
- — inherits STATE
- City
- — inherits STATE
ZIP-level market 77518
- Home prices YoY
- -7.6%
- Active inventory
- 62
- Price-to-rent
- 4.9×
Monthly cashflow live
- Estimated rent
- $2,224 medium interval (Pro) →
- Mortgage (P&I)
- −$682
- Tax from tax record
- −$477 /mo · $5,725/yr
- Insurance
- −$54
- Flood insurance flood zone
- −$66 /mo · $798/yr
- HOA
- −$0
- Vacancy / Maint / Mgmt
- −$467
- Net cashflow
- $477
Break-even live
Sensitivity live
| Price | -10% $551 | -5% $514 | +0% $477 | +5% $440 | +10% $404 |
|---|---|---|---|---|---|
| Rent | -10% $302 | -5% $389 | +0% $477 | +5% $565 | +10% $653 |
| Rate | -1.0pp $543 | -0.5pp $510 | base $477 | +0.5pp $444 | +1.0pp $409 |
UW: 25.0% down · 7.5% · 30yr · 1.5% tax · 5.0% vac · 8.0% maint · 8.0% mgmt
Financing live
Cash to close
- Down payment
- $32,500
- Closing costs
- $3,900
- Reserves months
- —
- Total cash needed
- —
Loan-product check · same deal, 3 products live
Conventional
25% down · 7.5% · 30yr
- Down + closing
- —
- Monthly P&I
- —
- Monthly cashflow
- —
- DSCR
- —
- Eligible?
- —
Personal DTI + credit; lowest rate.
DSCR
20% down · 8.5% · 30yr
- Down + closing
- —
- Monthly P&I
- —
- Monthly cashflow
- —
- DSCR
- —
- Eligible?
- —
No personal income docs; deal must DSCR.
Hard money
10% down · 12.0% · 12mo
- Down + closing
- —
- Monthly P&I
- —
- Monthly cashflow
- —
- DSCR
- —
- Eligible?
- —
Short-term bridge; refi at stabilization.
Rent comps 4 comps
| Address | Beds | Baths | Sqft | Rent | $/sqft | DOM | Units | Dist |
|---|---|---|---|---|---|---|---|---|
| 1118 Chase Park Dr Bacliff, TX | 3.0 | 2.0 | 1854 | $2,046 | $1.10 | 1d | 1 | 0.36mi |
| 339 Sea Breeze Dr Bacliff, TX | 3.0 | 2.5 | 1456 | $1,985 | $1.36 | 6d | 1 | 1.11mi |
| 5139 Misty Ln Bacliff, TX | 3.0 | 2.0 | 1794 | $1,970 | $1.10 | 12d | 1 | 1.17mi |
| 5223 Gulf Stream Ln Bacliff, TX | 3.0 | 2.5 | 1778 | $2,080 | $1.17 | 12d | 1 | 1.30mi |
Listing history 36 events
-
2026-05-13price $130,000 365-char remark
-
2026-05-06$140,000 Active 365-char remark
-
2026-02-16soldstatus
-
2026-01-31historical
-
2026-01-02status Active
-
2025-12-31historical
-
2025-12-22price $115,000
-
2025-12-15price $120,000
-
2025-12-10price $125,000
-
2025-12-01price $130,000
-
2025-11-10$135,000 Active
-
2018-02-05soldstatus
-
2018-02-01soldstatus Sold
Show marketing remark (217 chars)
Great opportunity on this fixer upper. Large single story home 3 bedrooms 2 bathrooms with a possibility of a 3 rd bathroom. Oversized indoor Utility room. 20 minutes to Galveston and 30 minutes from Downtown Houston.
-
2018-01-29status Pending
Show marketing remark (217 chars)
Great opportunity on this fixer upper. Large single story home 3 bedrooms 2 bathrooms with a possibility of a 3 rd bathroom. Oversized indoor Utility room. 20 minutes to Galveston and 30 minutes from Downtown Houston.
-
2018-01-18status Option Pending
Show marketing remark (217 chars)
Great opportunity on this fixer upper. Large single story home 3 bedrooms 2 bathrooms with a possibility of a 3 rd bathroom. Oversized indoor Utility room. 20 minutes to Galveston and 30 minutes from Downtown Houston.
-
2017-12-28price $84,000
Show marketing remark (217 chars)
Great opportunity on this fixer upper. Large single story home 3 bedrooms 2 bathrooms with a possibility of a 3 rd bathroom. Oversized indoor Utility room. 20 minutes to Galveston and 30 minutes from Downtown Houston.
-
2017-12-19$89,000 Active
Show marketing remark (217 chars)
Great opportunity on this fixer upper. Large single story home 3 bedrooms 2 bathrooms with a possibility of a 3 rd bathroom. Oversized indoor Utility room. 20 minutes to Galveston and 30 minutes from Downtown Houston.
-
2017-09-01historical
-
2017-08-16price $89,000
-
2017-08-14status Active
-
2017-08-04status Option Pending
-
2017-07-01price $92,000
-
2017-06-01price $96,000
-
2017-05-10status Active
-
2017-05-05status Option Pending
-
2017-04-26price $98,500
-
2017-03-31price $120,000
-
2017-03-31status Active
-
2017-03-20historical
-
2017-02-11price $102,000
-
2017-01-24$105,000 Active
-
2015-04-10soldstatus
-
2015-03-04soldstatus
-
2014-07-30soldstatus
-
2005-02-28soldstatus
-
1997-10-02soldstatus
ⓘ Source: listings_history table (triggers on properties + properties_extension) + one-shot
backfill from property_details.listing_events for pre-trigger history.
Tax reassessment forecast TX · Resets to sale price
- Current annual tax
- $5,725 · $477/mo
- Projected year-2 tax
- $5,725 · $477/mo
- Expected delta
- $0/yr ($0/mo · 0.0%)
ⓘ Screening estimate from a state-policy table — verify with the county assessor before closing.
Climate risk First Street
- Flood 7/10 Severe FEMA zone X (shaded) · 76% chance over 30 yrs
- Wildfire 4/10 Moderate
- Heat 10/10 Extreme 7 d/yr ≥109°F today · 26 d/yr by 30 yrs out
- Wind 9/10 Extreme 99% chance of damaging wind over 30 yrs
- Air quality 2/10 Low 1 unhealthy d/yr today · 1 by 30 yrs out
Nearby sold comps map
Loading sold comps map…
Walkable amenities ~0.75 mi
Loading nearby amenities…
Taxation est. · year 1
- Rental income
- $26,683
- − Mortgage interest
- −$7,282
- − Property taxes
- −$5,725
- − Insurance
- −$1,448
- − Repairs & maintenance
- −$2,135
- − Management
- −$2,135
- − Depreciation
- −$3,782
- Taxable income
- $4,178
- Est. tax owed @ 24.0%
- −$1,003
- After-tax cash flow
- $4,724/yr
For passive investors: Depreciation is non-cash, so a rental often shows a tax loss while cash-flowing — sheltering income. Rental losses are passive: they offset passive income freely, and up to $25,000/yr can offset ordinary (W-2) income if you actively participate and your MAGI is under $100k (phasing out to $0 by $150k); unused losses carry forward. On sale, claimed depreciation is recaptured at up to 25%, and gains may owe capital-gains tax (a 1031 exchange can defer both). Figures are a year-1 estimate at your 24.0% rate — not tax advice; consult a CPA.
Schools (NCES district)
- District
- Dickinson ISD
- NCES district ID
- 4817070
- Math proficiency
- 39% ▼ -11.00%
- Reading proficiency
- 40% ▼ -2.00%
- Median HH income
- $61,318
- Composite
- 35.16/100
- National rank
- #5005
- State rank
- #366 of 826 in TX
Livability — Bacliff
- Score
- 57/100
- State rank
- #1252
- US rank
- #21864
Category grades
Schools grade is shown separately in the Schools card above.
Census & demographics
- Census place
- Bacliff, TX
- County
- Galveston County · 357,330 people
- City population
- 9,541
- Metro
- Houston-The Woodlands-Sugar Land, TX
- Population (ZIP)
- 9,541
- Household income
- $51,458
- Rent vs Own
- Severe rent burden
- 672.0
Population outlook (Galveston County) Hauer SSP2
- Today (2025)
- 390,640 people
- By 2030
- 425,226 · +8.9%
- By 2040
- 493,765 · +26.4%
- By 2050
- 559,698 · +43.3%
- By 2075
- 719,260 · +84.1%
- By 2100
- 819,628 · +109.8%
Race, ethnicity, and origin ACS 2023
- Neighborhood character
- Diverse neighborhood (Simpson 0.60)
- Race & ethnicity
- Hispanic / Latino 46% White 43% Two or more races 21% Black 7% Asian 2% Native American 1%
- Hispanic origin (detail)
- Mexican 31%
- Common ancestry
- Slovak 3% Lithuanian 2% Romanian 1%
- Foreign-born
- 15% · Canada, Vietnam, China
- Languages at home
- 66% English-only · Spanish 32% Vietnamese 1%
Political lean MEDSL · Galveston
- 2024 margin
- Strong R (+27.4) · D 35.7% · R 63.1% · Other 1.2%
- 2008→2024 swing
- -7.9pp toward R · 2008: -19.5pp · 2024: -27.4pp
- All cycles
- 2024: R+27.4 2020: R+22.6 2016: R+22.6 2012: R+26.9 2008: R+19.5
Not yet ingested
- Civics
- —
Market trends
- HPI YoY
- ▼ -24.15%
- Current HPI
- 293.2677
- Rent YoY
- —
- Metro
- Houston-The Woodlands-Sugar Land, TX
- State GDP YoY
- ▲ 3.95%
- F500 in state
- 110
Industry mix (Fortune 500 HQ in TX)
| Industry | F500 HQs | Revenue |
|---|---|---|
| Energy | 16 | $1,198B |
|
||
| Technology | 5 | $198B |
|
||
| Engineering / Construction | 4 | $72B |
|
||
| Energy Services | 3 | $60B |
|
||
| Utilities | 3 | $41B |
|
||
| Healthcare | 2 | $330B |
|
||
Price history
+23.8% since first listed38 events — show timeline
- 2026-06-11 Sold (MLS) — HARMLS
- 2026-05-20 Pending — HARMLS
- 2026-05-13 Price Changed $130,000 HARMLS
- 2026-05-06 Listed $140,000 HARMLS
- 2026-02-16 Sold (Public Records) — Public Records
- 2026-01-31 Listing Removed — HARMLS
- 2026-01-02 Relisted — HARMLS
- 2025-12-31 Listing Removed — HARMLS
- 2025-12-22 Price Changed $115,000 HARMLS
- 2025-12-15 Price Changed $120,000 HARMLS
- 2025-12-10 Price Changed $125,000 HARMLS
- 2025-12-01 Price Changed $130,000 HARMLS
- 2025-11-10 Listed $135,000 HARMLS
- 2018-02-05 Sold (Public Records) — Public Records
- 2018-02-01 Sold (MLS) — HARMLS
- 2018-01-29 Pending — HARMLS
- 2018-01-18 Pending — HARMLS
- 2017-12-28 Price Changed $84,000 HARMLS
- 2017-12-19 Listed $89,000 HARMLS
- 2017-09-01 Listing Removed — HARMLS
- 2017-08-16 Price Changed $89,000 HARMLS
- 2017-08-14 Relisted — HARMLS
- 2017-08-04 Pending — HARMLS
- 2017-07-01 Price Changed $92,000 HARMLS
- 2017-06-01 Price Changed $96,000 HARMLS
- 2017-05-10 Relisted — HARMLS
- 2017-05-05 Pending — HARMLS
- 2017-04-26 Price Changed $98,500 HARMLS
- 2017-03-31 Price Changed $120,000 HARMLS
- 2017-03-31 Relisted — HARMLS
- 2017-03-20 Listing Removed — HARMLS
- 2017-02-11 Price Changed $102,000 HARMLS
- 2017-01-24 Listed $105,000 HARMLS
- 2015-04-10 Sold (Public Records) — Public Records
- 2015-03-04 Sold (Public Records) — Public Records
- 2014-07-30 Sold (Public Records) — Public Records
- 2005-02-28 Sold (Public Records) — Public Records
- 1997-10-02 Sold (Public Records) — Public Records
Property tax history
+5.2%/yrLatest (2025): $5,725 · +21.4% YoY. Source: county tax records.
Cash-flow waterfall
monthlySold comps — $/sqft
last 12 mo · ≤1 miLoading sold comps…