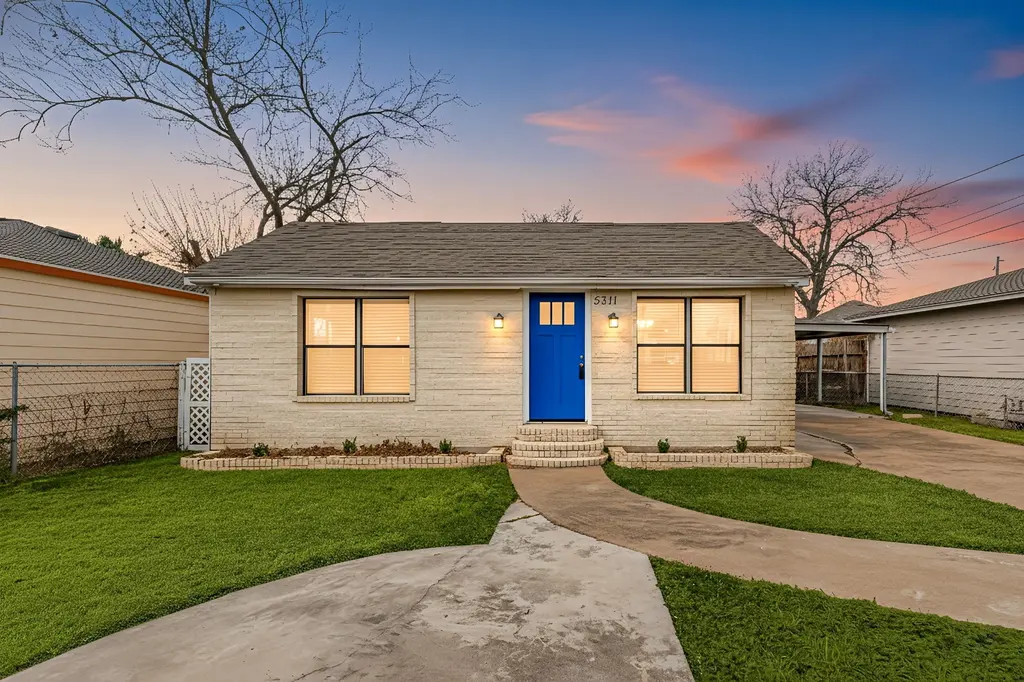
5311 Gano St · Houston, TX
Flood risk 1/10 · Minimal
- FEMA flood zone
- X (unshaded)
- Chance of flooding over 30 yrs
- 0.0%
- Est. flood insurance / yr
- $507 – $1,088
Fire risk 1/10 · Minimal
- Est. fire insurance / yr
- $1,222 – $2,270
Heat risk 9/10 · Severe
- Hot days now (above 109°F)
- 7 days/yr
- Hot days in 30 yrs
- 24 days/yr
Wind risk 9/10 · Severe
- Chance of severe wind over 30 yrs
- 99.0%
Air-quality risk 3/10 · Minor
- Unhealthy air days now
- 2 days/yr
- Unhealthy air days in 30 yrs
- 3 days/yr
Risk factors via First Street. Map © Google.
Why this score? — see what drove the D- grade
The composite is a weighted blend of 9 inputs, each scored 0–100. Each bar is that input's sub-score; the figure is the points it added to the 100-point composite (weight × sub-score).
- ARV discount +15.0/15.0
- Cash flow +7.0/30.0
- Livability +3.7/5.0
- Rent growth +2.7/5.0
- Schools +2.7/10.0
- Condition / age +2.5/5.0
- 1% rule +2.1/10.0
- DSCR +1.2/10.0
- Appreciation +0.0/10.0
$249,900
🖨 Deal sheet 📄 Offer letter ✓ Due diligence
Listing remarks MLS
Step into a bright and updated Northside Village gem that balances everyday comfort with backyard bliss. Fresh floors and paint set the stage for inviting living spaces filled with wonderful natural light, while skylights in the kitchen area and primary shower amplify the open, airy feel. Discover your private pool oasis — recently refinished and ready for endless cool afternoons and gatherings. Thoughtful outdoor storage space under the carport keeps gear organized and accessible. Two full baths plus an extra vanity with sink and storage add convenience and versatility. Located just moments from the rail line for easy downtown access, enjoy quick commutes and the vibrant local restaurant scene. Friendly neighbors and community charm round out this rare find, making it a place you’ll love to call home
Key facts
- Easy downtown access
- Skylights in kitchen
- Private pool oasis
Tags
Neighborhood map
What this means for you Summary
Snapshot
- This is a 3-bed/1.0-bath single-family listed at $250k.
Deal economics
- At list price, monthly cash flow is $-366 ($-4k/yr) — negative.
- To cash-flow at today's rent, offer at most $185k (25.9% below list).
- To meet the 1% rule (rent ≥ 1% of price), the offer needs to be $178k (29.0% below list).
- Recommended offer: $178k (29.0% below list) — sets the bar for 1% rule.
- Cap rate 4.5% vs local median 3.2% in Houston — top-decile yield for the area; either an underpriced asset or a hidden risk that comps aren't pricing in. Stress-test before assuming the spread holds.
Location & tenants
- Location reads 74/100 on livability (#184 in TX, #4,771 nationally) — a middle-class / working-renter tenant base. Strengths: amenities A+, cost of living A+, housing A+; Watch: schools D, crime F.
- Houston ISD (urban): math 27% / reading 35% proficiency, ranked #593 of 826 in TX (top 72%) — families likely to look elsewhere, expect single-tenant / working-renter base with shorter leases; 71% free/reduced lunch — lower-income household profile, screen leases tightly.
- Market conditions: Rents flat; 595 active listings in the ZIP; 16 comparable units currently listed for rent nearby; rentals at typical pace (median 17d on market — plan ~3-4 weeks tenant-placement turnaround); solid renter incomes; 29,883 units permitted in Harris County in 2024 (8,621 in 5+ unit buildings).
Forward outlook
- Local home prices are declining (-3.0%/yr); year-one equity from $2k of loan paydown is wiped out by about $7k of value loss. Plan a longer hold.
- Harris County population projected at +47% by 2050 — long-run rental-demand tailwind backs the buy-and-hold thesis.
Negotiation context
- It's been on market 135 days — a 12% lower offer ($220k) is reasonable based on typical stale-listing flexibility.
- 6 sale attempts since 2y ago with the ask held roughly flat each time — persistent listings suggest the price (not the market) is what's stuck; bring a comps-based counter.
Risks & watch-outs
- Watch-outs: built in 1945 — expect roof / HVAC / electrical / plumbing capex.
- Climate carrying-cost: severe wind risk, 99% chance of damaging wind over 30y; extreme-heat days projected 7→24/yr by 2055 (HVAC capex compounding) — expect insurance premiums to compound above CPI over the hold.
Questions for the listing agent
- What do current leases actually rent for vs. the listed asking? Can we see a recent rent roll and the last 12 months of T-12 income?
- It's been on market 135 days. Have you received any prior offers? Is the seller open to a 29% concession, seller financing, or rate buy-down credit?
- Built in 1945 — when were the roof, HVAC, electrical panel, plumbing, and water heater last replaced?
- Why hasn't it sold? Are there any deal-killer items the seller is aware of (foundation, flood, title, zoning, code violations)?
- Is there a deadline driving the sale (1031 exchange, divorce, estate, relocation)? That informs how much negotiation room exists.
- Schools are D-rated, which usually means shorter tenancies and higher turnover. Who's the typical renter profile here, and what's been the actual vacancy rate?
- Crime grade is F in this area — have there been break-ins, vandalism, or insurance claims at this property in the last 3 years? What carrier currently insures it and at what premium?
- The area grade is low — what's the realistic commute time and amenity access for the typical tenant pool here? Any planned neighborhood developments (good or bad) we should know about?
- What's the average days-on-market for RENTAL listings here right now (not sales)? A rising rental-DOM trend means longer vacancies and softer asking-rent achievability than the comps imply.
- What's the recent tenant-quality profile in this submarket — average credit score on applications, eviction rate, late-payment / NSF rate, and stable-employment percentage? A property-management company in the area should have these aggregated.
- How much new for-sale + rental construction is in the pipeline within 1–3 miles? Heavy new supply typically softens prices + rents 12–24 months out; constrained supply supports both.
Investment metrics
- 1% rule
- 0.71% ✗
- Cap rate
- 4.53%
- Cash-on-cash
- -6.28%
- DSCR
- 0.72
- GRM
- 11.7
CMA / ARV
- ARV (median comp)
- $321,475
- List price
- $249,900
- Delta
- -22.26%
- Verdict
- UNDERPRICED
- Comps
- 20 within 1.0 mi
Show comp detail 12 sales within ~0.75 mi
| Address | Dist | Beds/Ba | Sqft | Sold | Price | $/sf | Match |
|---|---|---|---|---|---|---|---|
| 1506 Amundsen St | 0.53mi | 3/2.0 | 1,112 (-1%) | 5mo | $295,000 | $265 | 66 |
| 1410 Caplin St | 0.52mi | 3/1.0 | 1,209 (+8%) | 0mo | $154,000 | $127 | 62 |
| 5619 Chapman St | 0.21mi | 3/1.0 | 1,020 (-9%) | 17mo | $167,000 | $164 | 62 |
| 408 Canadian St | 0.67mi | 2/1.0 (-1) | 1,128 (+1%) | 7mo | $220,000 | $195 | 57 |
| 4725 Beggs St | 0.70mi | 3/2.0 | 1,111 (-1%) | 7mo | $239,995 | $216 | 56 |
| 5610 Chapman St | 0.22mi | 2/2.0 (-1) | 1,013 (-10%) | 14mo | $350,000 | $346 | 54 |
| 5710 Cherry St | 0.68mi | 2/1.0 (-1) | 1,039 (-7%) | 1mo | $159,000 | $153 | 50 |
| 1509 Moody St | 0.31mi | 3/1.0 | 1,280 (+14%) | 16mo | $129,000 | $101 | 48 |
| 513 Reid St | 0.71mi | 3/1.0 | 1,218 (+9%) | 6mo | $345,000 | $283 | 48 |
| 4502 Hain St | 0.73mi | 2/1.0 (-1) | 1,016 (-9%) | 1mo | $273,500 | $269 | 45 |
| 516 Kelley St | 0.61mi | 2/1.0 (-1) | 1,221 (+9%) | 8mo | $426,900 | $350 | 45 |
| 501 Joyce St | 0.57mi | 2/1.5 (-1) | 1,210 (+8%) | 15mo | $390,000 | $322 | 40 |
Match score weights: distance 35% · size 25% · config 20% · recency 20%. Top-matched comps best support the ARV.
Projected returns pro-forma
-3.0% appreciation · 0.84% rent growth · sell at horizon
- IRR
- -29.6%
- Equity multiple
- 0.03×
- Total profit
- $-67,557
- Equity at exit
- $37,261
- IRR
- -42.9%
- Equity multiple
- -0.48×
- Total profit
- $-103,507
- Equity at exit
- $21,607
Cash invested: $69,972 (down + closing). Projections, not guarantees.
Landlord ↔ Tenant lean methodology
- Overall (STATE)
- 87 Strongly Landlord-Friendly
- State Texas
- 87 Strongly Landlord-Friendly · R+5
- County
- — inherits STATE
- City
- — inherits STATE
ZIP-level market 77009
- Rents YoY
- 0.8%
- Active inventory
- 595
- Price-to-rent
- 11.7×
Monthly cashflow live
- Estimated rent
- $1,775 high interval (Pro) →
- Mortgage (P&I)
- −$1,311
- Tax from tax record
- −$354 /mo · $4,253/yr
- Insurance
- −$104
- HOA
- −$0
- Vacancy / Maint / Mgmt
- −$373
- Net cashflow
- $-366
Break-even live
UW: 25.0% down · 7.5% · 30yr · 1.5% tax · 5.0% vac · 8.0% maint · 8.0% mgmt
Financing live
Cash to close
- Down payment
- $62,475
- Closing costs
- $7,497
- Reserves months
- —
- Total cash needed
- —
Loan-product check · same deal, 3 products live
Conventional
25% down · 7.5% · 30yr
- Down + closing
- —
- Monthly P&I
- —
- Monthly cashflow
- —
- DSCR
- —
- Eligible?
- —
Personal DTI + credit; lowest rate.
DSCR
20% down · 8.5% · 30yr
- Down + closing
- —
- Monthly P&I
- —
- Monthly cashflow
- —
- DSCR
- —
- Eligible?
- —
No personal income docs; deal must DSCR.
Hard money
10% down · 12.0% · 12mo
- Down + closing
- —
- Monthly P&I
- —
- Monthly cashflow
- —
- DSCR
- —
- Eligible?
- —
Short-term bridge; refi at stabilization.
Rent comps 16 comps
| Address | Beds | Baths | Sqft | Rent | $/sqft | DOM | Units | Dist |
|---|---|---|---|---|---|---|---|---|
| 2516 Ivy St Houston, TX | 3.0 | 1.0 | 1200 | $1,500 | $1.25 | 43d | 1 | 0.60mi |
| 2110 Melbourne St Unit 3 Houston, TX | 2.0 | 1.0 | 825 | $1,350 | $1.64 | 24d | 1 | 0.77mi |
| 6869 Arto St Houston, TX | 1.0–2.0 | 1.0 | 900 | $950 | $1.06 | 16d | 6 | 0.94mi |
| 914 Bunton St Houston, TX | 3.0 | 2.0 | 1389 | $1,950 | $1.40 | 43d | 1 | 0.99mi |
| 6918 Irvington Blvd Houston, TX | 2.0 | 2.0 | 1100 | $1,550 | $1.41 | 43d | 1 | 1.04mi |
| 207 Lindale St Unit 1316403P Houston, TX | 2.0 | 1.0 | 1119 | $3,182 | $2.84 | 1d | 1 | 1.10mi |
| 3107 Melbourne St Houston, TX | 3.0 | 1.0 | 956 | $1,500 | $1.57 | 43d | 1 | 1.16mi |
| 1209 Cordell St Houston, TX | 2.0 | 2.0 | 990 | $2,000 | $2.02 | 2d | 1 | 1.20mi |
| 1007 Archer St Houston, TX | 2.0 | 1.0 | 1008 | $1,923 | $1.91 | 1d | 1 | 1.20mi |
| 1617 Enid St Houston, TX | 1.0–2.0 | 1.0–2.0 | 974 | $2,417 | $2.48 | 1d | 56 | 1.21mi |
| 1690 North Loop Houston, TX | 1.0–2.0 | 1.0–2.0 | 876 | $2,269 | $2.59 | 1d | 43 | 1.35mi |
| 611 W Cavalcade St Houston, TX | 1.0–2.0 | 1.0 | 775 | $1,339 | $1.73 | 1d | 12 | 1.40mi |
| 7301 Jensen Dr Apt 12 Houston, TX | 2.0 | 1.0 | 880 | $930 | $1.06 | 7d | 1 | 1.41mi |
| 7301 Jensen Dr Unit 50 Houston, TX | 2.0 | 1.0 | 880 | $999 | $1.14 | 7d | 1 | 1.41mi |
| 4711 Sayers St Unit A Houston, TX | 2.0 | 1.0 | 1200 | $1,650 | $1.38 | 43d | 1 | 1.49mi |
| 58 Bennington St Houston, TX | 2.0 | 1.0 | 950 | $950 | $1.00 | 24d | 1 | 1.49mi |
Listing history 35 events
-
2026-06-18days on market $249,900 Active 135 DOM
-
2026-06-17days on market $249,900 Active 134 DOM
-
2026-06-16days on market $249,900 Active 133 DOM
-
2026-06-15days on market $249,900 Active 132 DOM
-
2026-06-13statusdays on market $249,900 Active 130 DOM
-
2026-06-09days on market $249,900 Pending 126 DOM
-
2026-06-08statusdays on market $249,900 Pending 125 DOM
-
2026-06-07days on market $249,900 Active 124 DOM
-
2026-06-04days on market $249,900 Active 121 DOM
-
2026-06-03days on market $249,900 Active 120 DOM
-
2026-06-02days on market $249,900 Active 119 DOM
-
2026-06-01days on market $249,900 Active 118 DOM
-
2026-05-31days on market $249,900 Active 117 DOM
-
2026-02-03$249,900 Active 824-char remark
Show marketing remark (824 chars)
Step into a bright and updated Northside Village gem that balances everyday comfort with backyard bliss. Fresh floors and paint set the stage for inviting living spaces filled with wonderful natural light, while skylights in the kitchen area and primary shower amplify the open, airy feel. Discover your private pool oasis — recently refinished and ready for endless cool afternoons and gatherings. Thoughtful outdoor storage space under the carport keeps gear organized and accessible. Two full baths plus an extra vanity with sink and storage add convenience and versatility. Located just moments from the rail line for easy downtown access, enjoy quick commutes and the vibrant local restaurant scene. Friendly neighbors and community charm round out this rare find, making it a place you’ll love to call home
-
2026-01-05historical
-
2025-11-13price $284,000
-
2025-09-26historical $1,795
-
2025-08-28price $1,795
-
2025-08-26price $295,000
-
2025-08-11price $299,999
-
2025-07-29price $309,000
-
2025-07-21price $319,000
-
2025-06-26price $1,895
-
2025-06-24price $324,000
-
2025-06-15price $1,995
-
2025-06-06$325,000 Active
-
2025-05-16$2,050
-
2025-05-16historical $2,050
-
2025-04-16$2,050
-
2024-07-09historical $1,975
-
2024-07-09historical
-
2024-06-13price $1,975
-
2024-05-23$2,050
-
2024-04-05$325,000 Active
-
2001-06-01soldstatus
ⓘ Source: listings_history table (triggers on properties + properties_extension) + one-shot
backfill from property_details.listing_events for pre-trigger history.
Tax reassessment forecast TX · Resets to sale price
- Current annual tax
- $4,253 · $354/mo
- Projected year-2 tax
- $4,573 · $381/mo
- Expected delta
- +$320/yr (+$27/mo · 7.5%)
ⓘ Screening estimate from a state-policy table — verify with the county assessor before closing.
Climate risk First Street
- Flood 1/10 Low FEMA zone X (unshaded) · 0% chance over 30 yrs
- Wildfire 1/10 Low
- Heat 9/10 Extreme 7 d/yr ≥109°F today · 24 d/yr by 30 yrs out
- Wind 9/10 Extreme 99% chance of damaging wind over 30 yrs
- Air quality 3/10 Moderate 2 unhealthy d/yr today · 3 by 30 yrs out
Nearby sold comps map
Loading sold comps map…
Walkable amenities ~0.75 mi
Loading nearby amenities…
Taxation est. · year 1
- Rental income
- $21,306
- − Mortgage interest
- −$13,998
- − Property taxes
- −$4,253
- − Insurance
- −$1,250
- − Repairs & maintenance
- −$1,704
- − Management
- −$1,704
- − Depreciation
- −$7,270
- Taxable loss
- −$8,874
- Est. tax savings @ 24.0%
- +$2,130
- After-tax cash flow
- $-2,267/yr
For passive investors: Depreciation is non-cash, so a rental often shows a tax loss while cash-flowing — sheltering income. Rental losses are passive: they offset passive income freely, and up to $25,000/yr can offset ordinary (W-2) income if you actively participate and your MAGI is under $100k (phasing out to $0 by $150k); unused losses carry forward. On sale, claimed depreciation is recaptured at up to 25%, and gains may owe capital-gains tax (a 1031 exchange can defer both). Figures are a year-1 estimate at your 24.0% rate — not tax advice; consult a CPA.
Schools (NCES district)
- District
- Houston ISD
- NCES district ID
- 4823640
- Math proficiency
- 27% ▼ -18.00%
- Reading proficiency
- 35% ▼ -6.00%
- Median HH income
- $46,054
- Composite
- 26.63/100
- National rank
- #7173
- State rank
- #593 of 826 in TX
Livability — Houston
- Score
- 74/100
- State rank
- #184
- US rank
- #4771
Category grades
Schools grade is shown separately in the Schools card above.
Census & demographics
- Census place
- Houston, TX
- County
- Harris County · 4,702,590 people
- City population
- 3,226,434
- Metro
- Houston-The Woodlands-Sugar Land, TX
- Population (ZIP)
- 35,769
- Household income
- $83,148
- Rent vs Own
- Severe rent burden
- 994.0
Population outlook (Harris County) Hauer SSP2
- Today (2025)
- 5,571,493 people
- By 2030
- 6,089,821 · +9.3%
- By 2040
- 7,142,806 · +28.2%
- By 2050
- 8,185,864 · +46.9%
- By 2075
- 10,574,329 · +89.8%
- By 2100
- 12,109,958 · +117.4%
Race, ethnicity, and origin ACS 2023
- Neighborhood character
- Diverse neighborhood (Simpson 0.60)
- Race & ethnicity
- Hispanic / Latino 53% White 33% Two or more races 22% Black 8% Asian 3%
- Hispanic origin (detail)
- Mexican 46%
- Common ancestry
- Italian 2% Lithuanian 2% Slovak 1%
- Foreign-born
- 20% · Canada
- Languages at home
- 55% English-only · Spanish 40% Other Indo-European 2% Other Asian/Pacific 1%
Political lean MEDSL · Harris
- 2024 margin
- Lean D (+5.5) · D 52.0% · R 46.4% · Other 1.6%
- 2008→2024 swing
- +3.9pp toward D · 2008: 1.6pp · 2024: 5.5pp
- All cycles
- 2024: D+5.5 2020: D+13.3 2016: D+12.4 2012: D+0.1 2008: D+1.6
Not yet ingested
- Civics
- —
Market trends
- HPI YoY
- ▼ -533.57%
- Current HPI
- 219.5037
- Rent YoY
- ▲ 0.84%
- Metro
- Houston-The Woodlands-Sugar Land, TX
- State GDP YoY
- ▲ 3.95%
- F500 in state
- 110
Industry mix (Fortune 500 HQ in TX)
| Industry | F500 HQs | Revenue |
|---|---|---|
| Energy | 16 | $1,198B |
|
||
| Technology | 5 | $198B |
|
||
| Engineering / Construction | 4 | $72B |
|
||
| Energy Services | 3 | $60B |
|
||
| Utilities | 3 | $41B |
|
||
| Healthcare | 2 | $330B |
|
||
Price history
-23.1% since first listed22 events — show timeline
- 2026-02-03 Listed $249,900 HARMLS
- 2026-01-05 Listing Removed — HARMLS
- 2025-11-13 Price Changed $284,000 HARMLS
- 2025-09-26 Rental Removed $1,795 RENTLY
- 2025-08-28 Price Changed $1,795 RENTLY
- 2025-08-26 Price Changed $295,000 HARMLS
- 2025-08-11 Price Changed $299,999 HARMLS
- 2025-07-29 Price Changed $309,000 HARMLS
- 2025-07-21 Price Changed $319,000 HARMLS
- 2025-06-26 Price Changed $1,895 RENTLY
- 2025-06-24 Price Changed $324,000 HARMLS
- 2025-06-15 Price Changed $1,995 RENTLY
- 2025-06-06 Listed $325,000 HARMLS
- 2025-05-16 Listed for Rent $2,050 RENTLY
- 2025-05-16 Rental Removed $2,050 ZUMPER1
- 2025-04-16 Listed for Rent $2,050 ZUMPER1
- 2024-07-09 Rental Removed $1,975 HARMLS
- 2024-07-09 Listing Removed — HARMLS
- 2024-06-13 Price Changed $1,975 HARMLS
- 2024-05-23 Listed for Rent $2,050 HARMLS
- 2024-04-05 Listed $325,000 HARMLS
- 2001-06-01 Sold (Public Records) — Public Records
Property tax history
+9.7%/yrLatest (2025): $4,253 · +3.2% YoY. Source: county tax records.
Cash-flow waterfall
monthlySold comps — $/sqft
last 12 mo · ≤1 miLoading sold comps…