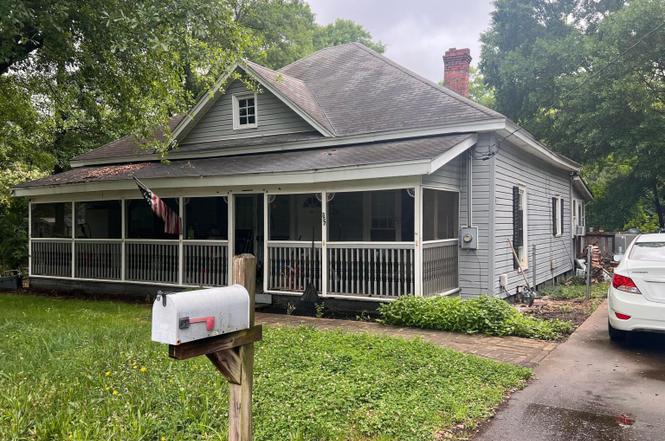
357 Glendale Dr · Hartwell, GA
Flood risk 1/10 · Minimal
- FEMA flood zone
- X (unshaded)
- Chance of flooding over 30 yrs
- 0.0%
- Est. flood insurance / yr
- $507 – $1,088
Fire risk 4/10 · Minor
- Est. fire insurance / yr
- $963 – $1,789
Heat risk 6/10 · Moderate
- Hot days now (above 105°F)
- 7 days/yr
- Hot days in 30 yrs
- 17 days/yr
Wind risk 4/10 · Minor
- Chance of severe wind over 30 yrs
- 11.0%
Air-quality risk 3/10 · Minor
- Unhealthy air days now
- 3 days/yr
- Unhealthy air days in 30 yrs
- 3 days/yr
Risk factors via First Street. Map © Google.
Why this score? — see what drove the B- grade
The composite is a weighted blend of 9 inputs, each scored 0–100. Each bar is that input's sub-score; the figure is the points it added to the 100-point composite (weight × sub-score).
- Cash flow +30.0/30.0
- DSCR +10.0/10.0
- 1% rule +9.7/10.0
- ARV discount +7.5/15.0
- Livability +3.1/5.0
- Schools +2.7/10.0
- Rent growth +2.5/5.0
- Condition / age +2.5/5.0
- Appreciation +0.0/10.0
$130,000
🖨 Deal sheet 📄 Offer letter ✓ Due diligence
Listing remarks
Investment opportunity in the city limits of Hartwell, GA! Situated on a beautiful, level lot and located just minutes from Lake Hartwell, this property offers endless potential. Conveniently located near shopping, dining, and recreation. Property is being sold "as is. "
Key facts
- Near dining
- Near shopping
- Level lot
Tags
Property features AI
Finance
- Other: Property listed as fixer
- Financial info: Listing accepts Cash and Conventional financing
- HOA & community: No HOA
Exterior
- Parking: Off-street parking; Parking pad; Open parking
- Utilities: Public water available; Public sewer (sewer connected); Electricity available; High-speed internet available
- Home design: Single-family house; One story; Residential property; Built in 1926
- Construction: Vinyl siding; Composition roof; Block foundation
- Exterior features: Deck; Porch; Screened porch; City lot; Level lot
Interior
- Bedrooms: Three bedrooms on the main level
- Flooring: Carpet; Laminate; Other
- Bathrooms: One full bathroom (main level)
- Heating & cooling: Central heating; Central air conditioning
- Interior features: Sun room; Living room fireplace; Laundry closet; One-level living; Other interior features
- Laundry & utility: Laundry located in a closet
Neighborhood map
What this means for you Summary
Snapshot
- This is a 3-bed/1.0-bath single-family listed at $130k.
Deal economics
- At list price, monthly cash flow is $722 ($9k/yr) — positive.
- The deal already cash-flows at list — no discount required.
- Meets the 1% rule at list price ($2k rent vs $130k).
- Recommended offer: $128k (1.5% below list) — sets the bar for market timing.
- Cap rate 13.0% vs local median 3.3% in Hartwell — top-decile yield for the area; either an underpriced asset or a hidden risk that comps aren't pricing in. Stress-test before assuming the spread holds.
Location & tenants
- Location reads 61/100 on livability (#342 in GA) — a middle-class / working-renter tenant base. Strengths: cost of living A+; Watch: housing C-, health & safety C-, crime D.
- Hart County (town): math 32% / reading 33% proficiency, ranked #82 of 174 in GA (top 47%) — families likely to look elsewhere, expect single-tenant / working-renter base with shorter leases.
- Zoned schools: Hartwell Elementary School (math 26% / reading 29%, grade F, #682 of 1,228 statewide, top 56%, 559 students, 70% FRL) — zoned schools average 70% FRL vs 53% district-wide (17 pts higher); higher-poverty schools than district average — tighter screening recommended.
- Market conditions: 281 active listings in the ZIP; 5 comparable units currently listed for rent nearby; rentals leasing fast (median 13d on market — plan ~1-2 weeks tenant-placement turnaround); 40% of comp listings sitting > 30 days — soft ceiling on asking rent; 170 units permitted in Hart County in 2024 (8 in 5+ unit buildings).
Forward outlook
- Local home prices are declining (-3.0%/yr); year-one equity from $899 of loan paydown is wiped out by about $4k of value loss. Plan a longer hold.
- Hart County population projected to shrink 4% by 2050 — rents likely to lag national; underwrite the cash flow, not the appreciation.
- At projected returns (-3.0% appreciation + 3.0% rent growth), your $36k cash investment doubles in ~6 years — after that, you're playing with house money.
Negotiation context
- It's been on market 15 days — a 2% lower offer ($128k) is reasonable based on typical stale-listing flexibility.
Risks & watch-outs
- Watch-outs: built in 1926 — expect roof / HVAC / electrical / plumbing capex.
- Climate carrying-cost: extreme-heat days projected 7→17/yr by 2055 (HVAC capex compounding) — expect insurance premiums to compound above CPI over the hold.
Questions for the listing agent
- Built in 1926 — when were the roof, HVAC, electrical panel, plumbing, and water heater last replaced?
- Is there a deadline driving the sale (1031 exchange, divorce, estate, relocation)? That informs how much negotiation room exists.
- Schools are D-rated, which usually means shorter tenancies and higher turnover. Who's the typical renter profile here, and what's been the actual vacancy rate?
- Crime grade is D in this area — have there been break-ins, vandalism, or insurance claims at this property in the last 3 years? What carrier currently insures it and at what premium?
- What's the average days-on-market for RENTAL listings here right now (not sales)? A rising rental-DOM trend means longer vacancies and softer asking-rent achievability than the comps imply.
- What's the recent tenant-quality profile in this submarket — average credit score on applications, eviction rate, late-payment / NSF rate, and stable-employment percentage? A property-management company in the area should have these aggregated.
- How much new for-sale + rental construction is in the pipeline within 1–3 miles? Heavy new supply typically softens prices + rents 12–24 months out; constrained supply supports both.
Investment metrics
- 1% rule
- 1.47% ✓
- Cap rate
- 12.96%
- Cash-on-cash
- 23.80%
- DSCR
- 2.06
- GRM
- 5.7
CMA / ARV
- ARV (on-the-fly)
- $277,536
- Comps found
- 12
Show comp detail 12 sales within ~0.75 mi
| Address | Dist | Beds/Ba | Sqft | Sold | Price | $/sf | Match |
|---|---|---|---|---|---|---|---|
| 70 Golden Oaks Dr | 0.57mi | 3/2.0 | 1,556 (-1%) | 1mo | $275,000 | $177 | 67 |
| 83 Crestwood Dr | 0.44mi | 3/2.0 | 1,500 (-4%) | 2mo | $284,900 | $190 | 66 |
| 638 Highland Avenue Ave | 0.62mi | 3/2.0 | 1,600 (+2%) | 2mo | $350,000 | $219 | 62 |
| 132 Golden Oaks Dr | 0.56mi | 3/2.0 | 1,531 (-2%) | 12mo | $309,990 | $202 | 56 |
| 34 Golden Oaks Dr | 0.58mi | 3/2.0 | 1,444 (-8%) | 4mo | $270,000 | $187 | 53 |
| 135 Highland Ave | 0.55mi | 3/2.0 | 1,649 (+5%) | 12mo | $290,000 | $176 | 52 |
| 121 Woodlake Lndg | 0.71mi | 3/2.0 | 1,530 (-2%) | 11mo | $264,000 | $173 | 50 |
| 575 W Howell St | 0.19mi | 2/1.0 (-1) | 1,365 (-13%) | 18mo | $115,000 | $84 | 49 |
| 303 Vickery St | 0.65mi | 2/2.0 (-1) | 1,596 (+2%) | 13mo | $280,000 | $175 | 47 |
| 47 Bowers Estates Dr | 0.48mi | 3/2.0 | 1,744 (+11%) | 16mo | $299,900 | $172 | 42 |
| 130 Vickery St | 0.73mi | 4/2.0 (+1) | 1,600 (+2%) | 23mo | $255,000 | $159 | 35 |
| 419 N Carolina St | 0.71mi | 2/2.0 (-1) | 1,724 (+10%) | 18mo | $425,000 | $247 | 26 |
Match score weights: distance 35% · size 25% · config 20% · recency 20%. Top-matched comps best support the ARV.
Projected returns pro-forma
-3.0% appreciation · 3.0% rent growth · sell at horizon
- IRR
- 16.9%
- Equity multiple
- 1.68×
- Total profit
- $24,878
- Equity at exit
- $19,383
- IRR
- 25.5%
- Equity multiple
- 3.22×
- Total profit
- $80,721
- Equity at exit
- $11,240
Cash invested: $36,400 (down + closing). Projections, not guarantees.
Landlord ↔ Tenant lean methodology
- Overall (STATE)
- 90 Strongly Landlord-Friendly
- State Georgia
- 90 Strongly Landlord-Friendly · R+3
- County
- — inherits STATE
- City
- — inherits STATE
ZIP-level market 30643
- Home prices YoY
- -16.7%
- Active inventory
- 281
- Price-to-rent
- 5.7×
Monthly cashflow live
- Estimated rent
- $1,915 high interval (Pro) →
- Mortgage (P&I)
- −$682
- Tax from tax record
- −$55 /mo · $664/yr
- Insurance
- −$54
- HOA
- −$0
- Vacancy / Maint / Mgmt
- −$402
- Net cashflow
- $722
Break-even live
UW: 25.0% down · 7.5% · 30yr · 1.5% tax · 5.0% vac · 8.0% maint · 8.0% mgmt
Financing live
Cash to close
- Down payment
- $32,500
- Closing costs
- $3,900
- Reserves months
- —
- Total cash needed
- —
Loan-product check · same deal, 3 products live
Conventional
25% down · 7.5% · 30yr
- Down + closing
- —
- Monthly P&I
- —
- Monthly cashflow
- —
- DSCR
- —
- Eligible?
- —
Personal DTI + credit; lowest rate.
DSCR
20% down · 8.5% · 30yr
- Down + closing
- —
- Monthly P&I
- —
- Monthly cashflow
- —
- DSCR
- —
- Eligible?
- —
No personal income docs; deal must DSCR.
Hard money
10% down · 12.0% · 12mo
- Down + closing
- —
- Monthly P&I
- —
- Monthly cashflow
- —
- DSCR
- —
- Eligible?
- —
Short-term bridge; refi at stabilization.
Rent comps 5 comps
| Address | Beds | Baths | Sqft | Rent | $/sqft | DOM | Units | Dist |
|---|---|---|---|---|---|---|---|---|
| 101 Fisher Dr Hartwell, GA | 4.0 | 2.0 | 1678 | $2,500 | $1.49 | 13d | 1 | 0.40mi |
| 186 Maret St Hartwell, GA | 3.0 | 2.0 | 1200 | $1,500 | $1.25 | 43d | 1 | 0.43mi |
| 234 Bowers Estates Rd Hartwell, GA | 3.0 | 3.0 | 1500 | $1,850 | $1.23 | 43d | 1 | 0.55mi |
| 250 N Forest Ave Hartwell, GA | 2.0 | 2.0 | 1092 | $1,450 | $1.33 | 11d | 1 | 0.81mi |
| 147 Race St Hartwell, GA | 2.0 | 2.0 | 1791 | $1,800 | $1.01 | 13d | 1 | 0.99mi |
Listing history 12 events
-
2026-06-19days on market $130,000 Active 15 DOM
-
2026-06-18statusdays on market $130,000 Active 14 DOM
-
2026-06-17days on market $130,000 New 13 DOM
-
2026-06-16days on market $130,000 New 12 DOM
-
2026-06-15days on market $130,000 New 11 DOM
-
2026-06-14days on market $130,000 New 9 DOM
-
2026-06-13days on market $130,000 New 8 DOM
-
2026-06-10days on market $130,000 New 6 DOM
-
2026-06-09days on market $130,000 New 5 DOM
-
2026-06-08days on market $130,000 New 4 DOM
-
2026-06-07remarks 271-char remark
-
2026-06-07$130,000 New 3 DOM
ⓘ Source: listings_history table (triggers on properties + properties_extension) + one-shot
backfill from property_details.listing_events for pre-trigger history.
Tax reassessment forecast GA · Resets to sale price
- Current annual tax
- $664 · $55/mo
- Projected year-2 tax
- $1,196 · $100/mo
- Expected delta
- +$532/yr (+$44/mo · 80.0%)
ⓘ Screening estimate from a state-policy table — verify with the county assessor before closing.
Climate risk First Street
- Flood 1/10 Low FEMA zone X (unshaded) · 0% chance over 30 yrs
- Wildfire 4/10 Moderate
- Heat 6/10 Major 7 d/yr ≥105°F today · 17 d/yr by 30 yrs out
- Wind 4/10 Moderate 11% chance of damaging wind over 30 yrs
- Air quality 3/10 Moderate 3 unhealthy d/yr today · 3 by 30 yrs out
Nearby sold comps map
Loading sold comps map…
Walkable amenities ~0.75 mi
Loading nearby amenities…
Taxation est. · year 1
- Rental income
- $22,986
- − Mortgage interest
- −$7,282
- − Property taxes
- −$664
- − Insurance
- −$650
- − Repairs & maintenance
- −$1,839
- − Management
- −$1,839
- − Depreciation
- −$3,782
- Taxable income
- $6,930
- Est. tax owed @ 24.0%
- −$1,663
- After-tax cash flow
- $7,000/yr
For passive investors: Depreciation is non-cash, so a rental often shows a tax loss while cash-flowing — sheltering income. Rental losses are passive: they offset passive income freely, and up to $25,000/yr can offset ordinary (W-2) income if you actively participate and your MAGI is under $100k (phasing out to $0 by $150k); unused losses carry forward. On sale, claimed depreciation is recaptured at up to 25%, and gains may owe capital-gains tax (a 1031 exchange can defer both). Figures are a year-1 estimate at your 24.0% rate — not tax advice; consult a CPA.
Schools (NCES district)
- District
- Hart County
- NCES district ID
- 1302730
- Math proficiency
- 32% ▼ -6.00%
- Reading proficiency
- 33% ▼ -6.00%
- Median HH income
- $37,494
- Composite
- 27.08/100
- National rank
- #7047
- State rank
- #82 of 174 in GA
Livability — Hartwell
- Score
- 61/100
- State rank
- #342
- US rank
- #17731
Category grades
Schools grade is shown separately in the Schools card above.
Census & demographics
- Census place
- Hartwell, GA
- Population (ZIP)
- 16,520
Population outlook (Hart County) Hauer SSP2
- Today (2025)
- 25,855 people
- By 2030
- 25,887 · +0.1%
- By 2040
- 25,627 · -0.9%
- By 2050
- 24,939 · -3.5%
- By 2075
- 23,150 · -10.5%
- By 2100
- 19,492 · -24.6%
Race, ethnicity, and origin ACS 2023
- Neighborhood character
- Predominantly White (71%)
- Race & ethnicity
- White 71% Black 22% Two or more races 6% Hispanic / Latino 1%
- Common ancestry
- Slovak 2% Lithuanian 2% Romanian 2%
- Foreign-born
- 1% · Canada
- Languages at home
- 98% English-only · Spanish 1%
Political lean MEDSL · Hart
- 2024 margin
- Solid R (+54.8) · D 22.4% · R 77.2%
- 2008→2024 swing
- -23.1pp toward R · 2008: -31.7pp · 2024: -54.8pp
- All cycles
- 2024: R+54.8 2020: R+49.6 2016: R+46.7 2012: R+38.4 2008: R+31.7
Not yet ingested
- Civics
- —
Market trends
- HPI YoY
- ▼ -59.98%
- Current HPI
- 299.7363
- Rent YoY
- —
- Metro
- —
- State GDP YoY
- ▲ 2.66%
- F500 in state
- 28
Industry mix (Fortune 500 HQ in GA)
| Industry | F500 HQs | Revenue |
|---|---|---|
| Paper / Packaging | 2 | $29B |
|
||
| Retail | 1 | $160B |
|
||
| Transportation / Logistics | 1 | $91B |
|
||
| Airlines | 1 | $62B |
|
||
| Consumer Goods | 1 | $47B |
|
||
| Utilities | 1 | $25B |
|
||
Price history
1 event — show timeline
- 2026-06-03 Listed $130,000 GAMLS
Property tax history
+1.9%/yrLatest (2025): $664 · +1.0% YoY. Source: county tax records.
Cash-flow waterfall
monthlySold comps — $/sqft
last 12 mo · ≤1 miLoading sold comps…