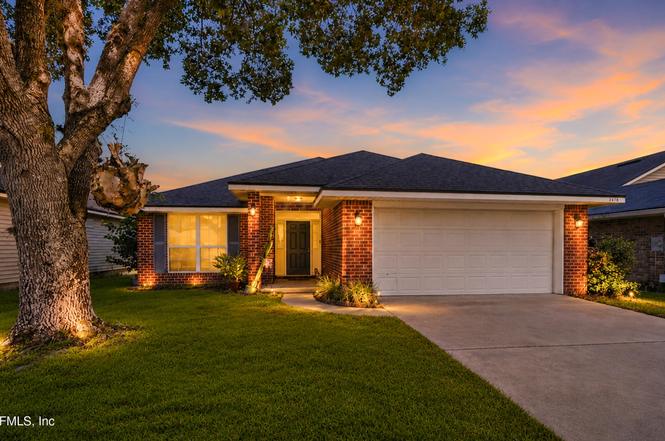
2478 Creekfront Dr · Asbury Lake, FL
Flood risk 1/10 · Minimal
- FEMA flood zone
- X (unshaded)
- Chance of flooding over 30 yrs
- 0.0%
- Est. flood insurance / yr
- $507 – $1,088
Fire risk 7/10 · Major
- Est. fire insurance / yr
- $947 – $1,759
Heat risk 8/10 · Major
- Hot days now (above 108°F)
- 7 days/yr
- Hot days in 30 yrs
- 20 days/yr
Wind risk 9/10 · Severe
- Chance of severe wind over 30 yrs
- 99.0%
Air-quality risk 3/10 · Minor
- Unhealthy air days now
- 3 days/yr
- Unhealthy air days in 30 yrs
- 3 days/yr
Risk factors via First Street. Map © Google.
Why this score? — see what drove the D grade
The composite is a weighted blend of 9 inputs, each scored 0–100. Each bar is that input's sub-score; the figure is the points it added to the 100-point composite (weight × sub-score).
- Cash flow +13.0/30.0
- ARV discount +11.5/15.0
- Schools +5.1/10.0
- DSCR +3.9/10.0
- Livability +3.1/5.0
- 1% rule +3.0/10.0
- Rent growth +2.6/5.0
- Condition / age +2.5/5.0
- Appreciation +0.0/10.0
$299,000
🖨 Deal sheet (PDF) 📄 Offer letter ✓ Due diligence
Listing remarks
Welcome to a beautifully maintained 4-bedroom home offering the perfect blend of comfort, functionality, and Florida living. From the moment you arrive, you'll appreciate the pride of ownership throughout this move-in-ready property. Inside, the spacious floor plan provides plenty of room for family and guests, while the bright and inviting Florida sunroom creates the perfect space to relax with your morning coffee, entertain friends, or enjoy the peaceful backyard views year round. Major updates include a roof that is only 6 years old and a water softener system already in place, providing added value and peace of mind for the next owner. The well-maintained interior offers comfortable liv
Key facts
- Florida sunroom
- 6,098 sq ft lot
- 2 garage spots
Tags
Property features AI
Finance
- HOA & community: Homeowners association with quarterly fee; Association fee: $170 quarterly; Community playground
Exterior
- Parking: Garage; 2-car garage
- Utilities: Public sewer; Electricity connected; Sewer connected; Water connected
- Home design: Single-family residence; One story
- Construction: Brick construction
- Exterior features: Glass-enclosed patio; Rear porch; Full wood fencing; Shingle roof; Asphalt/paved road access; Community swimming pool (not private)
Interior
- Kitchen: Dishwasher; Disposal; Electric range; Microwave; Refrigerator; Water softener (owned)
- Bedrooms: 4 bedrooms
- Flooring: Tile flooring
- Bathrooms: 2 full bathrooms
- Heating & cooling: Electric heating; Central air conditioning (electric)
- Interior features: Breakfast bar and breakfast nook; Ceiling fans; Entrance foyer; Pantry; Primary bathroom with tub and separate shower; Walk-in closet(s); Wood-burning fireplace
- Laundry & utility: In-unit laundry with washer hookup and electric dryer hookup; Electric water heater
Neighborhood map
What this means for you Summary
Snapshot
- This is a 4-bed/2.0-bath single-family listed at $299k.
Deal economics
- At list price, monthly cash flow is $-15 ($-183/yr) — negative.
- To cash-flow at today's rent, offer at most $296k (0.9% below list).
- To meet the 1% rule (rent ≥ 1% of price), the offer needs to be $238k (20.5% below list).
- Recommended offer: $238k (20.5% below list) — sets the bar for 1% rule.
- Cap rate 6.2% vs local median 4.3% in Asbury Lake — top-decile yield for the area; either an underpriced asset or a hidden risk that comps aren't pricing in. Stress-test before assuming the spread holds.
Location & tenants
- Location reads 61/100 on livability (#776 in FL) — a middle-class / working-renter tenant base. Strengths: housing A+, employment A, crime A-; Watch: amenities F, commute F, health & safety F.
- Clay (suburban): math 58% / reading 59% proficiency, ranked #14 of 73 in FL (top 19%) — acceptable for families but not a draw, mixed tenant base, ~2y average lease.
- Zoned schools: Lake Asbury Elementary School (math 69% / reading 64%, grade B+, #473 of 2,144 statewide, top 23%, 975 students, 38% FRL); Lake Asbury Junior High School (math 65% / reading 58%, grade B+, #124 of 571 statewide, top 22%, 1,037 students, 41% FRL); Clay High School (math 37% / reading 53%, grade D-, #228 of 667 statewide, top 35%, 1,666 students, 43% FRL).
- Market conditions: Rents flat; 891 active listings in the ZIP; 11 comparable units currently listed for rent nearby; rentals leasing fast (median 10d on market — plan ~1-2 weeks tenant-placement turnaround); solid renter incomes; 1,876 units permitted in Clay County in 2024 (14 in 5+ unit buildings).
- This rent runs 34% of the median local income ($84k/yr) — at the standard rent-burdened threshold; future hikes will face affordability resistance.
Forward outlook
- Local home prices are declining (-3.0%/yr); year-one equity from $2k of loan paydown is wiped out by about $9k of value loss. Plan a longer hold.
- Clay County population projected at +19% by 2050 — long-run rental-demand tailwind backs the buy-and-hold thesis.
Negotiation context
- Only 11 days on market — expect competitive offers; lowballing is unlikely to land.
- 2 sale attempts since 21y ago with the ask held roughly flat each time — persistent listings suggest the price (not the market) is what's stuck; bring a comps-based counter.
- Current owner paid $201k; 49% above their basis — modest negotiation headroom, anchor on the comps not their cost.
Risks & watch-outs
- Climate carrying-cost: severe wind risk, 99% chance of damaging wind over 30y; major wildfire risk; extreme-heat days projected 7→20/yr by 2055 (HVAC capex compounding) — expect insurance premiums to compound above CPI over the hold.
Questions for the listing agent
- What do current leases actually rent for vs. the listed asking? Can we see a recent rent roll and the last 12 months of T-12 income?
- What does the HOA fee cover, when was the last increase, and are there any pending special assessments or reserve-fund shortfalls?
- Is there a deadline driving the sale (1031 exchange, divorce, estate, relocation)? That informs how much negotiation room exists.
- Schools are F-rated, which usually means shorter tenancies and higher turnover. Who's the typical renter profile here, and what's been the actual vacancy rate?
- The area grade is low — what's the realistic commute time and amenity access for the typical tenant pool here? Any planned neighborhood developments (good or bad) we should know about?
- What's the average days-on-market for RENTAL listings here right now (not sales)? A rising rental-DOM trend means longer vacancies and softer asking-rent achievability than the comps imply.
- What's the recent tenant-quality profile in this submarket — average credit score on applications, eviction rate, late-payment / NSF rate, and stable-employment percentage? A property-management company in the area should have these aggregated.
- How much new for-sale + rental construction is in the pipeline within 1–3 miles? Heavy new supply typically softens prices + rents 12–24 months out; constrained supply supports both.
Investment metrics
- 1% rule
- 0.80% ✗
- Cap rate
- 6.23%
- Cash-on-cash
- -0.22%
- DSCR
- 0.99
- GRM
- 10.5
CMA / ARV
- ARV (on-the-fly)
- $328,354
- Comps found
- 12
Show comp detail 12 sales within ~0.75 mi
| Address | Dist | Beds/Ba | Sqft | Sold | Price | $/sf | Match |
|---|---|---|---|---|---|---|---|
| 2671 Fernleaf Dr | 0.07mi | 3/2.0 (-1) | 1,917 (+1%) | 2mo | $285,000 | $149 | 89 |
| 3331 Spring Valley Ct | 0.45mi | 3/2.0 (-1) | 1,839 (-3%) | 0mo | $310,000 | $169 | 69 |
| 3138 Hidden Meadows Ct | 0.59mi | 4/2.0 | 1,852 (-2%) | 0mo | $310,000 | $167 | 68 |
| 3309 Mission Oak Pl | 0.58mi | 4/2.0 | 1,844 (-3%) | 1mo | $346,900 | $188 | 67 |
| 3301 Mission Oak Pl | 0.60mi | 4/2.0 | 1,847 (-3%) | 1mo | $366,900 | $199 | 67 |
| 3217 Tupelo Loop | 0.47mi | 3/3.0 (-1) | 1,943 (+2%) | 1mo | $293,000 | $151 | 64 |
| 2775 Firelight Ln | 0.35mi | 3/2.0 (-1) | 1,712 (-10%) | 1mo | $344,994 | $202 | 62 |
| 3305 Mission Oak Pl | 0.59mi | 5/3.0 (+1) | 1,981 (+4%) | 0mo | $359,900 | $182 | 56 |
| 3179 Tupelo Loop | 0.49mi | 3/2.0 (-1) | 1,712 (-10%) | 2mo | $329,994 | $193 | 55 |
| 2815 Woodbridge Crossing Ct | 0.36mi | 5/3.0 (+1) | 2,119 (+12%) | 0mo | $354,000 | $167 | 54 |
| 3190 Tupelo Loop | 0.52mi | 3/3.0 (-1) | 2,106 (+11%) | 1mo | $339,494 | $161 | 47 |
| 3200 Silverado Cir | 0.73mi | 4/2.0 | 2,165 (+14%) | 2mo | $375,000 | $173 | 41 |
Match score weights: distance 35% · size 25% · config 20% · recency 20%. Top-matched comps best support the ARV.
Projected returns pro-forma
-3.0% appreciation · 0.46% rent growth · sell at horizon
- IRR
- -19.3%
- Equity multiple
- 0.34×
- Total profit
- $-55,419
- Equity at exit
- $44,582
- IRR
- -17.8%
- Equity multiple
- 0.13×
- Total profit
- $-72,903
- Equity at exit
- $25,852
Cash invested: $83,720 (down + closing). Projections, not guarantees.
Landlord ↔ Tenant lean methodology
- Overall (STATE)
- 87 Strongly Landlord-Friendly
- State Florida
- 87 Strongly Landlord-Friendly · R+3
- County
- — inherits STATE
- City
- — inherits STATE
ZIP-level market 32043
- Home prices YoY
- -26.3%
- Rents YoY
- 0.5%
- Active inventory
- 891
- Price-to-rent
- 10.5×
Monthly cashflow live
- Estimated rent
- $2,377 high interval (Pro) →
- Mortgage (P&I)
- −$1,568
- Tax from tax record
- −$144 /mo · $1,723/yr
- Insurance
- −$125
- HOA
- −$57
- Vacancy / Maint / Mgmt
- −$499
- Net cashflow
- $-15
Break-even live
Sensitivity live
| Price | -10% $154 | -5% $69 | +0% $-15 | +5% $-100 | +10% $-185 |
|---|---|---|---|---|---|
| Rent | -10% $-203 | -5% $-109 | +0% $-15 | +5% $79 | +10% $173 |
| Rate | -1.0pp $135 | -0.5pp $61 | base $-15 | +0.5pp $-93 | +1.0pp $-172 |
UW: 25.0% down · 7.5% · 30yr · 1.5% tax · 5.0% vac · 8.0% maint · 8.0% mgmt
Financing live
Cash to close
- Down payment
- $74,750
- Closing costs
- $8,970
- Reserves months
- —
- Total cash needed
- —
Loan-product check · same deal, 3 products live
Conventional
25% down · 7.5% · 30yr
- Down + closing
- —
- Monthly P&I
- —
- Monthly cashflow
- —
- DSCR
- —
- Eligible?
- —
Personal DTI + credit; lowest rate.
DSCR
20% down · 8.5% · 30yr
- Down + closing
- —
- Monthly P&I
- —
- Monthly cashflow
- —
- DSCR
- —
- Eligible?
- —
No personal income docs; deal must DSCR.
Hard money
10% down · 12.0% · 12mo
- Down + closing
- —
- Monthly P&I
- —
- Monthly cashflow
- —
- DSCR
- —
- Eligible?
- —
Short-term bridge; refi at stabilization.
Rent comps 11 comps
| Address | Beds | Baths | Sqft | Rent | $/sqft | DOM | Units | Dist |
|---|---|---|---|---|---|---|---|---|
| 2506 Creekfront Dr Green Cove Springs, FL | 4.0 | 2.0 | 1638 | $2,554 | $1.56 | 25d | 1 | 0.06mi |
| 2653 Fernleaf Dr Green Cove Springs, FL | 4.0 | 2.0 | 1638 | $2,005 | $1.22 | 9d | 1 | 0.07mi |
| 2621 Fernleaf Dr Green Cove Springs, FL | 4.0 | 2.0 | 1870 | $2,100 | $1.12 | 0d | 1 | 0.08mi |
| 2836 Cross Creek Dr Green Cove Springs, FL | 3.0 | 2.0 | 1453 | $1,880 | $1.29 | 14d | 1 | 0.34mi |
| 3349 Citation Dr Green Cove Springs, FL | 3.0 | 2.0 | 1420 | $2,010 | $1.42 | 4d | 1 | 0.79mi |
| 1111 Calla Glen Ln Green Cove Springs, FL | 4.0 | 2.0 | 1980 | $2,140 | $1.08 | 0d | 1 | 0.79mi |
| 2935 Darlington Oak Rd Green Cove Springs, FL | 3.0 | 2.5 | 2096 | $2,350 | $1.12 | 9d | 1 | 0.85mi |
| 3664 Arava Dr Green Cove Springs, FL | 3.0 | 2.0 | 1480 | $2,065 | $1.40 | 16d | 1 | 0.92mi |
| 3268 Avalon Dr Green Cove Springs, FL | 4.0 | 2.0 | 1761 | $2,230 | $1.27 | 5d | 1 | 1.14mi |
| 3549 Bella Sera Ln Green Cove Springs, FL | 3.0 | 2.0 | 1464 | $2,150 | $1.47 | 25d | 1 | 1.21mi |
| 3445 Shelley Dr Green Cove Springs, FL | 3.0 | 2.0 | 1430 | $1,925 | $1.35 | 0d | 1 | 1.43mi |
HOA detail
- Monthly dues
- $57 · $684/yr
- Likely covers
- water
Listing history 8 events
-
2026-06-21days on market $299,000 Active 11 DOM
-
2026-06-18days on market $299,000 Active 8 DOM
-
2026-06-17days on market $299,000 Active 7 DOM
-
2026-06-16days on market $299,000 Active 6 DOM
-
2026-06-15days on market $299,000 Active 5 DOM
-
2026-06-13days on market $299,000 Active 3 DOM
-
2026-06-13remarks 699-char remark
-
2026-06-13$299,000 Active 2 DOM
ⓘ Source: listings_history table (triggers on properties + properties_extension) + one-shot
backfill from property_details.listing_events for pre-trigger history.
Tax reassessment forecast FL · Resets to sale price
- Current annual tax
- $1,723 · $144/mo
- Projected year-2 tax
- $2,482 · $207/mo
- Expected delta
- +$759/yr (+$63/mo · 44.0%)
ⓘ Screening estimate from a state-policy table — verify with the county assessor before closing.
Climate risk First Street
- Flood 1/10 Low FEMA zone X (unshaded) · 0% chance over 30 yrs
- Wildfire 7/10 Severe
- Heat 8/10 Severe 7 d/yr ≥108°F today · 20 d/yr by 30 yrs out
- Wind 9/10 Extreme 99% chance of damaging wind over 30 yrs
- Air quality 3/10 Moderate 3 unhealthy d/yr today · 3 by 30 yrs out
Nearby sold comps map
Loading sold comps map…
Walkable amenities ~0.75 mi
Loading nearby amenities…
Taxation est. · year 1
- Rental income
- $28,525
- − Mortgage interest
- −$16,749
- − Property taxes
- −$1,723
- − Insurance
- −$1,495
- − Repairs & maintenance
- −$2,282
- − Management
- −$2,282
- − HOA
- −$684
- − Depreciation
- −$8,698
- Taxable loss
- −$5,388
- Est. tax savings @ 24.0%
- +$1,293
- After-tax cash flow
- $1,110/yr
For passive investors: Depreciation is non-cash, so a rental often shows a tax loss while cash-flowing — sheltering income. Rental losses are passive: they offset passive income freely, and up to $25,000/yr can offset ordinary (W-2) income if you actively participate and your MAGI is under $100k (phasing out to $0 by $150k); unused losses carry forward. On sale, claimed depreciation is recaptured at up to 25%, and gains may owe capital-gains tax (a 1031 exchange can defer both). Figures are a year-1 estimate at your 24.0% rate — not tax advice; consult a CPA.
Schools (NCES district)
- District
- Clay
- NCES district ID
- 1200300
- Math proficiency
- 58% ▼ -8.00%
- Reading proficiency
- 59% ▼ -3.00%
- Median HH income
- $59,379
- Composite
- 50.73/100
- National rank
- #1815
- State rank
- #14 of 73 in FL
Livability — Asbury Lake
- Score
- 61/100
- State rank
- #776
- US rank
- #17575
Category grades
Schools grade is shown separately in the Schools card above.
Census & demographics
- Census place
- Asbury Lake, FL
- County
- Clay County · 208,450 people
- Metro
- Jacksonville, FL
- Population (ZIP)
- 34,562
- Household income
- $84,145
- Rent vs Own
- Severe rent burden
- 449.0
Population outlook (Clay County) Hauer SSP2
- Today (2025)
- 230,495 people
- By 2030
- 242,427 · +5.2%
- By 2040
- 262,244 · +13.8%
- By 2050
- 275,148 · +19.4%
- By 2075
- 295,397 · +28.2%
- By 2100
- 287,592 · +24.8%
Race, ethnicity, and origin ACS 2023
- Neighborhood character
- Predominantly White (77%)
- Race & ethnicity
- White 77% Black 10% Two or more races 7% Hispanic / Latino 6% Asian 2%
- Hispanic origin (detail)
- Mexican 2% Puerto Rican 1%
- Common ancestry
- Slovak 3% Romanian 2% Lithuanian 2%
- Foreign-born
- 5% · Canada
- Languages at home
- 92% English-only · Spanish 5% French/Haitian/Cajun 1% Other Indo-European 1%
Political lean MEDSL · Clay
- 2024 margin
- Solid R (+39.3) · D 29.9% · R 69.2%
- 2008→2024 swing
- +3.6pp toward D · 2008: -42.8pp · 2024: -39.3pp
- All cycles
- 2024: R+39.3 2020: R+37.1 2016: R+44.3 2012: R+45.8 2008: R+42.8
Not yet ingested
- Civics
- —
Market trends
- HPI YoY
- ▼ -107.34%
- Current HPI
- 301.3212
- Rent YoY
- ▲ 0.46%
- Metro
- Jacksonville, FL
- State GDP YoY
- ▲ 3.28%
- F500 in state
- 36
Industry mix (Fortune 500 HQ in FL)
| Industry | F500 HQs | Revenue |
|---|---|---|
| Industrial Technology | 2 | $29B |
|
||
| Insurance | 2 | $17B |
|
||
| Retail | 1 | $60B |
|
||
| Technology Distribution | 1 | $58B |
|
||
| Homebuilding | 1 | $35B |
|
||
| Technology Manufacturing | 1 | $35B |
|
||
Price history
-41.4% since first listed5 events — show timeline
- 2026-06-10 Listed $299,000 realMLS
- 2005-07-27 Listing Removed — realMLS
- 2005-07-26 Sold (MLS) $201,020 realMLS
- 2005-07-22 Listed $201,020 realMLS
- 2004-08-24 Sold (Public Records) $510,000 Public Records
Property tax history
+3.0%/yrLatest (2024): $1,723 · +4.6% YoY. Source: county tax records.
Cash-flow waterfall
monthlySold comps — $/sqft
last 12 mo · ≤1 miLoading sold comps…