7394 State Highway 97 #19 · Ontario, OH
Flood risk 1/10 · Minimal
- FEMA flood zone
- X (unshaded)
- Chance of flooding over 30 yrs
- 0.0%
- Est. flood insurance / yr
- $507 – $1,088
Fire risk 1/10 · Minimal
- Est. fire insurance / yr
- $713 – $1,323
Heat risk 2/10 · Minimal
- Hot days now (above 97°F)
- 7 days/yr
- Hot days in 30 yrs
- 17 days/yr
Wind risk 2/10 · Minimal
- Chance of severe wind over 30 yrs
- —
Air-quality risk 2/10 · Minimal
- Unhealthy air days now
- 0 days/yr
- Unhealthy air days in 30 yrs
- 1 days/yr
Risk factors via First Street. Map © Google.
Why this score? — see what drove the B grade
The composite is a weighted blend of 9 inputs, each scored 0–100. Each bar is that input's sub-score; the figure is the points it added to the 100-point composite (weight × sub-score).
- Cash flow +30.0/30.0
- 1% rule +10.0/10.0
- DSCR +10.0/10.0
- ARV discount +7.5/15.0
- Schools +6.3/10.0
- Livability +3.3/5.0
- Rent growth +2.5/5.0
- Condition / age +2.2/5.0
- Appreciation +0.0/10.0
$39,900
🖨 Deal sheet 📄 Offer letter ✓ Due diligence
Listing remarks
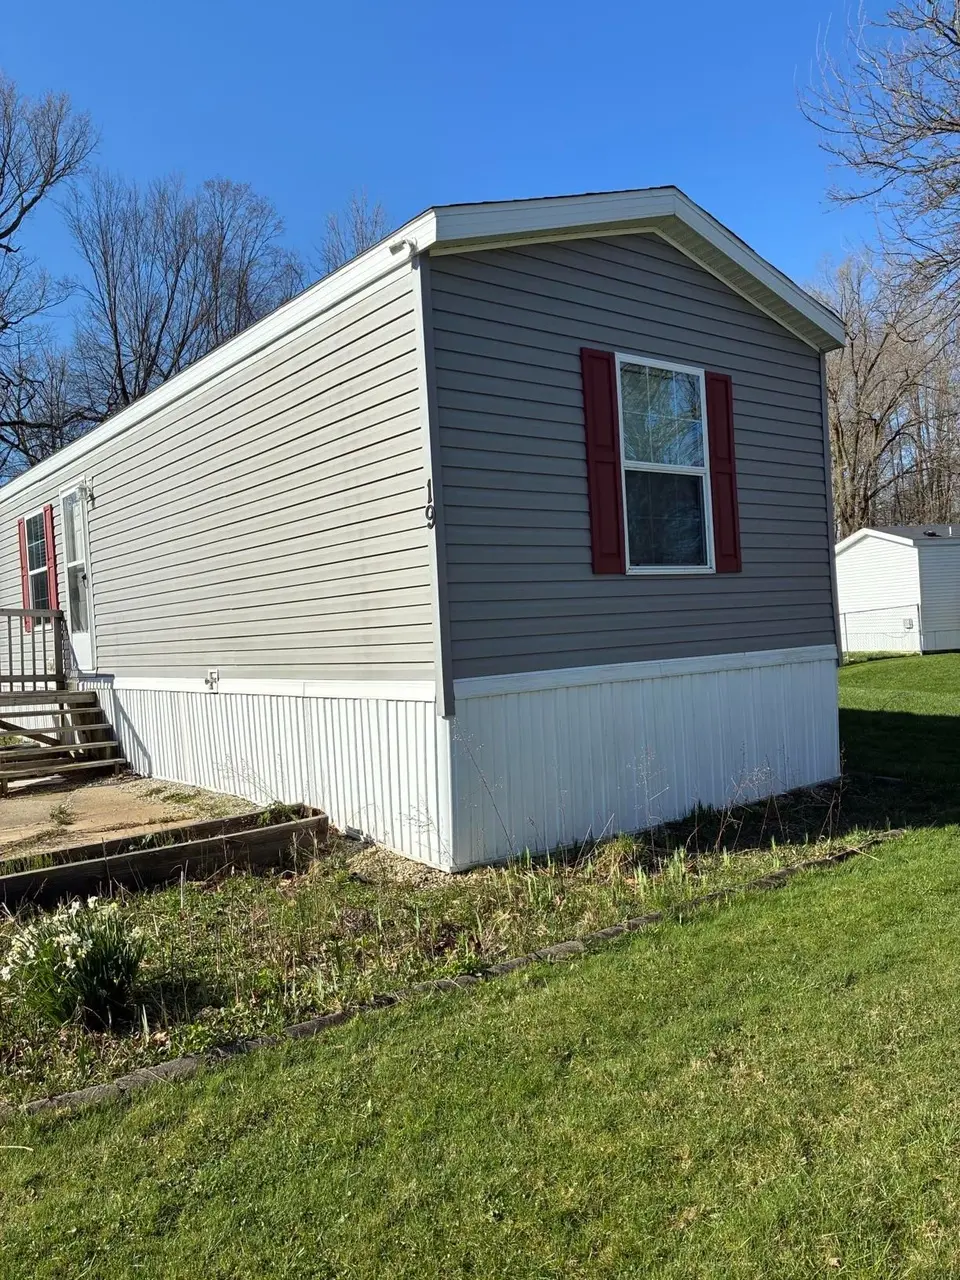
This 2019 Adventure Homes Mojave Model 26 offers a well-designed single-wide layout with 924 square feet of comfortable living space. Featuring 3 bedrooms and 2 full bathrooms, this home provides flexibility for families, guests, or a home office setup. Inside, you'll find a bright and open living area with updated flooring and a functional flow into the kitchen, creating an inviting space for everyday living. The kitchen offers ample cabinet storage and workspace, making meal prep simple and efficient. The primary bedroom includes a private full bathroom, while the additional bedrooms are conveniently located near the second bath. With modern finishes and a clean, move-in ready condition,
Key facts
- Built 2026
- Listed 41 days
Tags
Neighborhood map
What this means for you Summary
Snapshot
- This is a 3-bed/2.0-bath manufactured listed at $40k. Condition is rated fair.
Deal economics
- At list price, monthly cash flow is $593 ($7k/yr) — positive.
- The deal already cash-flows at list — no discount required.
- Meets the 1% rule at list price ($1k rent vs $40k).
- Recommended offer: $39k (3.0% below list) — sets the bar for market timing.
- Cap rate 24.1% vs local median 2.4% in Ontario — top-decile yield for the area; either an underpriced asset or a hidden risk that comps aren't pricing in. Stress-test before assuming the spread holds.
Location & tenants
- Location reads 66/100 on livability (#673 in OH) — a middle-class / working-renter tenant base. Strengths: cost of living A+, housing A+, schools B+; Watch: amenities F, commute F.
- Lexington Local (suburban): math 72% / reading 75% proficiency, ranked #113 of 656 in OH (top 17%) — strong family-tenant draw, lease renewals of 3-5y typical.
- Market conditions: 122 active listings in the ZIP; 129 units permitted in Morrow County in 2024 (0 in 5+ unit buildings).
Forward outlook
- Local home prices are declining (-3.0%/yr); year-one equity from $276 of loan paydown is wiped out by about $1k of value loss. Plan a longer hold.
- Morrow County population projected at -10% by 2050 — secular population decline; favor cash flow + early exit over multi-decade hold.
- At projected returns (-3.0% appreciation + 3.0% rent growth), your $11k cash investment doubles in ~2 years — after that, you're playing with house money.
Negotiation context
- It's been on market 42 days — a 3% lower offer ($39k) is reasonable based on typical stale-listing flexibility.
Questions for the listing agent
- It's been on market 42 days. Have you received any prior offers? Is the seller open to a 3% concession, seller financing, or rate buy-down credit?
- Have any recent inspections been done? Can we get a copy of the seller's disclosures and any deferred-maintenance estimates?
- Is there a deadline driving the sale (1031 exchange, divorce, estate, relocation)? That informs how much negotiation room exists.
- Schools are B-rated — typically a magnet for longer-tenancy family renters. What's the average tenant stay here, and is there a school-zone premium baked into asking?
- What's the average days-on-market for RENTAL listings here right now (not sales)? A rising rental-DOM trend means longer vacancies and softer asking-rent achievability than the comps imply.
- What's the recent tenant-quality profile in this submarket — average credit score on applications, eviction rate, late-payment / NSF rate, and stable-employment percentage? A property-management company in the area should have these aggregated.
- How much new for-sale + rental construction is in the pipeline within 1–3 miles? Heavy new supply typically softens prices + rents 12–24 months out; constrained supply supports both.
Investment metrics
- 1% rule
- 2.76% ✓
- Cap rate
- 24.13%
- Cash-on-cash
- 63.71%
- DSCR
- 3.83
- GRM
- 3.0
CMA / ARV
No comps found within radius.
Projected returns pro-forma
-3.0% appreciation · 3.0% rent growth · sell at horizon
- IRR
- 62.8%
- Equity multiple
- 3.80×
- Total profit
- $31,328
- Equity at exit
- $5,949
- IRR
- 67.3%
- Equity multiple
- 7.80×
- Total profit
- $75,991
- Equity at exit
- $3,450
Cash invested: $11,172 (down + closing). Projections, not guarantees.
Landlord ↔ Tenant lean methodology
- Overall (STATE)
- 73 Landlord-Friendly
- State Ohio
- 73 Landlord-Friendly · R+6
- County
- — inherits STATE
- City
- — inherits STATE
ZIP-level market 44903
- Home prices YoY
- -27.7%
- Active inventory
- 122
- Price-to-rent
- 3.0×
Monthly cashflow live
- Estimated rent
- $1,100 medium interval (Pro) →
- Mortgage (P&I)
- −$209
- Tax est. 1.5%
- −$50 /mo · $598/yr
- Insurance
- −$17
- HOA
- −$0
- Vacancy / Maint / Mgmt
- −$231
- Net cashflow
- $593
Break-even live
UW: 25.0% down · 7.5% · 30yr · 1.5% tax · 5.0% vac · 8.0% maint · 8.0% mgmt
Financing live
Cash to close
- Down payment
- $9,975
- Closing costs
- $1,197
- Reserves months
- —
- Total cash needed
- —
Loan-product check · same deal, 3 products live
Conventional
25% down · 7.5% · 30yr
- Down + closing
- —
- Monthly P&I
- —
- Monthly cashflow
- —
- DSCR
- —
- Eligible?
- —
Personal DTI + credit; lowest rate.
DSCR
20% down · 8.5% · 30yr
- Down + closing
- —
- Monthly P&I
- —
- Monthly cashflow
- —
- DSCR
- —
- Eligible?
- —
No personal income docs; deal must DSCR.
Hard money
10% down · 12.0% · 12mo
- Down + closing
- —
- Monthly P&I
- —
- Monthly cashflow
- —
- DSCR
- —
- Eligible?
- —
Short-term bridge; refi at stabilization.
Listing history 11 events
-
2026-06-12days on market $39,900 Active 42 DOM
-
2026-06-09days on market $39,900 Active 39 DOM
-
2026-06-08days on market $39,900 Active 38 DOM
-
2026-06-07days on market $39,900 Active 37 DOM
-
2026-06-05days on market $39,900 Active 34 DOM
-
2026-06-03days on market $39,900 Active 33 DOM
-
2026-06-02days on market $39,900 Active 32 DOM
-
2026-06-01days on market $39,900 Active 31 DOM
-
2026-05-31days on market $39,900 Active 30 DOM
-
2026-05-30days on market $39,900 Active 29 DOM
-
2026-05-02$39,900 Active 944-char remark
ⓘ Source: listings_history table (triggers on properties + properties_extension) + one-shot
backfill from property_details.listing_events for pre-trigger history.
Climate risk First Street
- Flood 1/10 Low FEMA zone X (unshaded) · 0% chance over 30 yrs
- Wildfire 1/10 Low
- Heat 2/10 Low 7 d/yr ≥97°F today · 17 d/yr by 30 yrs out
- Wind 2/10 Low
- Air quality 2/10 Low 0 unhealthy d/yr today · 1 by 30 yrs out
Nearby sold comps map
Loading sold comps map…
Walkable amenities ~0.75 mi
Loading nearby amenities…
Taxation est. · year 1
- Rental income
- $13,198
- − Mortgage interest
- −$2,235
- − Property taxes
- −$598
- − Insurance
- −$200
- − Repairs & maintenance
- −$1,056
- − Management
- −$1,056
- − Depreciation
- −$1,161
- Taxable income
- $6,893
- Est. tax owed @ 24.0%
- −$1,654
- After-tax cash flow
- $5,463/yr
For passive investors: Depreciation is non-cash, so a rental often shows a tax loss while cash-flowing — sheltering income. Rental losses are passive: they offset passive income freely, and up to $25,000/yr can offset ordinary (W-2) income if you actively participate and your MAGI is under $100k (phasing out to $0 by $150k); unused losses carry forward. On sale, claimed depreciation is recaptured at up to 25%, and gains may owe capital-gains tax (a 1031 exchange can defer both). Figures are a year-1 estimate at your 24.0% rate — not tax advice; consult a CPA.
Condition & rehab AI · 2 photos
This 2019 Adventure Homes Mojave Model 26 is in good condition with updated finishes and a move-in ready layout. However, some landscaping and curb appeal improvements can further enhance its value.
Value-add opportunities
- Both Landscaping and curb appeal improvements — Enhances curb appeal and can attract more buyers or renters.
- Both Painting exterior siding — Fresh paint can improve the home's appearance and value.
- Both Landscaping and curb appeal improvements — Enhances curb appeal and can attract more buyers or renters.
Renovation cost estimate screening
Value-add ROI direction
- Both Landscaping and curb appeal improvements — Enhances curb appeal and can attract more buyers or renters. ↑
- Both Painting exterior siding — Fresh paint can improve the home's appearance and value. ↑
- Both Landscaping and curb appeal improvements — Enhances curb appeal and can attract more buyers or renters. ↑
ⓘ Cost ranges are severity-bucket heuristics (US national rule-of-thumb). Get contractor quotes + a written scope before underwriting a rehab budget.
Schools (NCES district)
- District
- Lexington Local
- NCES district ID
- 3904943
- Math proficiency
- 72% ▼ -9.00%
- Reading proficiency
- 75% ▼ -4.00%
- Median HH income
- $56,984
- Composite
- 62.93/100
- National rank
- #659
- State rank
- #113 of 656 in OH
Livability — Ontario
- Score
- 66/100
- State rank
- #673
- US rank
- #11878
Category grades
Schools grade is shown separately in the Schools card above.
Census & demographics
- County
- Richland · 128,966 people
- City population
- 17,059
- Metro
- Mansfield, OH
- Population (ZIP)
- 26,804
- Household income
- $65,421
- Rent vs Own
- Severe rent burden
- 9.5
Population outlook (Morrow County) Hauer SSP2
- Today (2025)
- 35,607 people
- By 2030
- 35,482 · -0.4%
- By 2040
- 34,369 · -3.5%
- By 2050
- 32,038 · -10.0%
- By 2075
- 25,090 · -29.5%
- By 2100
- 17,123 · -51.9%
Race, ethnicity, and origin ACS 2023
- Neighborhood character
- Predominantly White (80%)
- Race & ethnicity
- White 80% Two or more races 9% Black 9% Hispanic / Latino 2% Asian 1%
- Common ancestry
- Slovak 2% Iranian 1% Romanian 1%
- Foreign-born
- 1%
- Languages at home
- 97% English-only · Spanish 1% Other Indo-European 1%
Political lean MEDSL · Morrow
- 2024 margin
- Solid R (+55.7) · D 21.7% · R 77.5%
- 2008→2024 swing
- -32.4pp toward R · 2008: -23.4pp · 2024: -55.7pp
- All cycles
- 2024: R+55.7 2020: R+54.3 2016: R+49.5 2012: R+24.6 2008: R+23.4
Not yet ingested
- Civics
- —
Market trends
- HPI YoY
- ▼ -92.50%
- Current HPI
- 241.9342
- Rent YoY
- —
- Metro
- —
- State GDP YoY
- ▲ 1.98%
- F500 in state
- 48
Industry mix (Fortune 500 HQ in OH)
| Industry | F500 HQs | Revenue |
|---|---|---|
| Insurance | 3 | $145B |
|
||
| Industrial Machinery | 3 | $49B |
|
||
| Financial Services | 3 | $24B |
|
||
| Consumer Goods | 2 | $93B |
|
||
| Aerospace / Defense | 2 | $47B |
|
||
| Utilities | 2 | $33B |
|
||
Cash-flow waterfall
monthlySold comps — $/sqft
last 12 mo · ≤1 miLoading sold comps…