 🏷️ Likely Rental
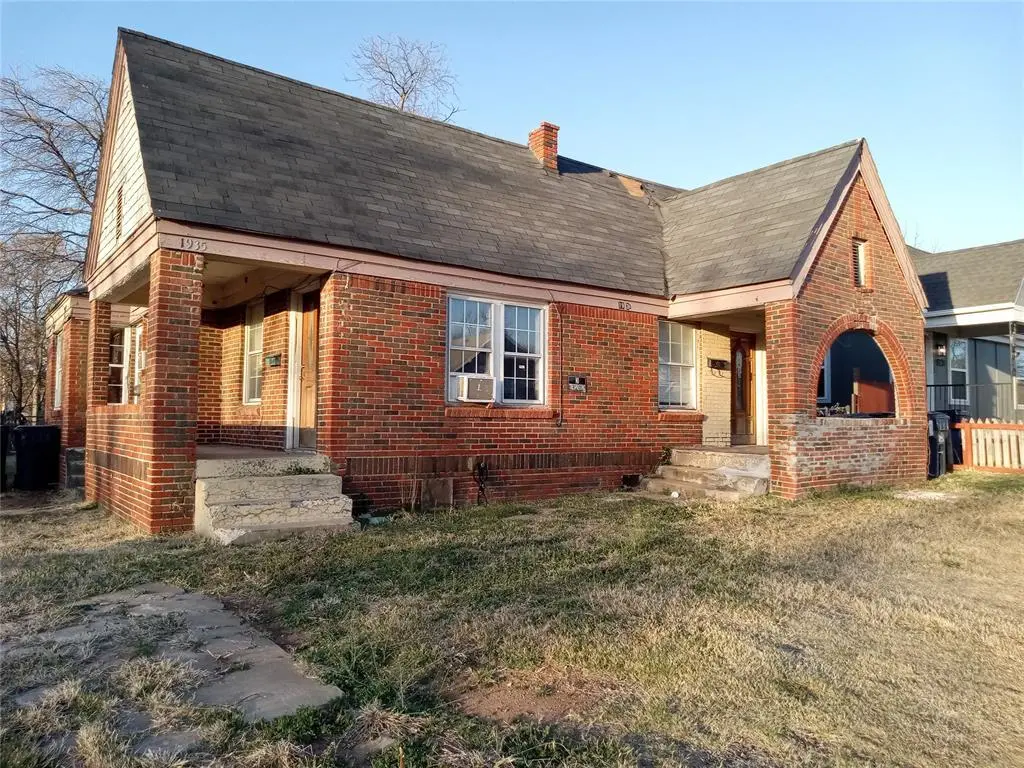
1933 NW 30th St · Oklahoma City, OK
Flood risk 1/10 · Minimal
- FEMA flood zone
- X (unshaded)
- Chance of flooding over 30 yrs
- 0.0%
- Est. flood insurance / yr
- $507 – $1,088
Fire risk 1/10 · Minimal
- Est. fire insurance / yr
- $2,463 – $4,575
Heat risk 5/10 · Moderate
- Hot days now (above 107°F)
- 7 days/yr
- Hot days in 30 yrs
- 18 days/yr
Wind risk 2/10 · Minimal
- Chance of severe wind over 30 yrs
- 3.0%
Air-quality risk 2/10 · Minimal
- Unhealthy air days now
- 1 days/yr
- Unhealthy air days in 30 yrs
- 2 days/yr
Risk factors via First Street. Map © Google.
Why this score? — see what drove the B grade
The composite is a weighted blend of 9 inputs, each scored 0–100. Each bar is that input's sub-score; the figure is the points it added to the 100-point composite (weight × sub-score).
- Cash flow +30.0/30.0
- ARV discount +15.0/15.0
- DSCR +10.0/10.0
- 1% rule +8.3/10.0
- Livability +4.0/5.0
- Rent growth +3.6/5.0
- Condition / age +2.5/5.0
- Schools +0.7/10.0
- Appreciation +0.0/10.0
$145,000
🖨 Deal sheet 📄 Offer letter ✓ Due diligence
Multi-family units
County records classify this as Multi-Family (2-4 Unit). Listing-text estimate: 2 units. confirmed
Listing remarks MLS
?? Investor Opportunity – Duplex with Major Upside Attention investors and house hackers. This as-is duplex near Military Park is loaded with potential and priced to sell. Features include original hardwood floors, spacious units, and a large backyard that adds strong tenant appeal. With projected rents of $600–$850 per unit, this property has the potential to generate solid cash flow after improvements. The property does need a new roof and cosmetic updates, making it a perfect value-add project. Duplexes in the area are selling for $200K+, leaving room for equity and long-term income. Great opportunity for investors looking to fix, rent, and build wealth or add a strong property to their portfolio. Motivated seller. Sold as-is. Bring your offer before this one is gone.
Key facts
- Large backyard
- Cosmetic updates
- New roof
Tags
Neighborhood map
What this means for you Summary
Snapshot
- This is a 2 × 2-bed/2.0-bath units multifamily listed at $145k.
Deal economics
- At list price, monthly cash flow is $640 ($8k/yr) — positive. Per door: $320/mo.
- The deal already cash-flows at list — no discount required.
- Meets the 1% rule at list price ($2k rent vs $145k).
- Recommended offer: $132k (9.0% below list) — sets the bar for market timing.
- Cap rate 11.6% vs local median 3.7% in Oklahoma City — top-decile yield for the area; either an underpriced asset or a hidden risk that comps aren't pricing in. Stress-test before assuming the spread holds.
Location & tenants
- Location reads 80/100 on livability (#3 in OK, #1,635 nationally) — a professional / high-income tenant draw. Strengths: amenities A+, commute A+, cost of living A+; Watch: schools F, crime F.
- Oklahoma City (urban): math 7% / reading 10% proficiency, ranked #254 of 270 in OK (top 94%) — low school quality limits family demand, transient renter base, plan for 1-2y turnover; 82% free/reduced lunch — lower-income household profile, screen leases tightly.
- Market conditions: Rents rising fast (+4.5%/yr); 184 active listings in the ZIP; 40 comparable units currently listed for rent nearby; rentals at typical pace (median 24d on market — plan ~3-4 weeks tenant-placement turnaround); 48% of comp listings sitting > 30 days — soft ceiling on asking rent; 5,365 units permitted in Oklahoma County in 2024 (569 in 5+ unit buildings).
- This rent runs 33% of the median local income ($70k/yr) — at the standard rent-burdened threshold; future hikes will face affordability resistance.
Forward outlook
- Local home prices are declining (-3.0%/yr); year-one equity from $1k of loan paydown is wiped out by about $4k of value loss. Plan a longer hold.
- Oklahoma County population projected at +41% by 2050 — long-run rental-demand tailwind backs the buy-and-hold thesis.
- At projected returns (-3.0% appreciation + 4.5% rent growth), your $41k cash investment doubles in ~6 years — after that, you're playing with house money.
Negotiation context
- It's been on market 93 days — a 9% lower offer ($132k) is reasonable based on typical stale-listing flexibility.
Risks & watch-outs
- Watch-outs: built in 1926 — expect roof / HVAC / electrical / plumbing capex.
- Climate carrying-cost: extreme-heat days projected 7→18/yr by 2055 (HVAC capex compounding) — expect insurance premiums to compound above CPI over the hold.
Questions for the listing agent
- It's been on market 93 days. Have you received any prior offers? Is the seller open to a 9% concession, seller financing, or rate buy-down credit?
- Can we see the unit-by-unit rent roll, current vacancy, and any below-market leases? What's the average tenancy length?
- What capital expenditures (roof, boiler, parking lot, exteriors) have been made in the last 5 years, and what's planned in the next 2?
- Built in 1926 — when were the roof, HVAC, electrical panel, plumbing, and water heater last replaced?
- Why hasn't it sold? Are there any deal-killer items the seller is aware of (foundation, flood, title, zoning, code violations)?
- Is there a deadline driving the sale (1031 exchange, divorce, estate, relocation)? That informs how much negotiation room exists.
- Schools are F-rated, which usually means shorter tenancies and higher turnover. Who's the typical renter profile here, and what's been the actual vacancy rate?
- Crime grade is F in this area — have there been break-ins, vandalism, or insurance claims at this property in the last 3 years? What carrier currently insures it and at what premium?
- What's the average days-on-market for RENTAL listings here right now (not sales)? A rising rental-DOM trend means longer vacancies and softer asking-rent achievability than the comps imply.
- What's the recent tenant-quality profile in this submarket — average credit score on applications, eviction rate, late-payment / NSF rate, and stable-employment percentage? A property-management company in the area should have these aggregated.
- How much new apartment / multifamily construction is in the pipeline within 1–3 miles? Heavy new supply (>2% of stock underway) typically softens rents 12–24 months out; light construction supports rent growth.
Investment metrics
- 1% rule
- 1.33% ✓
- Cap rate
- 11.59%
- Cash-on-cash
- 18.91%
- DSCR
- 1.84
- GRM
- 6.3
CMA / ARV
- ARV (median comp)
- $189,684
- List price
- $145,000
- Delta
- -23.56%
- Verdict
- UNDERPRICED
- Comps
- 5 within 1.0 mi
Show comp detail 1 sale within ~0.75 mi
| Address | Dist | Beds/Ba | Sqft | Sold | Price | $/sf | Match |
|---|---|---|---|---|---|---|---|
| 2141 NW 29th St | 0.25mi | 2/2.0 (+1) | 1,152 (-6%) | 24mo | $180,000 | $156 | 53 |
Match score weights: distance 35% · size 25% · config 20% · recency 20%. Top-matched comps best support the ARV.
Projected returns pro-forma
-3.0% appreciation · 4.45% rent growth · sell at horizon
- IRR
- 12.2%
- Equity multiple
- 1.49×
- Total profit
- $20,051
- Equity at exit
- $21,620
- IRR
- 22.2%
- Equity multiple
- 3.01×
- Total profit
- $81,781
- Equity at exit
- $12,537
Cash invested: $40,600 (down + closing). Projections, not guarantees.
Landlord ↔ Tenant lean methodology
- Overall (STATE)
- 83 Strongly Landlord-Friendly
- State Oklahoma
- 83 Strongly Landlord-Friendly · R+20
- County
- — inherits STATE
- City
- — inherits STATE
ZIP-level market 73118
- Rents YoY
- 4.5%
- Active inventory
- 184
- Price-to-rent
- 12.6×
Monthly cashflow live
- Estimated rent
- $1,925 high interval (Pro) →
- Mortgage (P&I)
- −$760
- Tax from tax record
- −$60 /mo · $723/yr
- Insurance
- −$60
- HOA
- −$0
- Vacancy / Maint / Mgmt
- −$404
- Net cashflow
- $640
Break-even live
2-unit breakdown (identical units grouped — click to expand)
| Units | Beds | Baths | Est. rent |
|---|---|---|---|
| 2× units | 2 | 2 | $1,924 |
| #1 | 2 | 2 | $962 |
| #2 | 2 | 2 | $962 |
| Total (2 units) | $1,925 | ||
UW: 25.0% down · 7.5% · 30yr · 1.5% tax · 5.0% vac · 8.0% maint · 8.0% mgmt
Financing live
Cash to close
- Down payment
- $36,250
- Closing costs
- $4,350
- Reserves months
- —
- Total cash needed
- —
Loan-product check · same deal, 3 products live
Conventional
25% down · 7.5% · 30yr
- Down + closing
- —
- Monthly P&I
- —
- Monthly cashflow
- —
- DSCR
- —
- Eligible?
- —
Personal DTI + credit; lowest rate.
DSCR
20% down · 8.5% · 30yr
- Down + closing
- —
- Monthly P&I
- —
- Monthly cashflow
- —
- DSCR
- —
- Eligible?
- —
No personal income docs; deal must DSCR.
Hard money
10% down · 12.0% · 12mo
- Down + closing
- —
- Monthly P&I
- —
- Monthly cashflow
- —
- DSCR
- —
- Eligible?
- —
Short-term bridge; refi at stabilization.
Rent comps 40 comps
| Address | Beds | Baths | Sqft | Rent | $/sqft | DOM | Units | Dist |
|---|---|---|---|---|---|---|---|---|
| 2004 NW 28th St Oklahoma City, OK | 2.0 | 1.0 | 1425 | $1,195 | $0.84 | 44d | 1 | 0.19mi |
| 2037 NW 32nd Ter Oklahoma City, OK | 2.0 | 1.5 | 1053 | $1,100 | $1.04 | 44d | 1 | 0.22mi |
| 1731 NW 32nd St Unit 11 Oklahoma City, OK | 2.0 | 1.0 | 1000 | $850 | $0.85 | 24d | 1 | 0.24mi |
| 2100 NW 33rd St Oklahoma City, OK | 2.0 | 1.0 | 1004 | $1,245 | $1.24 | 2d | 1 | 0.25mi |
| 1704 NW 32nd St Oklahoma City, OK | 2.0 | 1.0 | 1187 | $1,500 | $1.26 | 2d | 1 | 0.27mi |
| 2132 NW 29th St Unit 2134 Oklahoma City, OK | 2.0 | 1.0 | 850 | $1,000 | $1.18 | 14d | 1 | 0.27mi |
| 2136 NW 32nd St Oklahoma City, OK | 2.0 | 1.0 | 806 | $925 | $1.15 | 21d | 1 | 0.28mi |
| 1601 NW 30th St Oklahoma City, OK | 2.0 | 1.0–2.0 | 698 | $849 | $1.22 | 24d | 13 | 0.30mi |
| 2042 NW 34th St Oklahoma City, OK | 2.0 | 1.0 | 968 | $1,050 | $1.08 | 12d | 1 | 0.31mi |
| 2212 NW 31st St Oklahoma City, OK | 2.0 | 1.0 | 810 | $1,024 | $1.26 | 14d | 1 | 0.32mi |
| 1605 NW 29th St Oklahoma City, OK | 2.0 | 1.0 | 885 | $995 | $1.12 | 44d | 1 | 0.34mi |
| 1607 NW 29th St Oklahoma City, OK | 2.0 | 1.0 | 885 | $850 | $0.96 | 24d | 1 | 0.34mi |
| 2220 NW 32nd St Oklahoma City, OK | 2.0 | 1.0 | 850 | $1,300 | $1.53 | 21d | 1 | 0.35mi |
| 2024 NW 26th St Oklahoma City, OK | 2.0 | 1.0 | 947 | $1,099 | $1.16 | 44d | 1 | 0.35mi |
| 2042 NW 25th St Unit 17E Oklahoma City, OK | 2.0 | 1.0 | 725 | $750 | $1.03 | 44d | 1 | 0.43mi |
| 2030 NW 25th St Unit 17 Oklahoma City, OK | 2.0 | 1.0 | 725 | $750 | $1.03 | 4d | 1 | 0.44mi |
| 2030 NW 25th St Unit 4 Oklahoma City, OK | 2.0 | 1.0 | 725 | $750 | $1.03 | 44d | 1 | 0.44mi |
| 2030 NW 25th St Unit 1 Oklahoma City, OK | 2.0 | 1.0 | 725 | $750 | $1.03 | 44d | 1 | 0.44mi |
| 1446 NW 31st St Unit A Oklahoma City, OK | 2.0 | 1.0 | 1000 | $985 | $0.98 | 2d | 1 | 0.48mi |
| 1446 NW 31st St Unit B Oklahoma City, OK | 2.0 | 1.0 | 900 | $1,040 | $1.16 | 44d | 1 | 0.48mi |
| 2400 NW 30th St Oklahoma City, OK | 2.0 | 2.0 | 1078 | $1,289 | $1.20 | 44d | 1 | 0.57mi |
| 2400 NW 30th St Oklahoma City, OK | 1.0–2.0 | 1.0–2.0 | 801 | $799 | $1.00 | 2d | 11 | 0.61mi |
| 2400 NW 36th St Oklahoma City, OK | 2.0 | 1.0 | 950 | $1,100 | $1.16 | 44d | 1 | 0.68mi |
| 3915 N Pennsylvania Ave Oklahoma City, OK | 2.0 | 2.0 | 1065 | $1,495 | $1.40 | 44d | 1 | 0.68mi |
| 1433 NW 24th St Oklahoma City, OK | 2.0 | 1.0 | 843 | $950 | $1.13 | 21d | 1 | 0.68mi |
| 1429 NW 24th St Unit 119 Oklahoma City, OK | 2.0 | 1.0 | 843 | $950 | $1.13 | 44d | 1 | 0.68mi |
| 1410 NW 25th St Oklahoma City, OK | 1.0 | 1.0 | 800 | $895 | $1.12 | 44d | 1 | 0.69mi |
| 1629 NW 22nd St Unit 202 Oklahoma City, OK | 1.0 | 1.0 | 750 | $845 | $1.13 | 16d | 1 | 0.70mi |
| 1400 NW 25th St Unit 1410 1/2 Oklahoma City, OK | 1.0 | 1.0 | 800 | $795 | $0.99 | 44d | 1 | 0.71mi |
| 1400 NW 25th St Unit 1404 Oklahoma City, OK | 1.0 | 1.0 | 800 | $895 | $1.12 | 44d | 1 | 0.71mi |
| 2515 N Douglas Ave Unit 101 Oklahoma City, OK | 1.0 | 1.0 | 1000 | $895 | $0.90 | 44d | 1 | 0.73mi |
| 2236 NW 22nd St Oklahoma City, OK | 2.0 | 1.0 | 1200 | $950 | $0.79 | 21d | 1 | 0.74mi |
| 2504 NW 27th St Oklahoma City, OK | 2.0 | 1.0 | 1303 | $1,450 | $1.11 | 44d | 1 | 0.74mi |
| 2300 N Youngs Blvd Oklahoma City, OK | 1.0 | 1.0 | 1176 | $865 | $0.74 | 44d | 1 | 0.74mi |
| 2010 NW 20th St Unit 2428 Oklahoma City, OK | 1.0 | 1.0 | 800 | $899 | $1.12 | 44d | 1 | 0.76mi |
| 2207 NW 19th St Oklahoma City, OK | 1.0 | 1.5 | 1208 | $1,050 | $0.87 | 4d | 1 | 0.85mi |
| 2209 NW 19th St Oklahoma City, OK | 1.0 | 1.0 | 950 | $1,000 | $1.05 | 4d | 1 | 0.86mi |
| 2209 NW 19th St Oklahoma City, OK | 1.0 | 1.0 | 950 | $1,000 | $1.05 | 2d | 1 | 0.86mi |
| 2424 NW 39th St Oklahoma City, OK | 2.0 | 1.0–1.5 | 787 | $738 | $0.94 | 3d | 4 | 0.86mi |
| 3711 N Military Ave Oklahoma City, OK | 2.0 | 1.0 | 1078 | $1,295 | $1.20 | 2d | 1 | 0.87mi |
Listing history 6 events
-
2026-06-02days on market $145,000 Active 93 DOM
-
2026-06-01days on market $145,000 Active 92 DOM
-
2026-05-31days on market $145,000 Active 91 DOM
-
2026-04-27price $145,000 798-char remark
Show marketing remark (798 chars)
?? Investor Opportunity – Duplex with Major Upside Attention investors and house hackers. This as-is duplex near Military Park is loaded with potential and priced to sell. Features include original hardwood floors, spacious units, and a large backyard that adds strong tenant appeal. With projected rents of $600–$850 per unit, this property has the potential to generate solid cash flow after improvements. The property does need a new roof and cosmetic updates, making it a perfect value-add project. Duplexes in the area are selling for $200K+, leaving room for equity and long-term income. Great opportunity for investors looking to fix, rent, and build wealth or add a strong property to their portfolio. Motivated seller. Sold as-is. Bring your offer before this one is gone.
-
2026-03-10price $150,000 798-char remark
Show marketing remark (798 chars)
?? Investor Opportunity – Duplex with Major Upside Attention investors and house hackers. This as-is duplex near Military Park is loaded with potential and priced to sell. Features include original hardwood floors, spacious units, and a large backyard that adds strong tenant appeal. With projected rents of $600–$850 per unit, this property has the potential to generate solid cash flow after improvements. The property does need a new roof and cosmetic updates, making it a perfect value-add project. Duplexes in the area are selling for $200K+, leaving room for equity and long-term income. Great opportunity for investors looking to fix, rent, and build wealth or add a strong property to their portfolio. Motivated seller. Sold as-is. Bring your offer before this one is gone.
-
2026-03-01$160,000 Active 798-char remark
Show marketing remark (798 chars)
?? Investor Opportunity – Duplex with Major Upside Attention investors and house hackers. This as-is duplex near Military Park is loaded with potential and priced to sell. Features include original hardwood floors, spacious units, and a large backyard that adds strong tenant appeal. With projected rents of $600–$850 per unit, this property has the potential to generate solid cash flow after improvements. The property does need a new roof and cosmetic updates, making it a perfect value-add project. Duplexes in the area are selling for $200K+, leaving room for equity and long-term income. Great opportunity for investors looking to fix, rent, and build wealth or add a strong property to their portfolio. Motivated seller. Sold as-is. Bring your offer before this one is gone.
ⓘ Source: listings_history table (triggers on properties + properties_extension) + one-shot
backfill from property_details.listing_events for pre-trigger history.
Tax reassessment forecast OK · Resets to sale price
- Current annual tax
- $723 · $60/mo
- Projected year-2 tax
- $1,305 · $109/mo
- Expected delta
- +$582/yr (+$49/mo · 80.6%)
ⓘ Screening estimate from a state-policy table — verify with the county assessor before closing.
Climate risk First Street
- Flood 1/10 Low FEMA zone X (unshaded) · 0% chance over 30 yrs
- Wildfire 1/10 Low
- Heat 5/10 Major 7 d/yr ≥107°F today · 18 d/yr by 30 yrs out
- Wind 2/10 Low 3% chance of damaging wind over 30 yrs
- Air quality 2/10 Low 1 unhealthy d/yr today · 2 by 30 yrs out
Nearby sold comps map
Loading sold comps map…
Walkable amenities ~0.75 mi
Loading nearby amenities…
Taxation est. · year 1
- Rental income
- $23,100
- − Mortgage interest
- −$8,122
- − Property taxes
- −$723
- − Insurance
- −$725
- − Repairs & maintenance
- −$1,848
- − Management
- −$1,848
- − Depreciation
- −$4,218
- Taxable income
- $5,616
- Est. tax owed @ 24.0%
- −$1,348
- After-tax cash flow
- $6,329/yr
For passive investors: Depreciation is non-cash, so a rental often shows a tax loss while cash-flowing — sheltering income. Rental losses are passive: they offset passive income freely, and up to $25,000/yr can offset ordinary (W-2) income if you actively participate and your MAGI is under $100k (phasing out to $0 by $150k); unused losses carry forward. On sale, claimed depreciation is recaptured at up to 25%, and gains may owe capital-gains tax (a 1031 exchange can defer both). Figures are a year-1 estimate at your 24.0% rate — not tax advice; consult a CPA.
Schools (NCES district)
- District
- Oklahoma City
- NCES district ID
- 4022770
- Math proficiency
- 7% ▼ -5.00%
- Reading proficiency
- 10% ▼ -6.00%
- Median HH income
- $35,606
- Composite
- 7.0/100
- National rank
- #9970
- State rank
- #254 of 270 in OK
Livability — Oklahoma City
- Score
- 80/100
- State rank
- #3
- US rank
- #1635
Category grades
Schools grade is shown separately in the Schools card above.
Census & demographics
- Census place
- Oklahoma City, OK
- County
- Oklahoma County · 771,644 people
- City population
- 498,656
- Metro
- Oklahoma City, OK
- Population (ZIP)
- 14,262
- Household income
- $69,827
- Rent vs Own
- Severe rent burden
- 728.0
Population outlook (Oklahoma County) Hauer SSP2
- Today (2025)
- 911,875 people
- By 2030
- 982,413 · +7.7%
- By 2040
- 1,130,468 · +24.0%
- By 2050
- 1,288,422 · +41.3%
- By 2075
- 1,711,482 · +87.7%
- By 2100
- 2,088,448 · +129.0%
Race, ethnicity, and origin ACS 2023
- Neighborhood character
- Predominantly White (67%)
- Race & ethnicity
- White 67% Hispanic / Latino 14% Two or more races 13% Black 5% Asian 4% Native American 2%
- Hispanic origin (detail)
- Mexican 10%
- Common ancestry
- Slovak 5% Italian 4% Portuguese 3%
- Foreign-born
- 9% · Canada, Vietnam, Philippines
- Languages at home
- 87% English-only · Spanish 10% Vietnamese 1% Other Asian/Pacific 1%
Political lean MEDSL · Oklahoma
- 2024 margin
- Toss-up / Even · D 48.0% · R 49.7% · Other 2.3%
- 2008→2024 swing
- +15.1pp toward D · 2008: -16.8pp · 2024: -1.7pp
- All cycles
- 2024: R+1.7 2020: R+1.1 2016: R+10.5 2012: R+16.7 2008: R+16.8
Not yet ingested
- Civics
- —
Market trends
- HPI YoY
- ▼ -321.71%
- Current HPI
- 298.6106
- Rent YoY
- ▲ 4.45%
- Metro
- Oklahoma City, OK
- State GDP YoY
- ▲ 1.55%
- F500 in state
- 6
Industry mix (Fortune 500 HQ in OK)
| Industry | F500 HQs | Revenue |
|---|---|---|
| Energy | 3 | $48B |
|
||
Price history
-9.4% since first listed3 events — show timeline
- 2026-04-27 Price Changed $145,000 MLSOK
- 2026-03-10 Price Changed $150,000 MLSOK
- 2026-03-01 Listed $160,000 MLSOK
Property tax history
+4.8%/yrLatest (2025): $723 · +4.2% YoY. Source: county tax records.
Cash-flow waterfall
monthlySold comps — $/sqft
last 12 mo · ≤1 miLoading sold comps…