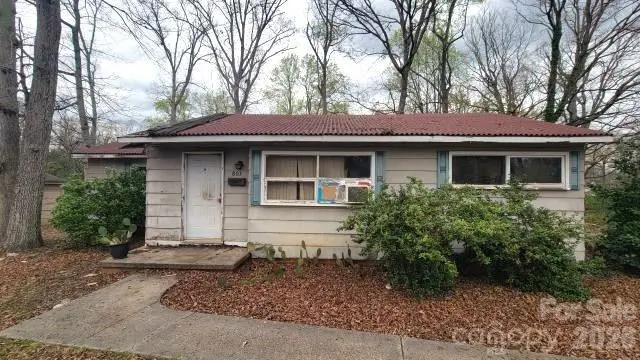
803 Jackson St · Kings Mountain, NC
Flood risk 1/10 · Minimal
- FEMA flood zone
- X (unshaded)
- Chance of flooding over 30 yrs
- 0.0%
- Est. flood insurance / yr
- $507 – $1,088
Fire risk 3/10 · Minor
- Est. fire insurance / yr
- $906 – $1,684
Heat risk 5/10 · Moderate
- Hot days now (above 103°F)
- 7 days/yr
- Hot days in 30 yrs
- 17 days/yr
Wind risk 4/10 · Minor
- Chance of severe wind over 30 yrs
- 15.0%
Air-quality risk 3/10 · Minor
- Unhealthy air days now
- 2 days/yr
- Unhealthy air days in 30 yrs
- 4 days/yr
Risk factors via First Street. Map © Google.
Why this score? — see what drove the B+ grade
The composite is a weighted blend of 9 inputs, each scored 0–100. Each bar is that input's sub-score; the figure is the points it added to the 100-point composite (weight × sub-score).
- Cash flow +30.0/30.0
- ARV discount +15.0/15.0
- DSCR +10.0/10.0
- 1% rule +8.0/10.0
- Schools +4.0/10.0
- Livability +3.2/5.0
- Rent growth +2.5/5.0
- Condition / age +2.5/5.0
- Appreciation +0.0/10.0
$130,000
🖨 Deal sheet 📄 Offer letter ✓ Due diligence
Listing remarks
Investor Special! 3-bedroom, 2-bath ranch home situated on a generous 0.34-acre lot—loaded with potential and ready for your vision. This property offers a solid footprint with a functional layout, making it an ideal candidate for renovation or resale. The spacious lot and existing structure create a strong foundation to transform this property into something truly special. Enjoy the added value of a private setting with mature trees and outdoor space, plus a rear deck area that, with improvement, could become a great entertaining space. Conveniently located near shopping, dining, and major roadways, offering easy access to surrounding areas while still maintaining a quiet residential
Key facts
- Generous lot
- Private setting
- Rear deck area
Tags
Property features AI
Finance
- HOA & community: No HOA
Exterior
- Parking: Driveway; 2 open parking spaces
- Utilities: City water; Public sewer
- Home design: Single-family residence (residential); Site-built construction; One story; R10 zoning
- Construction: Vinyl exterior; Crawl space foundation
- Exterior features: Deck; Patio; Concrete road access; Publicly maintained road
Interior
- Kitchen: Microwave; Electric water heater
- Bedrooms: 3 bedrooms, all on the main level
- Flooring: Wood flooring
- Bathrooms: 2 full bathrooms, both on the main level
- Heating & cooling: No central heating listed; Central air conditioning; Ceiling fans
- Interior features: Attic access (other); Living room fireplace; 9 total rooms
- Laundry & utility: Laundry room on the main level
Neighborhood map
What this means for you Summary
Snapshot
- This is a 3-bed/2.0-bath single-family listed at $130k.
Deal economics
- At list price, monthly cash flow is $520 ($6k/yr) — positive.
- The deal already cash-flows at list — no discount required.
- Meets the 1% rule at list price ($2k rent vs $130k).
- Recommended offer: $126k (3.0% below list) — sets the bar for market timing.
- Cap rate 11.1% vs local median 3.4% in Kings Mountain — top-decile yield for the area; either an underpriced asset or a hidden risk that comps aren't pricing in. Stress-test before assuming the spread holds.
Location & tenants
- Location reads 63/100 on livability (#404 in NC) — a middle-class / working-renter tenant base. Strengths: cost of living A+, housing A+; Watch: crime F, amenities F, commute F.
- Cleveland County Schools (rural): math 47% / reading 49% proficiency, ranked #76 of 178 in NC (top 43%) — families likely to look elsewhere, expect single-tenant / working-renter base with shorter leases.
- Zoned schools: East Elementary (math 67% / reading 52%, grade B-, #205 of 1,410 statewide, top 16%, 214 students, 98% FRL); Kings Mountain High (math 68% / reading 65%, grade B, #150 of 535 statewide, top 28%, 1,236 students, 56% FRL) — zoned schools average 77% FRL vs 59% district-wide (18 pts higher); higher-poverty schools than district average — tighter screening recommended.
- Zoned-school proficiency averages 63% at this address vs 48% district-wide (+15 pts) — the actual schools serving this property are materially stronger than the Cleveland County Schools average implies; a family-tenant draw the district grade alone would hide.
- Market conditions: 194 active listings in the ZIP; 5 comparable units currently listed for rent nearby; rentals at typical pace (median 22d on market — plan ~3-4 weeks tenant-placement turnaround); 461 units permitted in Cleveland County in 2024 (38 in 5+ unit buildings).
Forward outlook
- Local home prices are declining (-3.0%/yr); year-one equity from $899 of loan paydown is wiped out by about $4k of value loss. Plan a longer hold.
- Cleveland County population projected at -15% by 2050 — secular population decline; favor cash flow + early exit over multi-decade hold.
- At projected returns (-3.0% appreciation + 3.0% rent growth), your $36k cash investment doubles in ~8 years — after that, you're playing with house money.
Negotiation context
- It's been on market 54 days — a 3% lower offer ($126k) is reasonable based on typical stale-listing flexibility.
- Current owner paid $74k; list at $130k implies a 76% gain — meaningful room to come down on a strong offer.
Risks & watch-outs
- Watch-outs: built in 1954 — expect roof / HVAC / electrical / plumbing capex.
- Climate carrying-cost: extreme-heat days projected 7→17/yr by 2055 (HVAC capex compounding) — expect insurance premiums to compound above CPI over the hold.
Questions for the listing agent
- It's been on market 54 days. Have you received any prior offers? Is the seller open to a 3% concession, seller financing, or rate buy-down credit?
- Built in 1954 — when were the roof, HVAC, electrical panel, plumbing, and water heater last replaced?
- Is there a deadline driving the sale (1031 exchange, divorce, estate, relocation)? That informs how much negotiation room exists.
- Schools are D-rated, which usually means shorter tenancies and higher turnover. Who's the typical renter profile here, and what's been the actual vacancy rate?
- Crime grade is F in this area — have there been break-ins, vandalism, or insurance claims at this property in the last 3 years? What carrier currently insures it and at what premium?
- What's the average days-on-market for RENTAL listings here right now (not sales)? A rising rental-DOM trend means longer vacancies and softer asking-rent achievability than the comps imply.
- What's the recent tenant-quality profile in this submarket — average credit score on applications, eviction rate, late-payment / NSF rate, and stable-employment percentage? A property-management company in the area should have these aggregated.
- How much new for-sale + rental construction is in the pipeline within 1–3 miles? Heavy new supply typically softens prices + rents 12–24 months out; constrained supply supports both.
Investment metrics
- 1% rule
- 1.30% ✓
- Cap rate
- 11.09%
- Cash-on-cash
- 17.14%
- DSCR
- 1.76
- GRM
- 6.4
CMA / ARV
- ARV (on-the-fly)
- $213,624
- Comps found
- 12
Show comp detail 12 sales within ~0.75 mi
| Address | Dist | Beds/Ba | Sqft | Sold | Price | $/sf | Match |
|---|---|---|---|---|---|---|---|
| 914 Woodside Dr | 0.32mi | 3/2.0 | 1,243 (+0%) | 7mo | $240,000 | $193 | 79 |
| 702 Rhodes Ave | 0.19mi | 3/1.0 | 1,282 (+3%) | 6mo | $220,000 | $172 | 77 |
| 714 Linwood Rd | 0.19mi | 2/1.0 (-1) | 1,372 (+10%) | 1mo | $235,000 | $171 | 64 |
| 215 Benfield Rd | 0.53mi | 3/2.0 | 1,320 (+6%) | 3mo | $262,000 | $198 | 62 |
| 2106 Loblolly Ln | 0.55mi | 3/1.5 | 1,180 (-5%) | 5mo | $177,000 | $150 | 60 |
| 1000 Linwood Rd | 0.26mi | 2/2.0 (-1) | 1,057 (-15%) | 3mo | $215,000 | $203 | 56 |
| 922 Church St | 0.22mi | 2/1.0 (-1) | 1,060 (-15%) | 1mo | $180,000 | $170 | 56 |
| 217 Benfield Rd | 0.52mi | 3/2.0 | 1,380 (+11%) | 2mo | $265,200 | $192 | 55 |
| 500 Lynn St | 0.52mi | 3/1.0 | 1,140 (-8%) | 4mo | $80,000 | $70 | 55 |
| 527 Katherine Ave | 0.37mi | 3/1.0 | 1,425 (+15%) | 1mo | $210,000 | $147 | 53 |
| 213 Benfield Rd | 0.54mi | 3/2.0 | 1,383 (+11%) | 5mo | $264,000 | $191 | 52 |
| 823 1st St | 0.45mi | 2/1.0 (-1) | 1,071 (-14%) | 6mo | $180,000 | $168 | 42 |
Match score weights: distance 35% · size 25% · config 20% · recency 20%. Top-matched comps best support the ARV.
Projected returns pro-forma
-3.0% appreciation · 3.0% rent growth · sell at horizon
- IRR
- 8.4%
- Equity multiple
- 1.33×
- Total profit
- $12,015
- Equity at exit
- $19,383
- IRR
- 17.6%
- Equity multiple
- 2.46×
- Total profit
- $52,988
- Equity at exit
- $11,240
Cash invested: $36,400 (down + closing). Projections, not guarantees.
Landlord ↔ Tenant lean methodology
- Overall (STATE)
- 85 Strongly Landlord-Friendly
- State North Carolina
- 85 Strongly Landlord-Friendly · R+3
- County
- — inherits STATE
- City
- — inherits STATE
ZIP-level market 28086
- Home prices YoY
- -28.6%
- Active inventory
- 194
- Price-to-rent
- 6.4×
Monthly cashflow live
- Estimated rent
- $1,689 high interval (Pro) →
- Mortgage (P&I)
- −$682
- Tax from tax record
- −$79 /mo · $944/yr
- Insurance
- −$54
- HOA
- −$0
- Vacancy / Maint / Mgmt
- −$355
- Net cashflow
- $520
Break-even live
UW: 25.0% down · 7.5% · 30yr · 1.5% tax · 5.0% vac · 8.0% maint · 8.0% mgmt
Financing live
Cash to close
- Down payment
- $32,500
- Closing costs
- $3,900
- Reserves months
- —
- Total cash needed
- —
Loan-product check · same deal, 3 products live
Conventional
25% down · 7.5% · 30yr
- Down + closing
- —
- Monthly P&I
- —
- Monthly cashflow
- —
- DSCR
- —
- Eligible?
- —
Personal DTI + credit; lowest rate.
DSCR
20% down · 8.5% · 30yr
- Down + closing
- —
- Monthly P&I
- —
- Monthly cashflow
- —
- DSCR
- —
- Eligible?
- —
No personal income docs; deal must DSCR.
Hard money
10% down · 12.0% · 12mo
- Down + closing
- —
- Monthly P&I
- —
- Monthly cashflow
- —
- DSCR
- —
- Eligible?
- —
Short-term bridge; refi at stabilization.
Rent comps 5 comps
| Address | Beds | Baths | Sqft | Rent | $/sqft | DOM | Units | Dist |
|---|---|---|---|---|---|---|---|---|
| 914 Linwood Rd Kings Mountain, NC | 2.0 | 1.0 | 948 | $1,400 | $1.48 | 4d | 1 | 0.22mi |
| 824 2nd St Kings Mountain, NC | 3.0 | 1.0 | 1445 | $1,700 | $1.18 | 23d | 1 | 0.46mi |
| 1806 Alpine Dr Kings Mountain, NC | 3.0 | 2.0 | 1050 | $1,550 | $1.48 | 21d | 1 | 0.50mi |
| 107 Cambridge Oaks Cir Kings Mountain, NC | 1.0–3.0 | 1.0–2.0 | 986 | $1,219 | $1.24 | 1d | 1 | 1.04mi |
| 711 Lackey St Kings Mountain, NC | 3.0 | 2.5 | 1450 | $1,700 | $1.17 | 23d | 1 | 1.19mi |
Listing history 20 events
-
2026-06-19days on market $130,000 Active 54 DOM
-
2026-06-18days on market $130,000 Active 53 DOM
-
2026-06-17price $130,000 Active 52 DOM
-
2026-06-17days on market $135,000 Active 52 DOM
-
2026-06-16days on market $135,000 Active 51 DOM
-
2026-06-15days on market $135,000 Active 50 DOM
-
2026-06-14days on market $135,000 Active 48 DOM
-
2026-06-13days on market $135,000 Active 47 DOM
-
2026-06-10days on market $135,000 Active 45 DOM
-
2026-06-09days on market $135,000 Active 44 DOM
-
2026-06-08days on market $135,000 Active 43 DOM
-
2026-06-07days on market $135,000 Active 42 DOM
-
2026-06-05days on market $135,000 Active 39 DOM
-
2026-06-03days on market $135,000 Active 38 DOM
-
2026-06-02days on market $135,000 Active 37 DOM
-
2026-06-01days on market $135,000 Active 36 DOM
-
2026-05-31days on market $135,000 Active 35 DOM
-
2026-05-30days on market $135,000 Active 34 DOM
-
2026-04-26$135,000 Active
-
2007-03-30soldstatus $74,000
ⓘ Source: listings_history table (triggers on properties + properties_extension) + one-shot
backfill from property_details.listing_events for pre-trigger history.
Tax reassessment forecast NC · Resets to sale price
- Current annual tax
- $944 · $79/mo
- Projected year-2 tax
- $1,066 · $89/mo
- Expected delta
- +$122/yr (+$10/mo · 12.9%)
ⓘ Screening estimate from a state-policy table — verify with the county assessor before closing.
Climate risk First Street
- Flood 1/10 Low FEMA zone X (unshaded) · 0% chance over 30 yrs
- Wildfire 3/10 Moderate
- Heat 5/10 Major 7 d/yr ≥103°F today · 17 d/yr by 30 yrs out
- Wind 4/10 Moderate 15% chance of damaging wind over 30 yrs
- Air quality 3/10 Moderate 2 unhealthy d/yr today · 4 by 30 yrs out
Nearby sold comps map
Loading sold comps map…
Walkable amenities ~0.75 mi
Loading nearby amenities…
Taxation est. · year 1
- Rental income
- $20,270
- − Mortgage interest
- −$7,282
- − Property taxes
- −$944
- − Insurance
- −$650
- − Repairs & maintenance
- −$1,622
- − Management
- −$1,622
- − Depreciation
- −$3,782
- Taxable income
- $4,368
- Est. tax owed @ 24.0%
- −$1,048
- After-tax cash flow
- $5,189/yr
For passive investors: Depreciation is non-cash, so a rental often shows a tax loss while cash-flowing — sheltering income. Rental losses are passive: they offset passive income freely, and up to $25,000/yr can offset ordinary (W-2) income if you actively participate and your MAGI is under $100k (phasing out to $0 by $150k); unused losses carry forward. On sale, claimed depreciation is recaptured at up to 25%, and gains may owe capital-gains tax (a 1031 exchange can defer both). Figures are a year-1 estimate at your 24.0% rate — not tax advice; consult a CPA.
Schools (NCES district)
- District
- Cleveland County Schools
- NCES district ID
- 3700900
- Math proficiency
- 47% ▬ 0.00%
- Reading proficiency
- 49% ▲ 4.00%
- Median HH income
- $38,501
- Composite
- 40.03/100
- National rank
- #3823
- State rank
- #76 of 178 in NC
Livability — Kings Mountain
- Score
- 63/100
- State rank
- #404
- US rank
- #15377
Category grades
Schools grade is shown separately in the Schools card above.
Census & demographics
- Census place
- Kings Mountain, NC
- County
- Cleveland County · 83,736 people
- City population
- 29,460
- Metro
- Shelby, NC
- Population (ZIP)
- 29,460
- Household income
- $62,414
- Rent vs Own
- Severe rent burden
- 726.0
Population outlook (Cleveland County) Hauer SSP2
- Today (2025)
- 93,671 people
- By 2030
- 91,157 · -2.7%
- By 2040
- 85,519 · -8.7%
- By 2050
- 79,708 · -14.9%
- By 2075
- 68,317 · -27.1%
- By 2100
- 57,145 · -39.0%
Race, ethnicity, and origin ACS 2023
- Neighborhood character
- Predominantly White (74%)
- Race & ethnicity
- White 74% Black 16% Two or more races 4% Hispanic / Latino 4% Asian 2%
- Common ancestry
- Slovak 3% Italian 2% Serbian 2%
- Foreign-born
- 5% · Canada
- Languages at home
- 93% English-only · Spanish 4% Other Asian/Pacific 2%
Political lean MEDSL · Cleveland
- 2024 margin
- Solid R (+35.0) · D 32.2% · R 67.2%
- 2008→2024 swing
- -15.1pp toward R · 2008: -19.9pp · 2024: -35.0pp
- All cycles
- 2024: R+35.0 2020: R+32.8 2016: R+30.6 2012: R+20.5 2008: R+19.9
Not yet ingested
- Civics
- —
Market trends
- HPI YoY
- ▼ -99.17%
- Current HPI
- 248.0613
- Rent YoY
- —
- Metro
- Shelby, NC
- State GDP YoY
- ▲ 3.28%
- F500 in state
- 26
Industry mix (Fortune 500 HQ in NC)
| Industry | F500 HQs | Revenue |
|---|---|---|
| Financial Services | 2 | $213B |
|
||
| Retail | 2 | $95B |
|
||
| Industrial Conglomerate | 1 | $38B |
|
||
| Metals / Steel | 1 | $35B |
|
||
| Utilities | 1 | $30B |
|
||
| Industrial Machinery | 1 | $19B |
|
||
Price history
+82.4% since first listed2 events — show timeline
- 2026-04-26 Listed $135,000 CANOPYMLS as Distributed by MLS Grid
- 2007-03-30 Sold (Public Records) $74,000 Public Records
Property tax history
+2.1%/yrLatest (2025): $944 · -2.1% YoY. Source: county tax records.
Cash-flow waterfall
monthlySold comps — $/sqft
last 12 mo · ≤1 miLoading sold comps…